Market Overview
| Study Period | 2020 - 2031 |
|---|---|
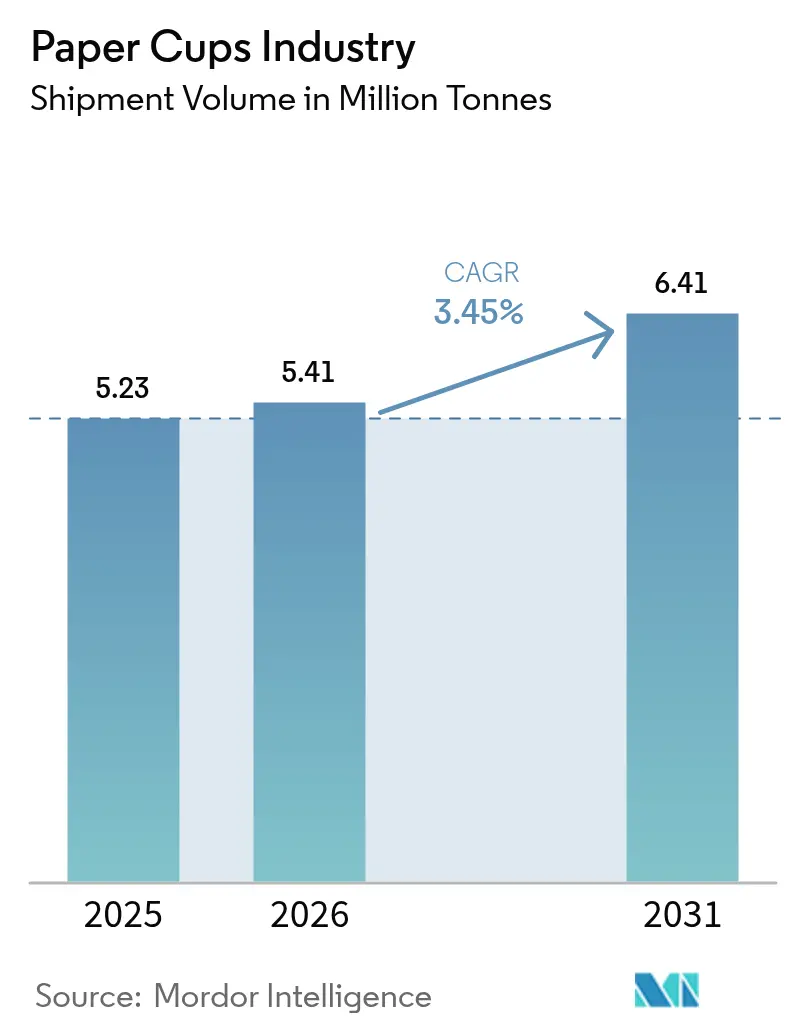
| Market Volume (2026) | 5.41 Million tonnes |
| Market Volume (2031) | 6.41 Million tonnes |
| Growth Rate (2026 - 2031) | 3.45% CAGR |
| Fastest Growing Market | Asia Pacific |
| Largest Market | Asia Pacific |
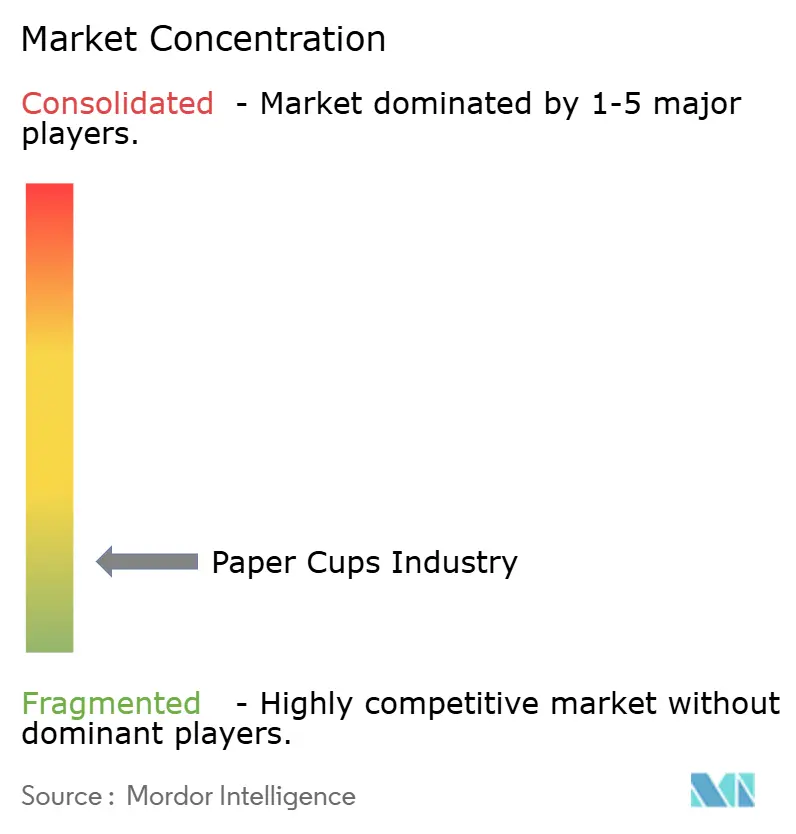
| Market Concentration | Low |
Major Players *Disclaimer: Major Players sorted in no particular order Image © Mordor Intelligence. Reuse requires attribution under CC BY 4.0. | |
Paper Cups Industry Analysis by Mordor Intelligence
Paper Cups Industry market size in 2026 is estimated at 5.41 Million tonnes, growing from 2025 value of 5.23 Million tonnes with 2031 projections showing 6.41 Million tonnes, growing at 3.45% CAGR over 2026-2031.
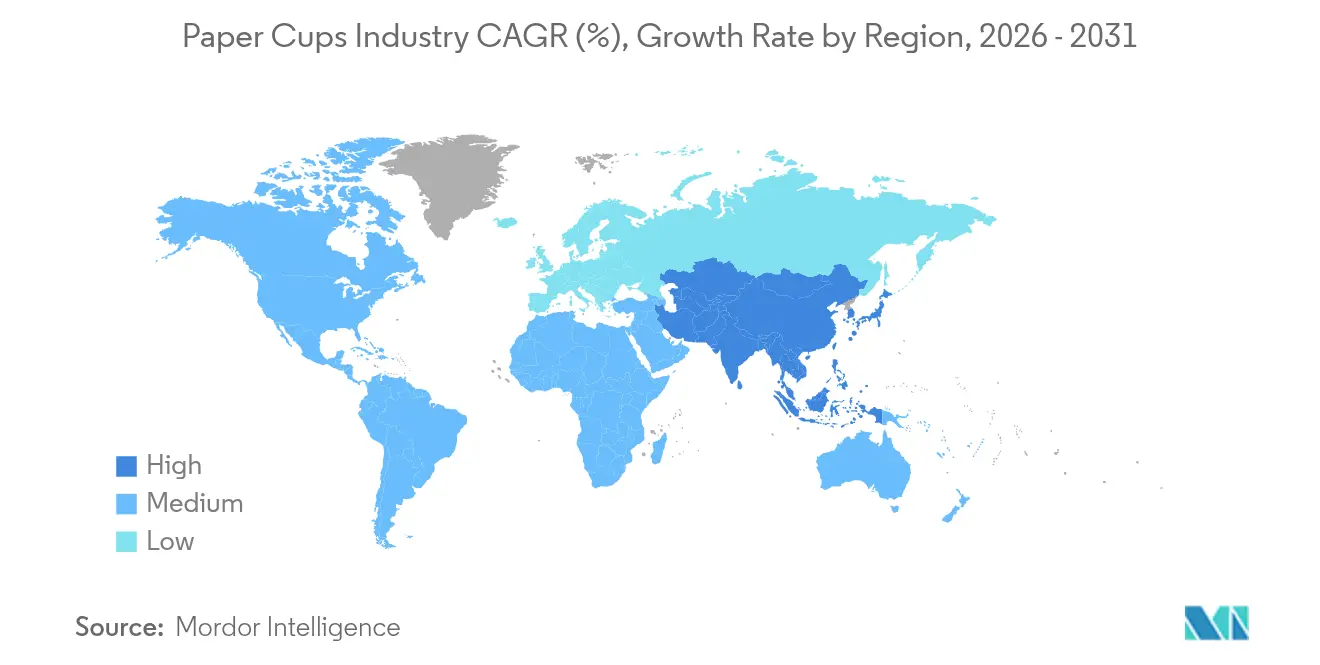
This steady rise in the paper cups market size reflects a regulatory push toward fiber‐based packaging, rapid upgrades in aqueous and mineral coatings, and the widening preference of food-service brands for easily recyclable formats. Shifts in consumer behavior toward take-away beverages, the roll-out of new QSR outlets, and technological advances in high-speed forming lines are widening volume demand, while premiumization in mature economies is lifting unit revenues. Asia-Pacific leads global tonnage with 39.56% share in 2024, propelled by urbanization and food-delivery growth, whereas North America and Europe are pivoting toward low-PFAS, fully recyclable hot-cup formats that command higher margins. Competitive intensity remains moderate; incumbents leverage scale, vertical integration, and R&D investment to stay ahead of emerging specialty converters that target niche sustainability needs.
Key Report Takeaways
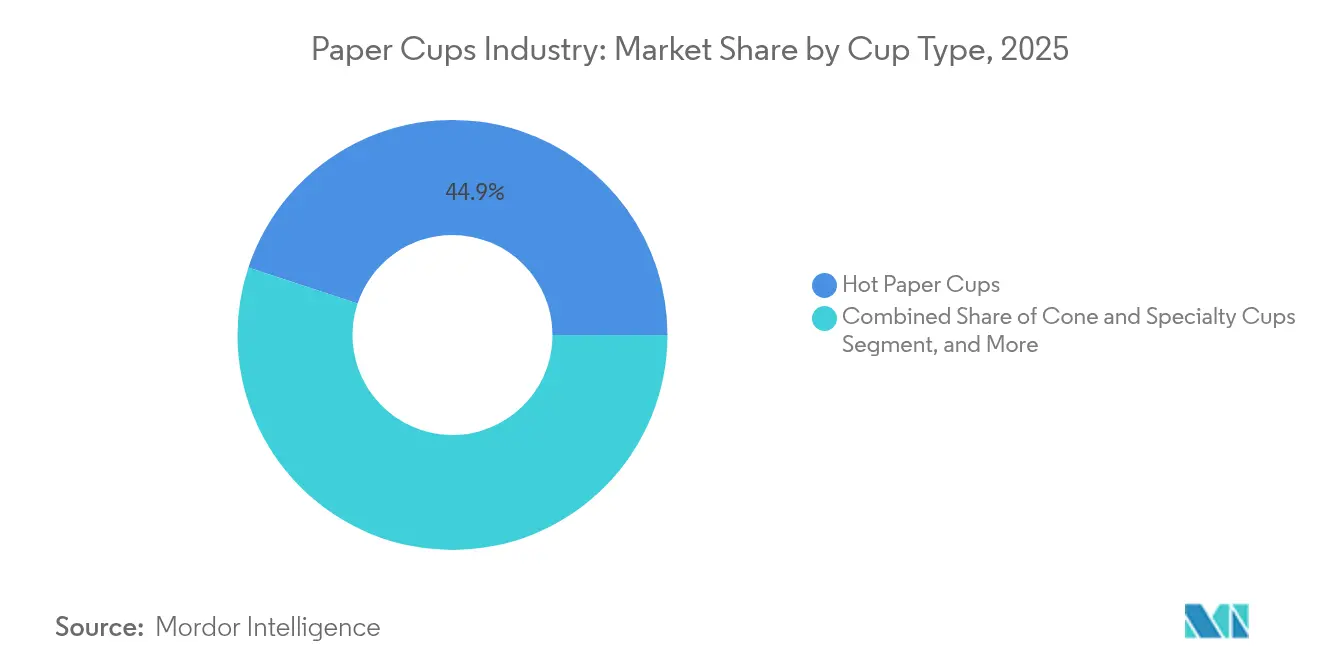
- By cup type, hot cups captured 44.92% of the paper cups market share in 2025; cold cups are projected to expand at a 5.21% CAGR through 2031.
- By wall type, double-wall formats held 47.10% revenue share in 2025, while single-wall designs are forecast to record a 5.78% CAGR to 2031.
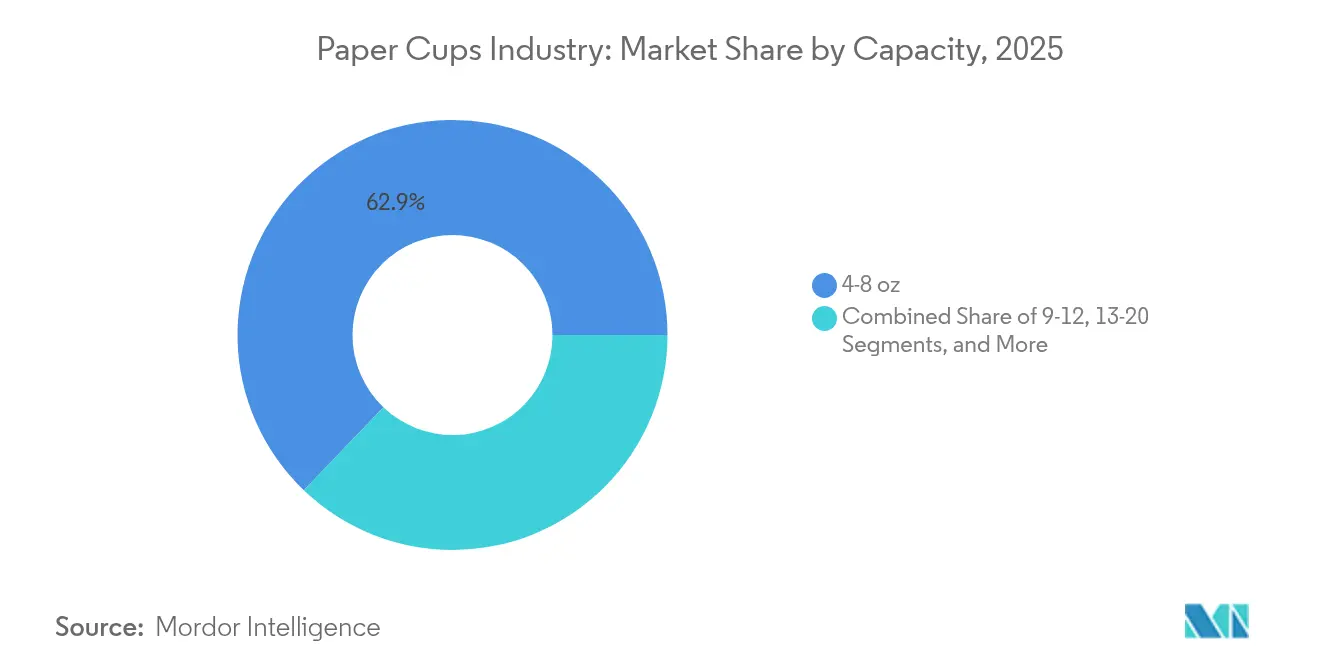
- By capacity, the 4–8 oz segment accounted for 62.85% of the paper cups market size in 2025; the 13–20 oz range is poised for a 6.75% CAGR during the forecast period.
- By end user, quick-service restaurants led with 57.85% share in 2025, yet institutional catering is set to grow fastest at a 6.02% CAGR to 2031.
- By distribution channel, direct B2B contracts controlled 54.60% of 2025 volumes, while online B2B marketplaces are expected to post a 6.98% CAGR through 2031.
- By region, Asia-Pacific dominated with 39.10% share in 2025, and the region is projected to maintain the highest 6.55% CAGR to 2031.
Note: Market size and forecast figures in this report are generated using Mordor Intelligence’s proprietary estimation framework, updated with the latest available data and insights as of 2026.
Global Paper Cups Industry Trends and Insights
Drivers Impact Analysis*
| Driver | (~) % Impact on CAGR Forecast | Geographic Relevance | Impact Timeline |
|---|---|---|---|
| Rising demand for on-the-go beverages | +0.8% | Global, with APAC and North America leading | Medium term (2-4 years) |
| Government bans on single-use plastics | +1.2% | Europe, APAC core, spill-over to Americas | Short term (≤ 2 years) |
| Expansion of QSR and food-delivery ecosystems | +0.9% | Global, concentrated in urban centers | Medium term (2-4 years) |
| Aqueous-coated fully-recyclable hot-cup launches | +0.4% | North America & EU, expanding to APAC | Long term (≥ 4 years) |
| Zero-waste stadium and event procurement mandates | +0.2% | North America, Europe, select APAC markets | Short term (≤ 2 years) |
| AI-driven high-speed forming lines lowering cost | +0.3% | Global manufacturing hubs | Long term (≥ 4 years) |
| Source: Mordor Intelligence | |||


Rising Demand for On-the-Go Beverages
Mobile lifestyles are lifting daily takeaway beverage volumes, positioning paper cups as the default pack for transit-friendly drinks. Urban commuters seek spill-proof formats that fit public-transport etiquette, and flexible work patterns elevate mid-day coffee runs. The U.S. food-delivery market is on track to generate USD 1.22 trillion in 2024, growing at 8.29% annually, underscoring how digital platforms translate app orders into incremental cup lifts. Specialty cafés expanding in Southeast Asia and the Middle East are introducing premium cup specifications that keep crema intact and print branding crisp. Loyalty apps encourage micro-purchases, which compound packaging volumes without requiring new footfall. Across regions, the result is a consistent, high-frequency pull on the paper cups market that aligns with retailer ambitions for frictionless service.
Government Bans on Single-Use Plastics
Legislators are turning single-use plastics into a costlier, restricted option, forcing a systemic shift toward fiber formats. The EU Packaging and Packaging Waste Regulation finalized in March 2024 mandates full recyclability and sets a 5% waste-cut target by 2030.[1]USDA Foreign Agricultural Service, “European Union Finalizes New Rules for Packaging and Packaging Waste Reduction,” usda.gov South Australia banned plastic beverage containers from September 2024, instantly channeling demand to fiber cup alternatives. Scotland intends to levy a 25-pence surcharge on each single-use beverage cup by end-2025, nudging retailers toward reusable loops while positioning paper cups as the least-cost single-use substitute. These legal levers create predictable replacement cycles that let converters rationalize capex in new forming lines.
Expansion of QSR and Food-Delivery Ecosystems
Restaurant footprints are widening. McDonald’s targets 50,000 outlets worldwide by 2027, including 1,000 new Chinese locations in 2025. Franchise analysts expect 20,000 net new units in 2025, lifting total establishments to 851,000 and pushing franchise output past USD 936.4 billion. Each store sources large volumes of branded hot and cold paper cups to meet dine-out, drive-thru, and delivery traffic. Automation and AI in back-of-house tasks compress service times, so turnover accelerates without adding labor—multiplying packaging throughput per counter. Delivery apps, which now also carry convenience and grocery orders, adopt food-service lid and insulation specs for parity, again rallying volume toward the paper cups industry.
Aqueous-Coated Fully-Recyclable Hot-Cup Launches
Barrier science is unlocking a circular promise long sought by brand owners. Smart Planet Technologies’ EarthCoating trims plastic use by up to 51% versus PE-lined cups and remains compatible with standard pulpers. Acceptance at more than 40 North American paper mills signals commercial readiness. Starbucks began rolling out mineral-coated, home-compostable cups across Europe in May 2025, confirming scale economics for global chains. Such innovations help retailers meet internal ESG metrics while justifying slight price premiums. The technology wave supports a margin-accretive layer in the paper cups market, drawing R&D commitments from incumbents and start-ups alike.
Restraints Impact Analysis*
| Restraint | (~) % Impact on CAGR Forecast | Geographic Relevance | Impact Timeline |
|---|---|---|---|
| Disposal and recycling infrastructure gaps | -0.6% | Global, acute in developing markets | Medium term (2-4 years) |
| Pulp-price volatility squeezing margins | -0.8% | Global manufacturing centers | Short term (≤ 2 years) |
| Reusable cup loop pilots in coffee chains | -0.4% | North America & Europe, expanding globally | Medium term (2-4 years) |
| PFAS-phase-out redesign and certification delays | -0.3% | North America & EU regulatory zones | Short term (≤ 2 years) |
| Source: Mordor Intelligence | |||
Disposal and Recycling Infrastructure Gaps
Many municipal systems still lack the equipment to delaminate cup fiber from coatings, so collected cups often end in landfill despite technical recyclability. Developing economies face limited material-recovery budgets, hindering paper cup sorting adoption. EU circular-economy rules tighten scrutiny on end-of-life pathways, and corporate buyers now demand evidence of regional cup recovery before awarding contracts. Until infrastructure catches up, the paper cups industry contends with reputational questions that can shift volumes to reusable pilots in niche cafés and venues.
Pulp-Price Volatility Squeezing Margins
Spot pulp prices broke EUR 1,380/MT in April 2024, up 7% month on month. Finnish strikes and an explosion at the Kemi mill cut supply, while energy costs inflated Chinese mill cash costs, leading APP and Nine Dragons to raise domestic paper prices in early 2025. Input shocks compress converter margins and delay machinery upgrades critical for capacity growth. Fluctuations also complicate pricing talks with large food-service chains that expect multi-year contracts, introducing risk into investment decisions across the paper cups industry.
*Our forecasts treat driver/restraint impacts as directional, not additive. The impact forecasts reflect baseline growth, mix effects, and variable interactions.
Segment Analysis
By Cup Type: Hot Cups Retain Lead as Coffee Culture Spreads
Hot cups represented 44.92% of 2025 volume, and the segment is projected to expand at a 5.24% CAGR through 2031. The paper cups industry benefits from a global surge in specialty coffee houses that require high heat retention and vivid on-cup graphics for brand storytelling. Premium barrier coatings and double-wall builds deliver both, letting chains justify higher ticket prices. Cold cups protect share in iced tea, soda, and smoothie channels, yet growth lags because competition from lightweight PET cups persists in warm climates. Cone and specialty designs occupy event catering niches where differentiation, not mass volume, rules. Starbucks’ switch to mineral coatings underscores how hot cups anchor R&D investment and margin capture. Cold-cup innovation focuses on strawless lids and fiber inks, but without the thermal barrier imperative, unit values stay lower.
Hot-cup leadership also reflects regional weather patterns and beverage rituals. Northern Europe and North America experience extended cool seasons that sustain daily hot-drink demand. In APAC mega-cities, iced beverage upticks occur, but hot tea traditions keep baseline consumption high enough to support a balanced portfolio. The paper cups industry adapts by offering modular lamination lines that toggle between hot and cold specs, ensuring asset utilization year-round. Specialty roasters ask suppliers for smaller minimum order quantities with frequent artwork changeovers, a service level only advanced converters can accommodate. This client dynamic moderates fragmentation by favoring scale players that bundle design, forming, and logistics.


By Wall Type: Double Wall Dominates but Single Wall Gains Pace
Double-wall cups held 47.10% share in 2025, preferred for superior hand comfort and heat insulation. They also serve as a tactile signal of premium positioning in chain cafés. Yet single-wall designs are forecast to grow fastest at 5.78% CAGR through 2031. This acceleration stems from cost-saving goals in price-sensitive markets and from coating technologies that allow thin walls without hurting performance. Aqueous liners with micro-air pockets give single-wall cups sufficient heat resistance, enabling QSR operators to downgrade wall count while meeting customer expectations. Triple-wall cups remain niche, used in industrial canteens where boiling-hot broths are common.
Shifts in e-commerce packaging policies—favoring lower-weight parcels to cut freight emissions—also help single-wall formats. Direct-to-consumer coffee roasters that ship boxed drink kits favor slim cups to fit tight carbon calculators. On factory floors, converters re-engineer forming cycles to align with single-wall geometry, increasing line speed. Still, double-wall cups keep a foothold in high-margin markets. Chains with strong brand equity treat the thicker feel as part of the sensory experience. The paper cups market thus offers a bifurcated product mix: single-wall for broad affordability and double-wall for revenue-rich flagships.
By Capacity: Core 4–8 oz Sizes Rule, Medium Cups Accelerate
The 4–8 oz range dominated at 62.85% share in 2025. Espresso-based beverages, airline service tray constraints, and portion control in corporate catering maintain this leading volume. Larger 13–20 oz cups exhibit the highest 6.75% CAGR through 2031 as QSR meal deals upsize drinks for value perception. North American QSR chains promote flavored lattes and frozen blends that require heftier cups, driving incremental fiber demand. The 9–12 oz bracket remains the everyday takeaway coffee size across Europe, balancing comfort carry with calorie awareness.
Fast-growing middle classes in Southeast Asia accept larger cup sizes when adopting Western café culture, pushing local roasters to expand capacity portfolios. McDonald’s global outlet expansion deepens such conversion curves. Craft café chains embed QR codes on medium cups to direct customers to loyalty apps, turning cup real estate into a marketing asset. Conversely, airline and rail operators prioritize stack height, keeping them loyal to smaller cups despite stable traffic volumes. Overall, capacity segmentation mirrors regional lifestyle preferences but shares one commonality—structural growth for the paper cups industry.
By End User: QSRs Still Ahead While Institutions Surge
Quick-service restaurants delivered 57.85% of 2025 off-take, forming the backbone of recurring volume in the paper cups market. Standardized recipes, rigid portion specs, and global procurement hubs make QSR chains the anchor customers for converters. Institutional catering posts a 6.02% CAGR—the fastest among end users—on the back of corporate zero-waste mandates and the resurgence of large events such as concerts and trade shows. Stadium operators implement closed-loop drinkware programs, creating dual demand for recyclable cups and for reusable pilots that need back-up disposables in overflow scenarios.
Coffeehouse chains occupy a mid-growth lane, protected by brand loyalty and premium beverage trendlines. Vending operators maintain a steady but mature requirement profile, favoring compact cup sleeves and tight unit costs. Transportation caterers hold specialized specs—lightweight, narrow rims for trolley fit—and their growth follows passenger load factors. Institutional buyers now integrate life-cycle analysis clauses in tenders, rewarding suppliers with transparent end-of-life data. This procurement shift legitimizes infrastructure investments by large converters and nudges the paper cups industry toward traceable fiber sourcing and on-site take-back services.
By Distribution Channel: Direct B2B Prevails as Digital Marketplaces Scale
Direct B2B contracts held 54.60% share in 2025, thanks to customized print runs, forecast sharing, and technical support that large chains demand. However, online B2B marketplaces are anticipated to climb fastest at 6.98% CAGR to 2031. The convenience of price comparison, real-time delivery tracking, and integrated carbon calculators make digital portals attractive to mid-tier food-service operators without dedicated sourcing teams. Some converters list on these platforms to test new regions with limited sales overhead.
Regional distributors and wholesalers still supply independent cafés and small caterers where mixed product baskets outweigh the benefits of single-supplier contracts. Nonetheless, their share gradually erodes as online platforms enhance last-mile logistics. For global chains, direct contracts remain irreplaceable due to volume complexity and the need for proprietary barrier specifications. Even here, procurement integrates e-tender portals for bid transparency, blending relationship depth with digital efficiency. These patterns collectively reinforce steady diversification in the paper cups industry.
Geography Analysis
Asia-Pacific accounted for 39.10% of global tonnage in 2025 and is projected to grow at 6.55% CAGR to 2031, the highest among all regions. China’s paper sector added 10% domestic capacity in 2024, ensuring ample substrate for cup converting in 2025. India’s packaging market is expected to reach USD 204.81 billion by 2025, expanding at 26.7% CAGR, a scale that deepens end-market pull for cups in food delivery. Vietnam’s packaging growth of 9.73% annually demonstrates manufacturing competitiveness that also feeds cup exports across ASEAN. Rising disposable incomes and a shift toward branded café culture underpin regional volume, making APAC the growth anchor of the paper cups industry.
North America remains a mature yet technologically progressive market. The PFAS phase-out finalized by the U.S. FDA in February 2025 is propelling adoption of aqueous and mineral barrier coatings. Georgia-Pacific invested USD 2 billion in seven U.S. facilities in 2024 to sustain production agility and comply with sustainability targets. Modern recycling systems and corporate ESG reporting encourage premium offerings, with converters competing on end-of-life certification rather than pure price. Unit growth is slower, but margins are stronger through value-added specs such as fiber lids.
Europe follows a regulation-first trajectory. Mandatory recyclability by 2030 ensures steady substitution away from plastic packaging to paper-based cups. Huhtamaki expanded fiber-lid capacity in Northern Ireland in October 2024 to meet regional demand for plastic-free components. The region adopts pay-per-cup or tax incentives to nudge consumers toward reusables but still positions fiber cups as the compliant single-use option. Eastern European growth pockets, driven by rising QSR penetration, help offset Western Europe’s mature volumes.
The Middle East and Africa and South America constitute emerging opportunity zones. Infrastructure gaps and economic swings temper immediate scale, yet food-delivery apps and international coffee chains are planting early seeds. Converters form joint ventures with local paper mills to localize supply, mitigating currency risk and import tariffs. While their contribution to the paper cups market size is still modest, longer-term demographic trends suggest incremental tonnage upside.

Competitive Landscape
Top Companies in Paper Cups Industry
The paper cups market features moderate fragmentation, where top multinationals coexist with a long tail of regional converters. Huhtamaki, Dart Container, and Georgia-Pacific lead on capital intensity, R&D pipelines, and multi-continent supply networks. They integrate upstream pulp sourcing and downstream customer design support, ensuring quality and cost control. Graphic Packaging International is investing USD 136 million in its Macon mill to add curtain coating capacity, keeping barrier innovation in-house.[3]Georgia Department of Economic Development, “Graphic Packaging International to Invest USD 136 Million,” georgia.org
Sustainability drives headline strategies. Dart Container teamed with PulPac in September 2024 to introduce dry-molded fiber, reducing CO2 emissions by 80% and lifting forming speed. Seda Group unveiled EcoFit fiber lids in January 2025, illustrating how niche players carve space through product differentiation. Larger incumbents deploy AI-assisted line controls to ease labor shortages and maintain yield. Packaging automation outlays grow in tandem, with the broader packaging automation market projected to double to USD 158.60 billion by 2034.
Regional challengers leverage proximity advantages. Several Chinese converters scale rapidly by pairing local pulp to export-oriented cup forming. Meanwhile, U.S. specialty firms target stadium concessions with design-rich limited-edition runs. Corporate procurement teams now assess recyclability, supply-chain transparency, and GHG accounting in vendor scorecards, raising the bar for new entrants. This evolving checklist narrows viable supplier pools and lends established firms a structural edge, though agile newcomers can disrupt with patented coatings or closed-loop service bundles.
Paper Cups Market Leaders
Huhtamaki oyj
Kap Cones Private Limited
Graphic Packaging International LLC
Dart container corporation
Converpack Inc.
- *Disclaimer: Major Players sorted in no particular order

Recent Industry Developments
- March 2025: Graphic Packaging International announced a USD 136 million upgrade at its Macon mill to add curtain-coater technology and retain 460 jobs.
- February 2025: The U.S. FDA confirmed the end of PFAS use in U.S. food packaging, accelerating alternative barrier adoption.
- January 2025: Seda Group released the EcoFit Lid and compostable double-wall cold cups to address the growing demand for plastic-free beverage packaging.
- December 2024: Georgia-Pacific approved a USD 90 million tissue expansion that indirectly supports cupstock capacity.


Global Paper Cups Industry Report Scope
The study tracks the demand for paper-based cups in terms of revenue (USD). The scope of the study is limited to paper cups only. The study tracks the market size in revenue for the respective end-user industry verticals in the respective countries from the listed product types. The study factors in the impact of geopolitical factors on the paper cups market, key themes, and end user-related demand cycles.
The paper cups market is segmented by cup type (hot paper cups, cold paper cups), end user (quick service restaurants, institutional, and other end users), wall type (single wall paper cups, double wall paper cups, and triple wall paper cups), and geography (North America [United States, Canada], Europe [United Kingdom, France, Germany, Italy, Spain, Rest of Europe], Asia-Pacific [China, Japan, India, Australia, and Rest of Asia-Pacific], Latin America [Brazil, Argentina, Mexico, and Rest of Latin America], Middle East and Africa [Saudi Arabia, South Africa, Egypt, and Rest of Middle East and Africa]). The market sizes and forecasts are provided in value (USD) terms for all the above segments.
By Cup Type
| Hot Paper Cups |
| Cold Paper Cups |
| Cone and Specialty Cups |
By Wall Type
| Single Wall |
| Double Wall |
| Triple Wall |
By Capacity (oz)
| 4-8 |
| 9-12 |
| 13-20 |
| >20 |
By End User
| Quick-Service Restaurants (QSR) |
| Coffee Chains and Vending Operators |
| Institutional Catering |
| Airlines and Railways |
| Others |
By Distribution Channel
| Direct (B2B Contracts) |
| Distributors and Wholesalers |
| Online B2B Marketplaces |
By Geography
| North America | United States | |
| Canada | ||
| Mexico | ||
| Europe | Germany | |
| United Kingdom | ||
| France | ||
| Italy | ||
| Spain | ||
| Russia | ||
| Rest of Europe | ||
| Asia-Pacific | China | |
| India | ||
| Japan | ||
| South Korea | ||
| Australia and New Zealand | ||
| Rest of Asia-Pacific | ||
| Middle East and Africa | Middle East | United Arab Emirates |
| Saudi Arabia | ||
| Turkey | ||
| Rest of Middle East | ||
| Africa | South Africa | |
| Nigeria | ||
| Egypt | ||
| Rest of Africa | ||
| South America | Brazil | |
| Argentina | ||
| Rest of South America | ||
| By Cup Type | Hot Paper Cups | ||
| Cold Paper Cups | |||
| Cone and Specialty Cups | |||
| By Wall Type | Single Wall | ||
| Double Wall | |||
| Triple Wall | |||
| By Capacity (oz) | 4-8 | ||
| 9-12 | |||
| 13-20 | |||
| >20 | |||
| By End User | Quick-Service Restaurants (QSR) | ||
| Coffee Chains and Vending Operators | |||
| Institutional Catering | |||
| Airlines and Railways | |||
| Others | |||
| By Distribution Channel | Direct (B2B Contracts) | ||
| Distributors and Wholesalers | |||
| Online B2B Marketplaces | |||
| By Geography | North America | United States | |
| Canada | |||
| Mexico | |||
| Europe | Germany | ||
| United Kingdom | |||
| France | |||
| Italy | |||
| Spain | |||
| Russia | |||
| Rest of Europe | |||
| Asia-Pacific | China | ||
| India | |||
| Japan | |||
| South Korea | |||
| Australia and New Zealand | |||
| Rest of Asia-Pacific | |||
| Middle East and Africa | Middle East | United Arab Emirates | |
| Saudi Arabia | |||
| Turkey | |||
| Rest of Middle East | |||
| Africa | South Africa | ||
| Nigeria | |||
| Egypt | |||
| Rest of Africa | |||
| South America | Brazil | ||
| Argentina | |||
| Rest of South America | |||


Key Questions Answered in the Report
What is the current market size of the paper cups industry?
The paper cups market size stands at 5.41 million tonnes in 2026 and is projected to reach 6.41million tonnes by 2031.
Which region leads the paper cups market?
Asia-Pacific leads with 39.10% share in 2025 and is forecast to grow at 6.55% CAGR through 2031.
How are regulations influencing paper cup demand?
Global bans on single-use plastics, such as the EU’s mandatory recyclability rule and state-level prohibitions in Australia, are driving a structural shift from plastic to fiber cups.
Which segment holds the largest market share by cup type?
Hot cups dominate with 44.92% share in 2025 due to strong coffee culture and thermal performance needs.
Why are aqueous and mineral coatings important?
These coatings enable full recyclability and compliance with PFAS-free mandates, helping brands meet sustainability targets without sacrificing cup performance.
How fast are online B2B marketplaces for cups growing?
Online B2B marketplaces in the paper cups industry are projected to record a 6.98% CAGR from 2026 to 2031, reflecting procurement digitalization trends.
Page last updated on:


