
Europe Biodegradable Cups Market Size and Share
Market Overview
| Study Period | 2020 - 2031 |
|---|---|
| Forecast Data Period | 2026 - 2031 |
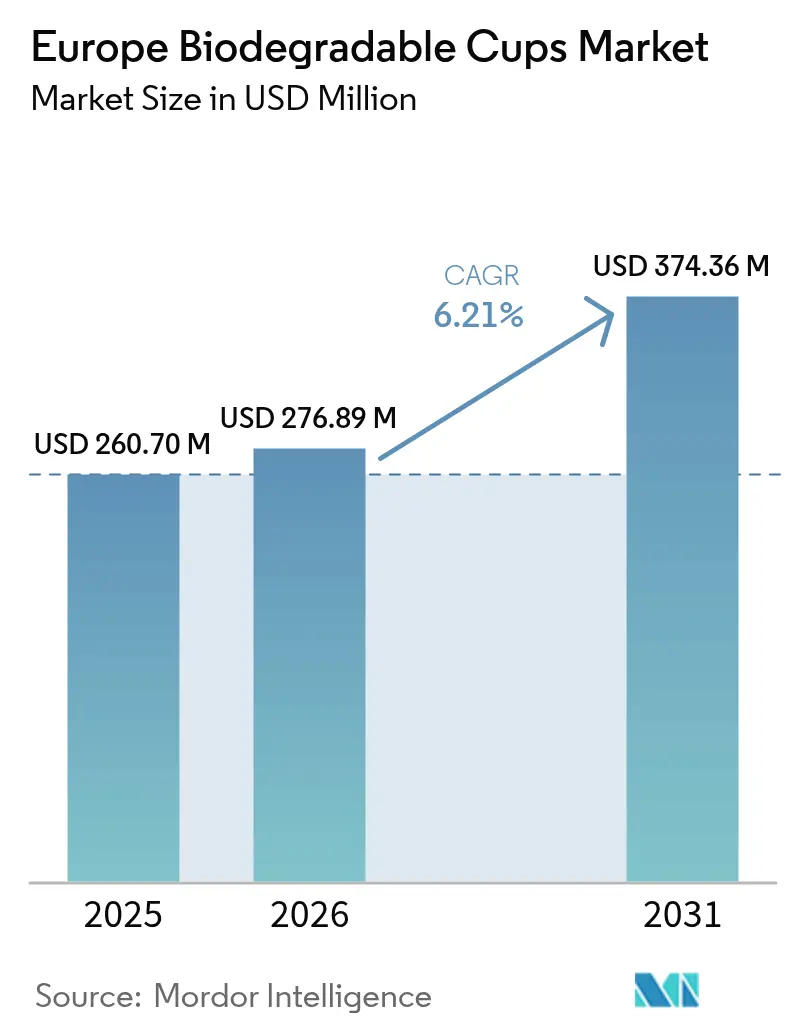
| Base Year Market Size (2025) | USD 260.7 Million |
| Market Size (2026) | USD 276.89 Million |
| Market Size (2031) | USD 374.36 Million |
| Growth Rate (2026 - 2031) | 6.21 % |
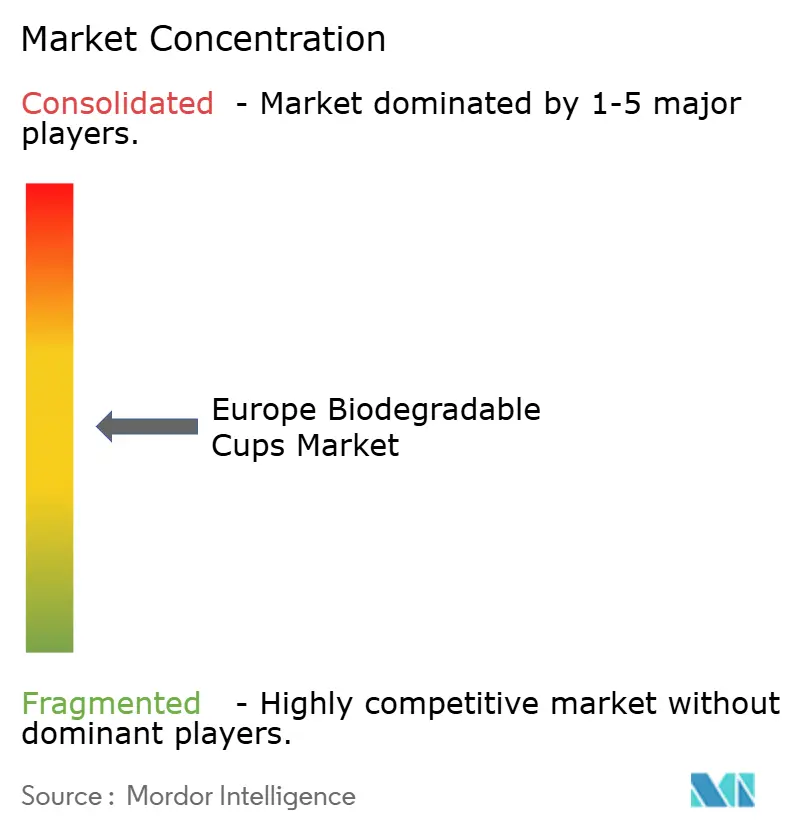
| Market Concentration | Medium |
Major Players *Disclaimer: Major Players sorted in no particular order Image © Mordor Intelligence. Reuse requires attribution under CC BY 4.0. | |
Europe Biodegradable Cups Market Analysis by Mordor Intelligence
The Europe biodegradable cups market size is expected to grow from USD 260.7 million in 2025 to USD 276.89 million in 2026 and is forecast to reach USD 374.36 million by 2031 at 6.21% CAGR over 2026-2031. Growth is driven by sweeping single-use plastic bans, falling polylactic acid (PLA) resin prices, and brand-level procurement mandates, while headwinds arise from deposit-return schemes and inadequate composting infrastructure. Paper-based cups held a 38.56% share of the Europe biodegradable cups market in 2024, but bio-plastics are expanding faster as the PLA oversupply narrows their cost premium. Beverages remain the anchor application; yet, institutional buyers, such as malls, offices, and universities, now outpace cafés because public tenders increasingly specify certified compostable packaging. Spain delivers the fastest country growth as regional bans bite, whereas Germany’s Mehrwegpflicht law caps single-use demand despite its advanced composting network. Competitive rivalry stays high: integrated fiber leaders defend volumes, pure-play specialists monetize certification niches, and e-commerce distributors scale online access to sustainable SKUs.
Key Report Takeaways
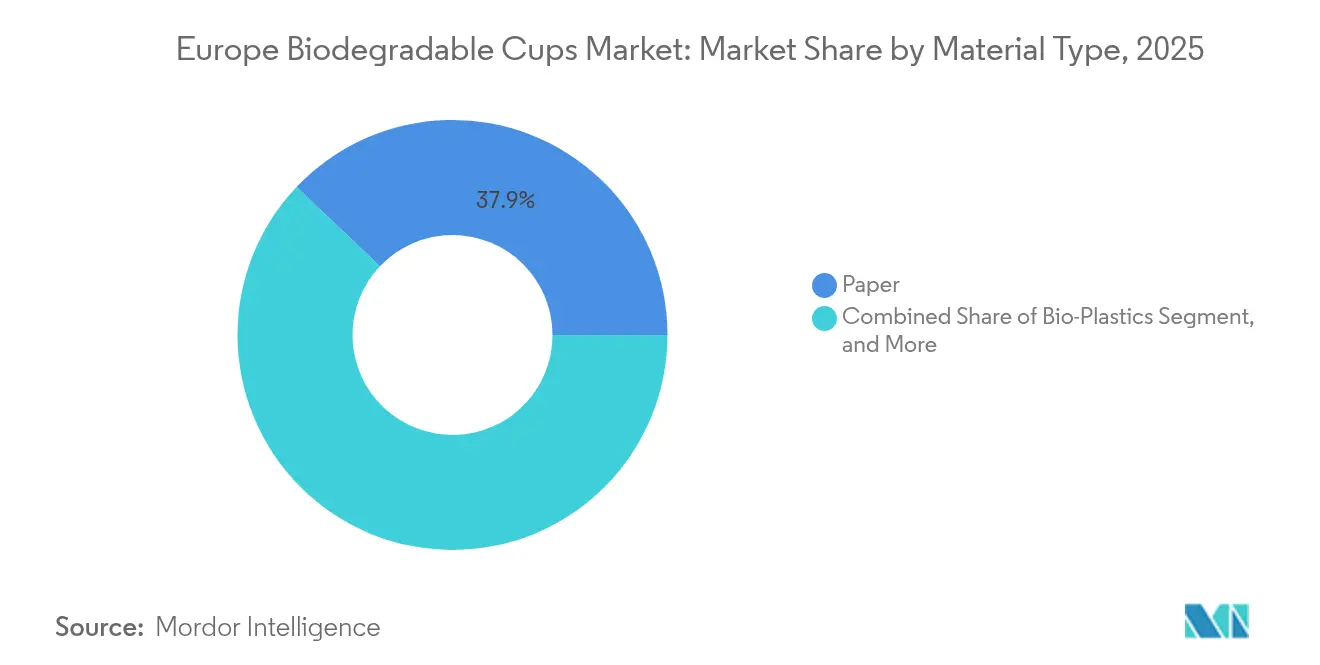
- By material type, paper captured 37.92% of the Europe biodegradable cups market share in 2025, while bio-plastics are projected to expand at an 8.02% CAGR between 2026 and 2031.
- By application, beverages accounted for a 70.12% share of the Europe biodegradable cups market size in 2025 and are forecast to grow at a 7.05% CAGR through 2031.
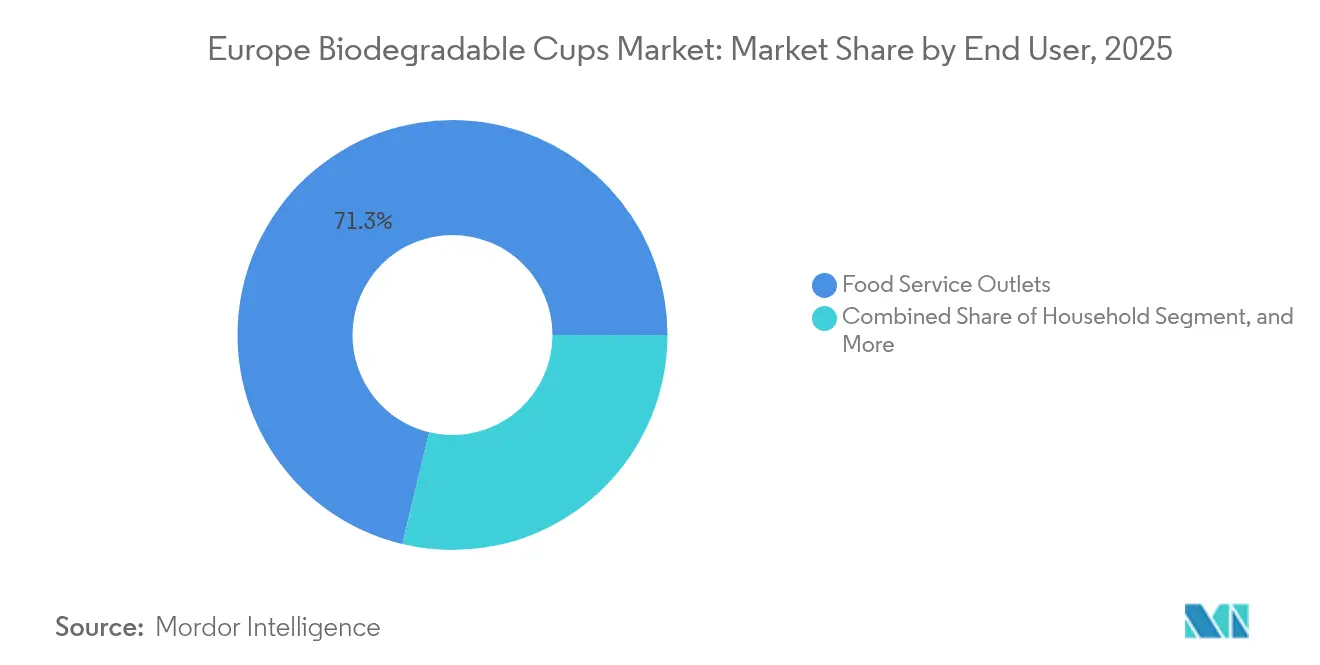
- By end user, food service outlets held a 71.25% share of the Europe biodegradable cups market size in 2025, whereas the institutional segment is poised for the quickest growth at a 7.54% CAGR to 2031.
- By distribution channel, offline sales accounted for a 67.88% share of the Europe biodegradable cups market size in 2025; however, online platforms are expected to log the highest 7.28% CAGR over 2026-2031.
- By country, the United Kingdom commanded a 21.55% share of regional revenue in 2025, while Spain is expected to register the fastest growth rate of 7.98% during the forecast period.
Note: Market size and forecast figures in this report are generated using Mordor Intelligence’s proprietary estimation framework, updated with the latest available data and insights as of 2026.
Market Trends and Insights
Drivers Impact Analysis of Europe Biodegradable Cups Market*
| Driver | (~) % Impact on CAGR Forecast | Geographic Relevance | Impact Timeline |
|---|---|---|---|
| Growing Demand for Sustainable Foodservice Packaging | +1.8% | UK and Benelux strongest | Medium term (2-4 years) |
| Stringent EU Single-Use Plastics Regulations | +2.1% | EU-wide, peak in Spain and France | Short term (≤ 2 years) |
| Coffee Chain Commitments to 100% Compostable Cups | +1.3% | UK, Germany, France | Short term (≤ 2 years) |
| Excess PLA Production Capacity Drives Price Cuts | +1.2% | All European markets | Medium term (2-4 years) |
| Retailer-Led Private-Label Eco-Packaging Race | +0.9% | UK, Germany, France | Medium term (2-4 years) |
| AI-Optimised Coating Lines Reduce Scrap Rates | +0.6% | Germany, UK | Long term (≥ 4 years) |
| Source: Mordor Intelligence | |||
Growing Demand for Sustainable Foodservice Packaging
European consumers are showing a growing intolerance for single-use plastics. A 2024 Eurobarometer survey reported that 78% now factor sustainability into venue choice.[1]Eurobarometer, “Special Eurobarometer 523: Attitudes of Europeans Towards Waste Management and the Circular Economy,” europa.eu Contract caterers and quick-service chains translate sentiment into procurement policies, as evidenced by Compass Group shifting 62% of cup purchases to compostable materials across 2,000 sites. McDonald’s committed in February 2025 to fiber cups with water-based coatings for every UK and Ireland outlet, eliminating polyethylene liners. EU regulations reinforce preference, mandating that all packaging be recyclable or compostable by 2030. Willingness to pay varies—Swedish patrons accept price increases of up to 12%, while operators in price-sensitive Italy and Spain demand cost parity before switching.
Stringent EU Single-Use Plastics Regulations
Member states are expected to reach full enforcement of the Single-Use Plastics Directive in 2024, closing loopholes and expanding bans. Spain prohibited the use of non-compostable cups in hospitality venues as of January 2024, with fines of up to EUR 600,000.[2]Boletín Oficial del Estado, “Real Decreto 1055/2022,” boe.es France’s AGEC law set a 2025 target for 20% reusable packaging but simultaneously banned Oxo-degradable plastics, boosting short-run demand for certified compostable cups. Italy now requires single-use cups to contain at least 40% bio-based content, essentially reserving shelf space for PLA-lined or fiber alternatives. Extended producer responsibility fees on non-recyclable cups in Germany and the Netherlands raise the relative cost of traditional plastics, accelerating the adoption of biodegradable cups in Europe.
Excess PLA Production Capacity Drives Price Cuts
Capacity expansions by NatureWorks and TotalEnergies Corbion created a PLA surplus, which pushed spot prices down by about 15% between Q1 2024 and Q1 2025.[3]ICIS, “Polylactic Acid (PLA) Pricing Data Q1 2024 – Q1 2025,” icis.com European converters captured the benefit: Vegware reported a 3.2-percentage-point decline in raw-material costs, allowing it to hold prices while widening its margins. As PLA premiums over polyethylene shrink to roughly 18%, bioplastic cups gain ground in high-volume beverage chains, cementing their appeal in the Europe biodegradable cups market.
Coffee Chain Commitments to 100% Compostable Cups
Starbucks achieved 94% penetration of compostable cups across 3,000 European stores by September 2024 and aims to reach 100% by December 2025. Costa Coffee completed a PLA-lined cup rollout in March 2024, affecting 200 million units annually. Pret A Manger plans to drop plastic lids by June 2025. These large buyers impose sustainability benchmarks on smaller chains, compounding demand for certified compostable cups across the Europe biodegradable cups market.
Restraints Impact Analysis of Europe Biodegradable Cups Market*
| Restraint | (~) % Impact on CAGR Forecast | Geographic Relevance | Impact Timeline |
|---|---|---|---|
| Cost Premium Versus Conventional Paper and Plastic Cups | -1.4% | Italy, Spain, Rest of Europe | Medium term (2-4 years) |
| Patchy Industrial Composting Infrastructure | -1.1% | France, Italy, Rest of Europe | Long term (≥ 4 years) |
| Rising Pulp Prices and Supply Volatility | -0.8% | EU-wide | Short term (≤ 2 years) |
| Reusable Cup Deposit Systems Cannibalise Demand | -1.0% | Germany, France, Benelux | Medium term (2-4 years) |
| Source: Mordor Intelligence | |||
Cost Premium Versus Conventional Paper and Plastic Cups
In Q1 2025, a 12-ounce PLA-lined cup sold for EUR 0.09-0.12, compared to EUR 0.07-0.09 for polyethylene-coated units, resulting in a 15-25% premium that margin-constrained cafés struggle to absorb. Independent operators, especially in Southern Europe, exhibit high price elasticity: 54% would postpone switching if unit costs rise more than EUR 0.03. While EPR fees reduce the penalty on certified cups in Germany and France, similar offsets remain minimal in Italy or Central Europe, tempering volume conversion in the Europe biodegradable cups market.
Patchy Industrial Composting Infrastructure
Industrial composting coverage spans 75% of residents in Germany, but only 55% in France and under 40% in Italy. Cups discarded in regions without high-temperature facilities often end up in landfills or incineration, eroding environmental claims and exposing brands to accusations of greenwashing. Building a new plant costs EUR 5-15 million and takes up to two years for permitting, an investment many municipalities defer. The disposal gap creates operational friction for small foodservice outlets that must segregate waste, slowing end-user adoption of biodegradable cups across the European market.
*Our forecasts treat driver/restraint impacts as directional, not additive. The impact forecasts reflect baseline growth, mix effects, and variable interactions.
Europe Biodegradable Cups Market Segment Analysis
By Material Type:
Bio-Plastics Narrow the Cost Gap with PaperBio-plastics represent the fastest-growing material class, forecast to rise at 8.02% CAGR as oversupply trims PLA resin prices and spurs substitution away from polyethylene liners. PBAT blends captured an additional 18% share, thanks to their improved heat resistance for hot drinks. Emerging polyhydroxyalkanoates attract coastal operators because marine degradability eases litter liability. Paper retains the largest slice at 37.92% but expands more slowly, partly because fiber cups still underperform PLA in high-temperature service. Elevated pulp costs, with European kraft pulp averaging EUR 1,420 per ton (USD 1,562) in Q1 2025, also weigh on converter margins. Bagasse and wheat-straw substrates draw policy support under EU agricultural-waste valorization schemes, yet remain niche due to limited forming capacity. The traction of bioplastics underlines a broader pivot: as material parity improves, the Europe biodegradable cups market growth increasingly flows to resins that deliver high barrier performance without compromising compostability.
The paper’s durability issues with steaming liquids and its reliance on water-based coatings constrain its long-term outlook. Nonetheless, its ubiquity in converter lines and consumer familiarity keep it the entry-level sustainable option for price-sensitive buyers. In contrast, bio-plastics now command greater attention in requests for quotation issued by institutional buyers, signaling that procurement teams value certifications and heat performance over legacy supply relationships. This mix shift ensures that bio-plastics’ unit volumes will close in on paper by the end of the decade, even if the latter maintains a legacy footprint in the cold-drink service. Europe biodegradable cups market players, able to flex between fiber- and resin-lined cups, stand to secure the widest customer base.



By Application:
Beverages Remain, King While Food Gains ShareIn 2025, beverages held a dominant 70.12% share of the Europe biodegradable cups market, with projections indicating a robust 7.05% CAGR growth rate extending through 2031. Hot drinks drive most demand, yet iced beverages deliver incremental summer spikes that reward converters with agile scheduling. Beverage operators prize tight dimensional tolerances for automated lid fit, nudging them toward higher-spec PLA or dual-layer fiber cups.
The food segment, encompassing soups, noodles, and desserts, is projected to grow at a rate of approximately 6.55% CAGR, driven by the expansion of quick-service chains into hot-food-to-go menus. Larger cup formats push average selling prices higher than those of drinks, thereby cushioning converter margins. However, variable fill temperatures and oil content necessitate multilayer construction, which raises costs and limits uptake in smaller cafés. Europe biodegradable cups market share in food applications grows slowly but steadily because institutional buyers value closed-loop waste contracts that include food residues plus cup composting. As these contracts proliferate, food cups gain a firmer beachhead alongside beverages.
By End User:
Institutional Buyers AccelerateFood service outlets held a 71.25% share of the European biodegradable cups market size in 2025, whereas Institutional procurement, encompassing offices, malls, hospitals, and universities, experiences a 7.54% CAGR as EU green purchasing guidelines shift from voluntary to mandatory. The Europe biodegradable cups market size for institutional channels reached approximately USD 107.54 million in 2026 and is expected to reach USD 154.73 million by 2031. Public agencies and corporate landlords now specify EN 13432 certification in catering contracts, tilting demand toward suppliers with third-party audit trails.
Foodservice outlets still account for more than half of unit volumes, although their growth moderates to near 6.5% as deposit-return schemes shave single-use sales in Germany and France. Independent cafés in Italy and Spain remain price-conscious, prolonging mixed inventories of conventional and compostable cups. Household retail remains the smallest end-user slice but benefits from e-commerce bundling of eco-friendly partyware kits that drive impulse purchases. The widening institutional share reinforces the resilience of the Europe biodegradable cups market because contract terms often lock in multi-year volumes, sheltering suppliers from consumer footfall volatility.
By Distribution Channel:
Online Platforms Democratize AccessIn 2025, offline sales accounted for 67.88% of total revenue, but online platforms are poised to achieve the highest growth rate, with a projected CAGR of 7.28% from 2026 to 2031. B2B marketplaces list granular SKU data, live inventory, and carbon footprint metrics, allowing small cafés to sidestep minimum-order hurdles that once deterred sustainable packaging. Amazon Business’s next-day delivery compresses lead times and pressures legacy distributors to match service levels.
Offline channels preserve an edge with high-volume chains that negotiate annual tenders bundled with other consumables. In Southern and Eastern Europe, offline penetration holds because digital adoption lags and last-mile logistics remain fragmented. However, even traditional distributors are digitizing; Bunzl reported that e-sales rose to 34% of European revenue in 2024. This hybrid future suggests that suppliers must integrate seamlessly with electronic data interchange while retaining field sales for consultative pitches, a duality that defines winning go-to-market strategies in the Europe biodegradable cups market.
Geography Analysis
United Kingdom Biodegradable Cups Market
The United Kingdom held a 21.55% share in 2025 and is expected to advance at a 6.52% CAGR through 2031, driven by coffee-chain mandates and a Plastic Packaging Tax that adds GBP 0.02 (USD 0.025) per conventional cup, narrowing the cost gap with certified compostables. Composting infrastructure covers approximately 70% of residents, providing brands with confidence in their end-of-life claims. Near-term upside is moderated as reusable pilot programs gain media traction in large cities, but institutional procurement maintains baseline demand stability.
Germany Biodegradable Cups Market
Germany owned roughly 23.65% of the Europe biodegradable cups market share in 2025, but will trail the regional average at 5.55% CAGR because Mehrwegpflicht forces outlets above 80 square meters to offer reusable options, reducing single-use volumes by up to one-tenth. Nevertheless, its 1,200 composting sites, strong certification culture, and corporate sustainability agendas prevent outright contraction.
Spain Biodegradable Cups Market
Spain posts the fastest 7.98% CAGR, driven by bans in Catalonia and Valencia and a rebound in tourist arrivals, which are expected to exceed 85 million in 2024. Coastal hospitality clusters with limited space for dishwashing equipment often find compostable disposables to be the only feasible single-use option. Limited composting coverage outside major metropolitan areas tempers the upside but does not derail momentum where regional governments provide dedicated organic waste collection.
France and Italy Biodegradable Cups Market
France and Italy ride mid-tier growth at roughly 6.33% and 6.05% CAGR, respectively. France’s AGEC law mandates 20% reusable packaging by 2025, which slows growth in Paris and Lyon, while the lack of nationwide cup deposit schemes still leaves room for compostables. Italy’s 40% bio-based-content rule channels buyers toward PLA and fiber, yet fragmented cafés resist switching until premiums narrow further.
Broader European Markets
Benelux markets benefit from dense composting networks and EPR fee differentials, but contribute modest volumes due to their small population base. Nordic and Central European countries deliver mixed results. Sweden leans heavily into reusables, whereas Poland’s quick-service boom boosts demand for certified compostables.
Regulatory Landscape
The market operates under a tightening EU framework led by the Single-Use Plastics Directive (EU) 2019/904 and the Packaging and Packaging Waste Regulation (EU) 2025/40 (PPWR). PPWR entered into force on 11 February 2025 and applies from 12 August 2026, shifting requirements from a directive-based approach to a directly applicable regulation and increasing compliance pressure for cup formats that include plastic linings, via labeling requirements and extended producer responsibility pathways tied to plastic content.
For compostability claims, EU policy direction is also more restrictive and evidence-led. PPWR limits compostable packaging to defined use cases and anchors industrial compostability to EN 13432, while still allowing Member States to mandate compostable packaging for specific items under Article 9 where bio-waste collection and treatment infrastructure exists. Alongside this, the European Commission continued SUPD implementation monitoring, including an implementation report published on 16 April 2026 that highlighted beverage cup placements on the EU market, strengthening scrutiny on reduction measures and data reporting obligations across Member States.
Value Chain Analysis
The value chain starts with fiber (pulp, paperboard, and molded fiber feedstocks) and bio-resins, notably PLA and other compostable polymers, plus functional barrier systems such as water-based dispersion coatings and sealing varnishes that support performance needs while navigating plastic-content obligations. Converters and cup formers then print, coat/laminate, and form cups, with production distributed across Europe among specialist manufacturers (for example, Cup Print in Ireland, EcoCuply in Kosovo, Bio-Cup in the UK, and Karibou in Spain) and larger integrated packaging groups that can secure fiber or resin supply and run multi-site manufacturing.
Commercial flows run through foodservice distributors, contract catering procurement, and increasingly B2B e-commerce for smaller buyers. End-of-life performance depends on local waste systems, including separate collection for bio-waste, access to industrial composting, and in some markets dedicated cup recycling schemes. Regulatory compliance workstreams, including alignment with PPWR timelines (application from 12 August 2026) and EN 13432 compostability requirements, add testing, certification, and documentation steps that tend to favor suppliers with established audit trails and the ability to provide traceability data to buyers under EPR and broader sustainability reporting requirements.
Competitive Landscape
Five suppliers captured around 45-50% of 2024 volumes, giving the Europe biodegradable cups market a moderately concentrated structure. Huhtamaki and Stora Enso utilize integrated fiber-to-cup operations, enabling them to hedge against pulp inflation and provide chain-of-custody documentation to multinational coffee clients. Huhtamaki commissioned a EUR 28 million (USD 30.8 million) molded-fiber line in Northern Ireland in March 2025, boosting capacity by 400 million units with AI-enabled defect detection that cuts scrap below 2%. Stora Enso has locked in a five-year PLA feedstock deal at prices 10% below the Q4 2024 spot, stabilizing offers to institutional buyers.
Specialists such as Vegware and Bio Futura monetize premium niches by stacking certifications—EN 13432, TÜV Austria OK Compost, and BPI —while offering custom printing that commands 8-12% price increases. Vegware hedged demand risk by partnering with Recup to supply compostable backup cups for reusable schemes in 6,000 German outlets. Digital-native distributors like Packhelp leverage online price transparency by bundling carbon-footprint calculators that resonate with small cafés under pressure from CSRD reporting.
Technology is increasingly differentiating players. Dart Container’s AI-optimized coating patent trims scrap and saves EUR 0.008 per cup, signaling a new efficiency race. Material innovators, such as Notpla, have rolled out seaweed-coated fiber cups that degrade in home compost, sidestepping infrastructure gaps in Southern Europe. Competitive intensity will remain acute as PLA cost deflation lowers entry barriers and online platforms ease market access for disruptive brands, yet incumbents retain volume defense through direct chain contracts and scale economies in certification audits.
Europe Biodegradable Cups Industry Leaders
Huhtamaki Oyj
Vegware Ltd.
Dart Container Corporation
Benders Paper Cups Ltd.
Genpak LLC
- *Disclaimer: Major Players sorted in no particular order
Europe Biodegradable Cups Market Companies Covered in this Report
- Huhtamaki Oyj
- Vegware Ltd.
- Dart Container Corporation
- Benders Paper Cups Ltd.
- Genpak LLC
- Pactiv LLC
- Seda International Packaging Group S.p.A.
- Stora Enso Oyj
- Eco-Products LLC
- International Paper Company
- Graphic Packaging Holding Company
- Fabri-Kal LLC
- Go-Pak Holdings Ltd.
- Bio Futura B.V.
- B-V-O International GmbH
- Scyphus Ltd.
- Colpac Ltd.
- Seda Group UK Ltd.
- World Centric Inc.
- NatureWorks LLC

Market Opportunities and Future Outlook
A key opportunity is in formats that reduce regulatory and operational friction by pairing performance with clearer end-of-life routing. Product roadmaps emphasizing water-based linings, bio-based barrier coatings, and reduced plastic content respond to tighter EU scrutiny of plastic-lined beverage cups under the Single-Use Plastics Directive, and to PPWR implementation from 12 August 2026, where compliance focuses more on demonstrable recyclability and controlled, application-specific compostability under EN 13432. This opens space for cup designs that can be compatible with existing paper cup recycling schemes where available, while still meeting compostability requirements in regions with established organic waste treatment.
Another opportunity is in institutional and multi-site procurement that standardizes specifications around recognized certifications and traceable material declarations to manage EPR exposure and reporting. Evidence of active supplier and portfolio moves supports this direction, including Vegware broadening certified cup ranges in 2026 and Huhtamaki launching barrier-coating innovations that lower plastic content. Infrastructure constraints remain a gating factor for pure compostability-led propositions, so supplier strategies that pair certified products with collection partnerships and clear labeling for local disposal routes offer a practical pathway to expand adoption across uneven European waste-management coverage.
Recent Industry Developments in Europe Biodegradable Cups Market
- May 2026: Vegware announced the Feel Snug cup range, adding bamboo-based double wall cups and PLA-lined paper cup options across multiple sizes. The launch targets hot-drink use cases where insulation and leak resistance are required while maintaining an industrial compostability positioning. Positioning the cups as compatible with coffee cup recycling schemes where available also addresses uneven composting access across European end markets.
- February 2026: Vegware expanded its Eco-Products efforts with a broader UK rollout that includes hot and cold cups and compostable items across additional distribution channels, indicating a scaling of sustainable cups in mainstream foodservice procurement. The expansion broadens access for buyers and aligns with ongoing competitive portfolio moves among leading packaging suppliers.
- July 2025: Huhtamaki launched compostable and recyclable ice cream cups using a bio-based barrier coating, with total plastic content reduced to less than 10%. This product development aligns with European pressure to cut plastic content and improve end-of-life outcomes without compromising barrier performance. It also signals continued R&D investment in coatings as a route to meet both functional requirements and evolving packaging compliance expectations.


Europe Biodegradable Cups Market Report Scope and Research Methodology
Market Definition and Coverage
For this study, the market is defined as revenue generated from selling biodegradable single-use cups used for food and beverage consumption across Europe, where the cup material is designed to break down under biological processes rather than persist like conventional plastics.
Scope exclusions: Reusable cups, non-biodegradable plastic cups, lids, straws, sleeves, and other foodservice packaging items are excluded from the market value.
Segments Covered in This Report
- By Material Type
- Bio-Plastics
- Polylactic Acid (PLA)
- Poly(Butylene Adipate-co-Terephthalate) (PBAT)
- Polybutylene Succinate (PBS)
- Polyhydroxyalkanoates (PHA)
- Other Bio-Plastics
- Paper
- Bagasse and Plant Fibre
- Bio-Plastics
- By Application
- Beverages
- Food
- By End User
- Food Service Outlets (Cafés and Hotels)
- Institutional (Malls and Commercial Establishments)
- Household
- By Distribution Channel
- Offline
- Online
- By Country
- United Kingdom
- Germany
- France
- Italy
- Spain
- Benelux
- Rest of Europe
Data Sources, Market Sizing, and Validation
Desk Research
Desk research was used to frame demand signals, regulatory context, and packaging material trends that influence cup conversions in Europe. We reviewed public policy and waste rules that affect single-use formats, and then linked these signals to foodservice activity and packaging consumption patterns.
Typical sources used include European Commission publications on packaging and single-use plastics, Eurostat indicators for population and consumption, and national environment agency guidance on compostability and waste sorting. We also referred to trade bodies and standards organizations, such as packaging associations and compostability standards, along with peer-reviewed papers on biopolymers and fiber-based packaging performance. In addition, company annual reports, investor presentations, and reputable press were used for directional signals on capacity additions and product mix, and a paid subscription for company financials and news was used selectively to cross-check reported revenue exposure. These examples are not exhaustive, and many other public sources were reviewed to validate and clarify data points.
Primary Interviews and Surveys
Primary work focused on validating what buyers in Europe specify as biodegradable and how those specifications translate into purchasing volumes across foodservice and institutional channels. We gathered input from cup manufacturers, packaging distributors, foodservice procurement teams, and waste management or compliance experts across major European markets, and then used these checks to adjust adoption assumptions and pricing ranges before finalizing totals.
Distribution of primary research fieldwork respondents
| Company type | Respondent position |
|---|---|
| Top tier: 34% | CXOs: 15% |
| Mid tier: 47% | Functional/Unit leaders: 28% |
| Smaller Players: 19% | Managers: 57% |
Market-Sizing & Forecasting
The core sizing starts with a top-down build where foodservice and institutional consumption signals, country-level population and out-of-home eating intensity, and the pace of single-use plastic restrictions are used to reconstruct the addressable demand pool for biodegradable cups. That demand pool is then translated into value using observed price bands and mix shifts between bio-plastics, paper, and plant fiber formats, with separate logic for offline versus online purchasing behavior.
To keep the model grounded, results were corroborated with selective bottom-up approximations, such as sampling supplier quotes, distributor channel checks, and a limited ASP-times-volume sanity check for priority countries. Inputs that mattered most included cup usage occasions in beverages versus food, substitution rates from conventional plastic to biodegradable alternatives, material pricing trends that influence bio-plastics versus fiber choices, and country-level composting or sorting readiness that affects what gets specified by buyers. For forecasting, scenario analysis was used so that adoption paths could be adjusted based on regulation timing, procurement preferences, and expected price movements, as confirmed by interview feedback. Where bottom-up visibility was thin for smaller countries, gaps were handled through proxying from similar markets using population, foodservice density, and observed packaging compliance patterns.
Data Validation & Update Cycle
We ran variance checks across countries and materials so that totals did not drift away from common-sense signals like foodservice activity and packaging substitution speed. Outliers, such as unusually high price points or sudden volume jumps, were re-checked against interview notes and public indicators, and assumptions were revised only when at least two independent signals aligned.
Before sign-off, the model and key assumptions go through multi-step analyst review so that arithmetic, logic flow, and unit consistency are confirmed. Reports are refreshed annually, and interim updates are triggered when a material regulatory change, a notable capacity move, or a clear price shift materially alters the outlook. Right before delivery, a final pass is completed so clients receive the most current view available at that time.
Mordor Intelligence's Europe Biodegradable Cups Market Estimate Compared With Other Published Estimates
Published market values for biodegradable cups in Europe can vary because the scope line is not always drawn the same way, and because pricing and adoption assumptions change quickly as regulations and material costs shift. Differences also show up when some estimates focus on a broader disposable cups demand, while others aim to isolate only certified biodegradable products.
The gap drivers usually come down to what counts as a biodegradable cup in practice, which countries are included in Europe, and how average selling prices are treated when product mix shifts from bio-plastics to paper or plant fiber. Some publishers also use a more aggressive or conservative base case on regulatory enforcement timing, and currency conversion timing can shift the reported USD value when local prices are used.
Benchmark comparison
| Source | Market Size | Gaps in Research Methodology |
|---|---|---|
| Mordor Intelligence | USD 276.89 M (2026) | |
| Industry Data Portal A | USD 2315.60 M (2025) | This figure appears to treat the market closer to a broad disposable cups pool and may include non-biodegradable paper cups and adjacent foodservice disposables, which inflates value versus a biodegradable-only definition. |
| Packaging Brief B | USD 1224.08 M (2022) | The estimate is reported for a wider compostable foodservice packaging category where cups are grouped with plates, and the year and product bundling make it hard to isolate cups only for a like for like comparison. |
The table shows a wide spread that mainly comes from category boundaries and the year used for the comparison, and in Mordor Intelligence's model, only biodegradable cups sold within the defined European country set are counted, without bundling plates or broader disposable cup demand. With that scope held steady, the total is traceable to a clear demand pool, practical price ranges, and country checks that can be repeated as new regulations or material costs shift.


Key Questions Answered in the Report
How large is the Europe biodegradable cups market in monetary terms?
The market generated USD 276.89 million in revenue during 2026 and is projected to reach USD 374.36 million by 2031.
What growth rate is forecast for biodegradable cups across Europe?
Market revenue is anticipated to expand at a 6.21% compound annual growth rate between 2026 and 2031.
Which material type is growing fastest?
Bio-plastic cups, mainly PLA-lined formats, are forecast to increase at 8.02% CAGR through 2031, the quickest among material categories.
Why is Spain the fastest-growing national market?
Regional single-use plastic bans that took effect in 2024 and a rebound in tourism drive Spain’s 7.98% CAGR outlook to 2031.
How are online distributors influencing procurement?
B2B e-commerce platforms now feature instant pricing and carbon-footprint data, enabling small cafés to order certified compostable cups with next-day delivery, which fuels a 7.28% CAGR for online channels.
What challenges limit wider adoption of biodegradable cups?
Premium prices over conventional cups and uneven industrial composting coverage restrict growth, particularly in Southern and Eastern Europe.
Page last updated on:


 Your data is secure and never sold or shared.


