Market Overview
| Study Period | 2020 - 2031 |
|---|---|
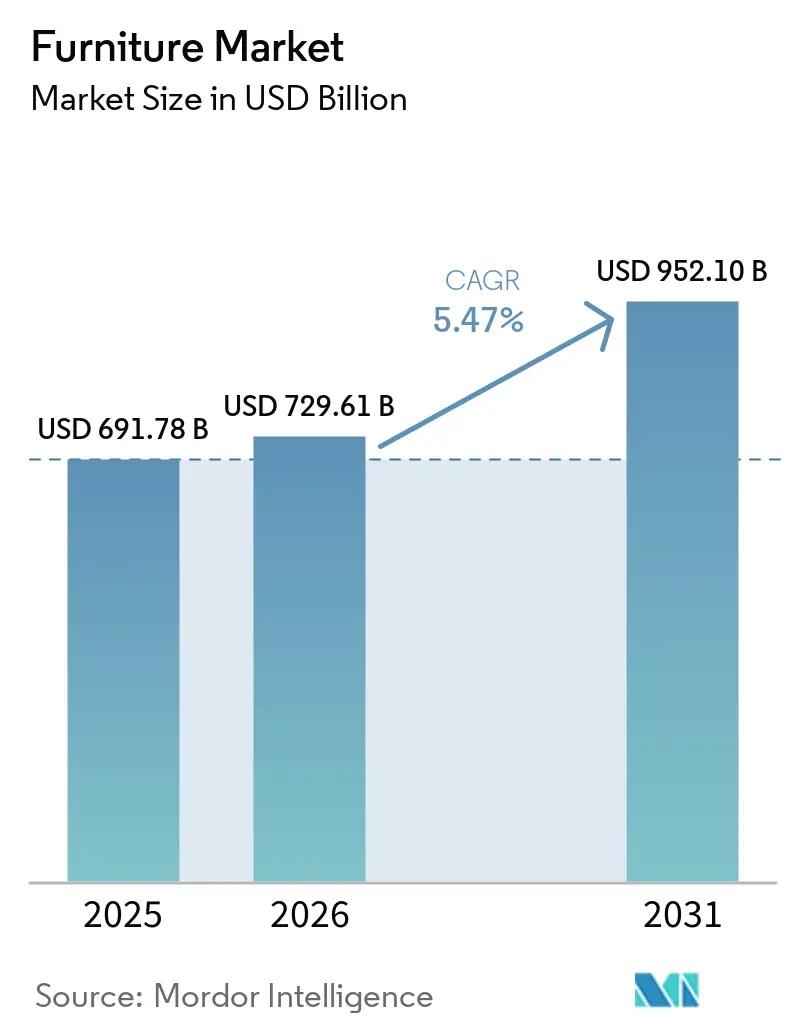
| Market Size (2026) | USD 729.61 Billion |
| Market Size (2031) | USD 952.10 Billion |
| Growth Rate (2026 - 2031) | 5.47% CAGR |
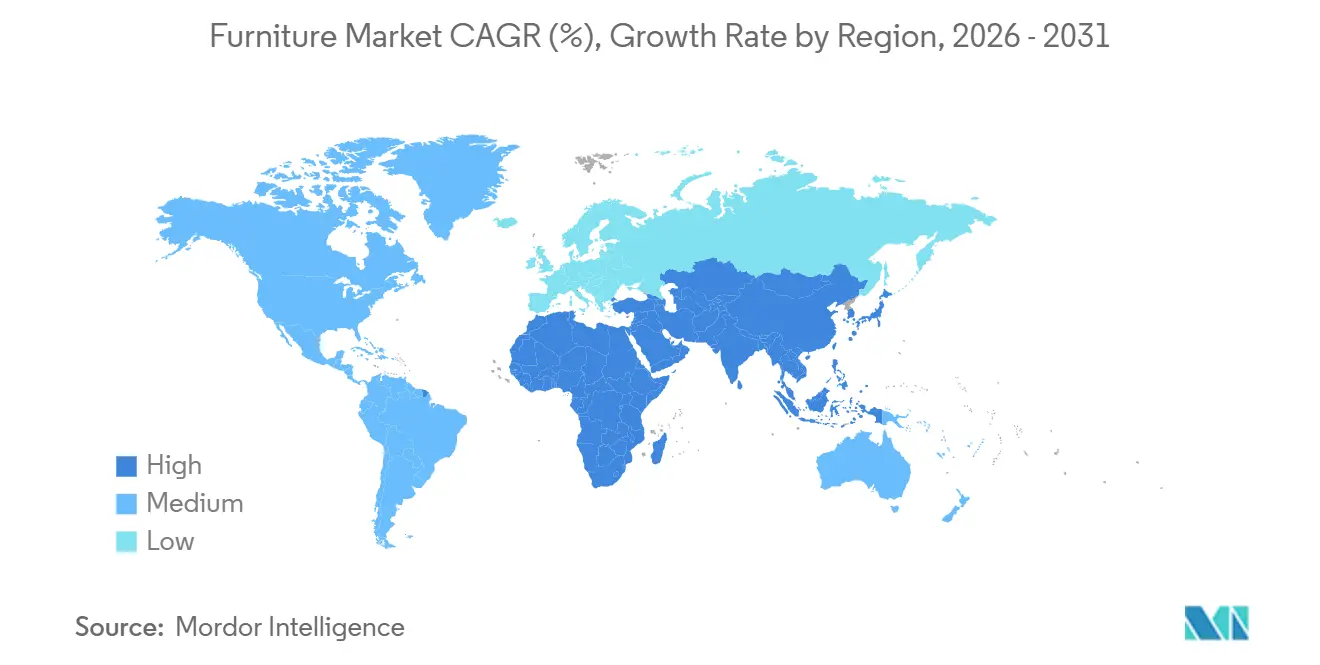
| Fastest Growing Market | Asia Pacific |
| Largest Market | Asia Pacific |
| Market Concentration | Low |
Major Players *Disclaimer: Major Players sorted in no particular order Image © Mordor Intelligence. Reuse requires attribution under CC BY 4.0. | |
Furniture Market Analysis by Mordor Intelligence
The furniture market size is expected to grow from USD 691.78 billion in 2025 to USD 729.61 billion in 2026 and is forecast to reach USD 952.10 billion by 2031 at a 5.47% CAGR over 2026–2031. Market expansion is underpinned by a combination of delayed but accelerating millennial homeownership, rapid urbanization in Asia-Pacific and Africa that is shrinking average living spaces, and the normalization of hybrid work models. These dynamics are driving sustained demand for flexible, space-efficient, and multifunctional furniture across residential and commercial segments. Wood remains the dominant material due to its cost efficiency, versatility, and broad consumer acceptance, particularly in residential applications. At the same time, metal furniture is gaining traction in commercial and institutional settings, supported by its recyclability, durability, and suitability for compact, ESG-aligned designs. This material shift is contributing to incremental value growth in offices, hospitality, and public infrastructure projects, especially in dense urban environments. Asia-Pacific represents the largest and fastest-growing regional market, supported by residential construction activity, urban household formation, and rising disposable incomes. Policy and trade are consequential for the furniture market, as the United States implemented Section 232 tariffs on upholstered wooden furniture and related wood products in October 2025, while China’s retail furniture sales posted strong monthly gains in late 2025 as domestic demand supported a rotation to replacement purchases. [1]Source: Donald J. Trump, “Adjusting Imports of Timber, Lumber, and Their Derivative Products into the United States,” The White House, whitehouse.gov.
Key Report Takeaways
- By application, home furniture led with 62.76% of the furniture market size in 2025, while office furniture is projected to expand at a 7.24% CAGR to 2031.
- By material, wood commanded 51.76% of the furniture market share in 2025, and metal is the fastest-growing material at a 7.63% CAGR through 2031.
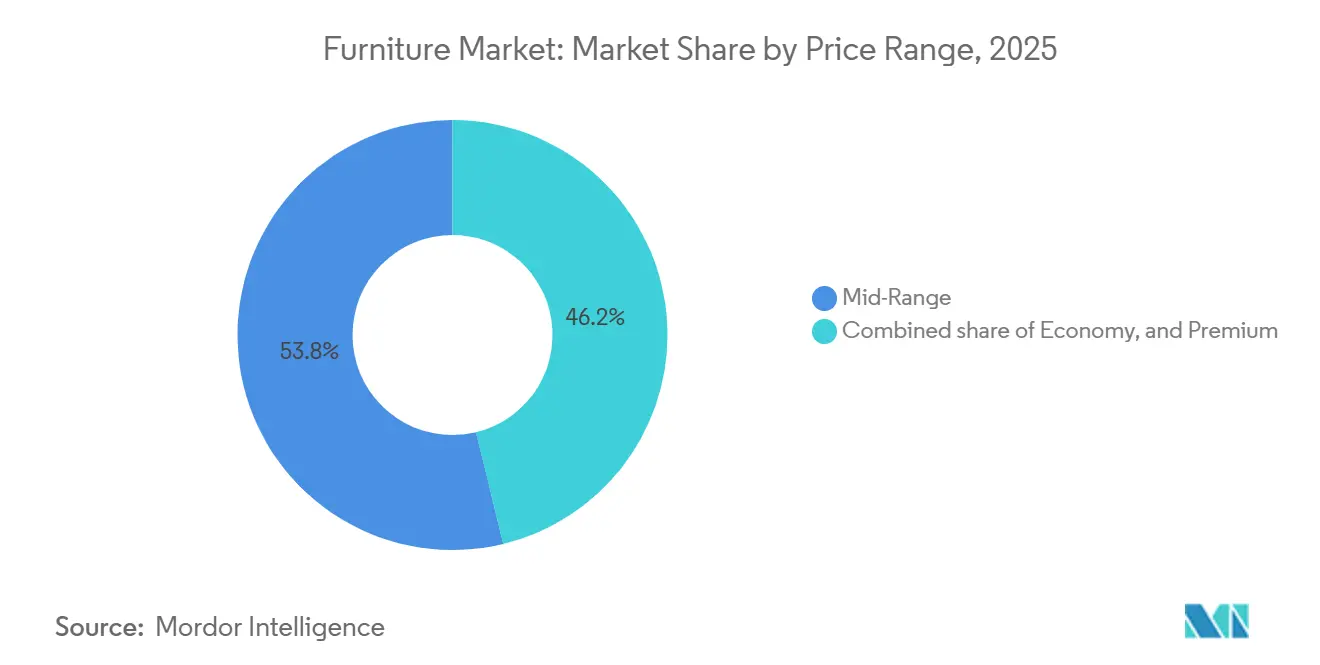
- By price range, mid-range captured 53.79% of the furniture industry share in 2025, and premium is projected to be the fastest at a 6.96% CAGR through 2031.
- By distribution channel, B2C retail held 79.49% of the furniture market share in 2025, and B2B/project is projected to grow at an 8.16% CAGR through 2031.
- By geography, the Asia-Pacific accounted for 47.76% of the furniture market share in 2025 and is forecast to lead at a 7.44% CAGR through 2031.
Note: Market size and forecast figures in this report are generated using Mordor Intelligence’s proprietary estimation framework, updated with the latest available data and insights as of January 2026.
Global Furniture Market Trends and Insights
Drivers Impact Analysis*
| Driver | (~) % Impact on CAGR Forecast | Geographic Relevance | Impact Timeline |
|---|---|---|---|
| Millennial Home Remodeling Driving Multi-Functional Furniture Demand | +1.8% | Global, with early gains in the United States, Canada, and Western Europe | Medium term (2-4 years) |
| Rapid Urbanization Boosting Space-Saving Modular Furniture Sales | +1.5% | Asia-Pacific core with spillover to the Middle East and Africa | Long term (≥ 4 years) |
| Expansion of Digital-First D2C Brands Increasing Online Furniture Penetration | +1.2% | North America and Europe, expanding to urban hubs in the Asia-Pacific | Short term (≤ 2 years) |
| Corporate ESG Mandates Encouraging Use of Recycled and Bio-Based Materials | +0.8% | Europe, North America, Japan | Medium term (2-4 years) |
| Remote and Hybrid Work Driving Home Office Furniture Demand | +1.4% | North America, Europe, and the Asia-Pacific urban centers | Short to medium term (≤ 4 years) |
| Rising Middle-Class Income Supporting Premium and Customized Furniture Purchases | +1.1% | Asia-Pacific, Latin America, Middle East | Medium to long term (≥ 3 years) |
| Source: Mordor Intelligence | |||
Millennial Home Remodeling Driving Multi-Functional Furniture Demand
Remodeling activity in 2026 supports the furniture market as project scopes widen beyond cosmetic updates into space planning and multi-room upgrades that favor modular pieces with ergonomic and storage features. Harvard’s Leading Indicator of Remodeling Activity projected United States home improvement spending at USD 509 billion for 2025, which signaled sustained demand entering 2026 as households prioritize productivity, well-being, and adaptable layouts that support hybrid routines. [2]Harvard Joint Center for Housing Studies, “Modest Gains in 2025 Outlook for Home Remodeling,” Harvard Joint Center for Housing Studies, jchs.harvard.edu. Contractor feedback points to larger projects and more structural reimagination across 2023–2025, a pattern that channels demand toward durable, multifunctional furniture that serves as a long-horizon replacement decision rather than a short-cycle refresh. Urban space constraints further concentrate purchases into modular sofas, wall-beds, nesting tables, and flexible storage as built-up area per capita in cities has grown faster than population over multi-decade windows, tightening usable space for many households. After remodeling, a majority of homeowners report stronger attachment to their homes, which extends replacement cycles and supports trade-up choices that emphasize comfort, repairability, and multi-function over purely price-driven options. These dynamics provide a steady tailwind in the furniture industry as brands with modular assortments and clear fit-for-space guidance win higher conversion in both digital and store channels.
Rapid Urbanization Boosting Space-Saving Modular Furniture Sales
Rapid urbanization is a key structural driver of space-saving and modular furniture demand, with more than 500 million additional people expected to move into cities between 2025 and 2050, primarily across Asia-Pacific and Africa. This influx is intensifying pressure on already limited urban living space, particularly in high-density rental housing and small residential units, shifting purchasing preferences toward compact, stackable, and wall-mounted furniture solutions. Constraints on average built-up area per urban resident are especially pronounced in parts of Sub-Saharan Africa, increasing the adoption of modular wardrobes, loft beds, and convertible seating that can serve work, caregiving, and social functions within a single footprint. [3]United Nations Department of Economic and Social Affairs, “World Urbanization Prospects 2025, Summary of Results,” UN DESA, population.un.org. India represents a major volume opportunity as government-led housing programs have accelerated the delivery of subsidized urban homes, channeling demand toward space-optimized furniture formats in dense cities. In China, rising replacement purchases in urban centers are supporting sales of furniture designed for smaller, more efficient layouts as households upgrade to modernized living spaces. Urban aging trends further reinforce this driver, as healthcare-oriented furnishings with accessible designs, durable materials, and easy-clean, antimicrobial finishes gain relevance in residential and community settings. Collectively, these factors position rapid urbanization as a sustained catalyst for modular, multifunctional furniture adoption across both retail and project channels.
Expansion of Digital-First D2C Brands Increasing Online Furniture Penetration
The furniture market continues to shift toward omnichannel models as digital-first direct-to-consumer brands expand their reach and established players redesign physical formats to improve conversion and last-mile efficiency. Leading platforms have refined their geographic exposure by concentrating investment in markets where logistics density supports faster delivery, lower fulfillment costs, and stronger unit economics. At the same time, large-format experiential stores are being repositioned as showrooms and localized fulfillment hubs, reinforcing online conversion for bulky, high-consideration furniture categories. This hybrid approach reflects a broader industry strategy that blends app-led merchandising with tactile, in-person experiences to reduce returns, limit transit damage, and increase attachment rates for complementary products. Capital deployment toward logistics infrastructure, supplier integration, and selective physical retail has further enabled this transition. As a result, digital-first D2C models are increasingly embedded in the furniture retail mainstream, driving sustained growth in online penetration while preserving the strategic role of stores in inspiration, customization, and post-purchase support.
Corporate ESG Mandates Encouraging Use of Recycled and Bio-Based Materials
Corporate sustainability requirements are increasingly influencing furniture procurement, driving demand for recycled content, low-emission finishes, and certified wood. Major players are setting ambitious material and health standards, such as MillerKnoll’s plan to eliminate PFAS from textiles, finishes, and materials in North America by 2025, demonstrating the coordination needed across large supplier networks. In Europe, regulations like the Ecodesign for Sustainable Products framework are introducing requirements for durability, repairability, recycled content, and Digital Product Passports, creating compliance incentives for exporters and advantages for suppliers with strong traceability systems. Large-scale integrators have moved early; for instance, IKEA reported 97% of FY24 wood as FSC-certified or recycled, which aligns with buyer-level ESG criteria in the contract and retail channels. [4]IKEA, The Wood We Use – Sustainability, IKEA Global, ikea.com. End-of-life regulations are also increasing pressure to design for disassembly, as most furniture waste currently bypasses recycling streams, encouraging manufacturers to adopt modular designs, repair-friendly fasteners, and verified sustainable inputs. Together, these ESG mandates are reshaping the market, pushing suppliers to invest in certification, lifecycle documentation, and enterprise-grade compliance to meet corporate procurement standards.
Restraints Impact Analysis*
| Restraint | (~) % Impact on CAGR Forecast | Geographic Relevance | Impact Timeline |
|---|---|---|---|
| EU Extended Producer Responsibility (EPR) Rules Increasing Compliance Costs for Exporters | -1.1% | Exporters serving the EU, with an indirect impact on Asian manufacturers | Medium term (2-4 years) |
| High Cross-Border Logistics Costs and Damage Risks Limiting E-Commerce Furniture Margins | -1.0% | Global, with an acute impact on Asia-Pacific-to-Americas and Asia-Pacific-to-Europe routes | Short term (≤ 2 years) |
| Volatility in Raw Material Prices Is Increasing Manufacturing Costs | -0.9% | Global, with pronounced effect in North America, Europe, and Asia-Pacific | Medium term (2–4 years) |
| Trade Tariffs and Import Duties Limit Cross-Border Market Access | -0.8% | Exporters to the United States, EU, and Middle East | Medium term (2–4 years) |
| Source: Mordor Intelligence | |||
EU Extended Producer Responsibility (EPR) Rules Increasing Compliance Costs for Exporters
The upcoming Ecodesign for Sustainable Products Regulation in the EU introduces a cradle-to-grave framework requiring durability, repairability, minimum recycled content, and Digital Product Passports for furniture sold in the region, starting in 2026. This regulatory shift is increasing entry costs for non-EU suppliers, who must implement traceability systems, testing protocols, and data reporting to meet compliance standards. As a result, a clear divide is emerging between certified, audit-ready vendors and non-compliant suppliers, with limited access to institutional buyers and major retail platforms for the latter. Exporters, particularly in Asia-Pacific, are adjusting product design and material declarations to meet EU rules, while early movers are leveraging these changes to gain advantages in other regions with similar sustainability requirements. Overall, compliance has become a critical capability in the global furniture market, elevating operational complexity and costs for suppliers seeking to maintain international market access.
High Cross-Border Logistics Costs and Damage Risks Limiting E-Commerce Furniture Margins
The furniture market continues to face high cross-border shipping costs and elevated damage risks, which put pressure on margins for bulky e-commerce items, particularly on transcontinental routes. Large players like Wayfair reported significant losses while investing heavily in store networks and logistics to reduce last-mile costs, minimize product damage, and improve conversion on high-value assortments. Trade measures, such as the United States Section 232 tariffs on imported upholstered wooden furniture, have added further cost layers, prompting brands to accelerate nearshoring and local manufacturing initiatives. Companies are expanding domestic production and distribution capacities to stabilize costs and shorten delivery times, but these investments require substantial capital and careful inventory management. Despite these measures, delivering large furniture profitably and efficiently remains a structural challenge, making capabilities in packaging, route optimization, and in-home assembly essential for maintaining margins.
*Our forecasts treat driver/restraint impacts as directional, not additive. The impact forecasts reflect baseline growth, mix effects, and variable interactions.
Segment Analysis
By Application: Hybrid Work Elevates Office Furniture from Recovery to Resurgence
In 2025, home furniture accounts for the largest share of the market, representing 62.76% as living room and bedroom replacements continue to drive steady demand. However, order trends are stabilizing after the earlier surge associated with extended home nesting. Office furniture is expected to register the fastest growth at a 7.24% CAGR from 2026 to 2031, fueled by hybrid work models that increase demand for ergonomic seating, adjustable desks, and collaborative workspace solutions. Flexible corporate occupancy policies support investments in high-spec products that enhance comfort, acoustic privacy, and employee well-being, helping reduce burnout. Hospitality and education sectors remain active, with hotels and schools prioritizing durable, low-maintenance furniture for high-traffic areas, while healthcare applications require a balance of clinical-grade durability and comfort, driving adoption of wipeable surfaces, antimicrobial fabrics, and mobility-friendly designs.
Lifecycle considerations differ across applications, influencing purchasing decisions and total cost of ownership. Residential furniture typically follows 7–10 year replacement cycles, whereas commercial and institutional products carry longer warranties and meet rigorous specification standards, reinforcing vendor incumbency through after-sales service and parts availability. ESG criteria also play a significant role, with buyers increasingly specifying low-emission materials, certified wood, and repair-friendly designs to meet regulatory and corporate sustainability requirements. Overall, the market remains volume-driven in residential segments while being performance- and compliance-driven in office, healthcare, and education, where durability, wellness, and regulatory alignment support premium positioning during the forecast period.


By Material: Metal Gains Ground as Circularity Trumps Aesthetics
Wood continues to dominate the furniture market, accounting for 51.76% share of the market size in 2025, but metal is emerging as the fastest-growing material with a projected 7.63% CAGR through 2031. Commercial buyers are increasingly prioritizing recyclability, durability, and long-term performance, shifting material selection toward metal frames and storage solutions that can withstand heavy use over extended periods. Wood faces challenges from input cost volatility, tighter sourcing regulations, and compliance requirements across multiple regions, reinforcing the appeal of metal for long-life applications. Plastic and polymer materials maintain relevance in outdoor and budget-sensitive segments, though regulatory expectations for recycled content and waste reduction are shaping formulations in major markets. Specialty materials like glass and leather continue to serve niche premium segments, particularly in hospitality and luxury residential settings where texture, aesthetics, and transparency add value. End-of-life considerations are increasingly influencing design, with reversible fasteners and modular components enabling easier refurbishment and recycling.
The furniture industry is also leaning into certification and traceability to address circularity concerns, as highlighted by IKEA reporting that 97% of its wood in FY24 was FSC-certified or recycled. Metal’s growing adoption in commercial spaces reflects lifecycle economics, where durability and lower replacement frequency support financial and operational decisions in offices, schools, and healthcare facilities. Policy trends, including the EU’s Digital Product Passport requirements, favor materials and designs that can be verified, documented, and audited, influencing vendor selection toward suppliers with robust compliance programs. Design teams are integrating repairability, serviceability, and modularity from the start, balancing aesthetics with functionality and regulatory demands. Across the market, decisions are increasingly guided by lifecycle performance, durability, and ESG alignment, rather than purely visual appeal. Together, these shifts reinforce a material landscape where metal’s performance advantages and wood’s certified sustainability credentials coexist to meet evolving market and policy expectations.
By Price Range: Premium Outpaces Economy as Consumers Trade Up or Trade Out
Mid-range furniture led the market size of price range segments in 2025, capturing 53.79% of revenues as broad catalogs, transparent pricing, and reliable availability kept shoppers engaged during fast purchase cycles. Premium furniture is expected to grow fastest, with a 6.96% CAGR through 2031, driven by trade-up behavior among urban professionals and commercial buyers who prioritize longevity, warranties, and certified materials for office and hospitality projects. Rising compliance costs and input variability are putting pressure on economy segments, prompting consumers to either stick with trusted mid-range brands or invest in premium pieces that offer longer service life. Premium collaborations continue to enhance brand equity, combining design-led catalogs with sustainability credentials and provenance details to appeal to discerning buyers. Lifecycle value, durability, and documentation are becoming key differentiators, with premium offerings standing out for features, service, and compliance support. These trends illustrate a market where price tiers increasingly reflect performance and long-term value rather than just upfront cost.
Omnichannel distribution is shaping how consumers engage with different price segments in 2026. Store experiences allow premium shoppers to evaluate comfort, finishes, and sizing firsthand, while digital tools such as configurators, AR visualization, and delivery scheduling streamline purchase decisions and reduce friction. Mid-range brands benefit from scale, logistics efficiency, and in-stock reliability, supporting both online and in-store merchandising where fast pickup is common in urban areas. Policy-driven input cost swings are managed through catalog optimization and specification upgrades, maintaining clear price-to-value positioning for both consumers and corporate buyers. The alignment of premium offerings with service, compliance, and lifecycle considerations reinforces their appeal in professional and residential settings. Overall, the market is evolving toward more sophisticated assortments that are modular, compliant, and documented, supporting growth across value and price tiers.
By Distribution Channel: Online Gains Share, But Physical Anchors Conversion
B2C retail continues to dominate the furniture market, accounting for 79.49% of market share in 2025, and remains central in 2026 as online and physical formats complement each other in discovery, configuration, and last-mile delivery. The market is increasingly omnichannel, with major players investing in smaller urban stores that serve as inspiration hubs and micro-fulfillment centers to accelerate delivery and reduce damage. Wayfair exemplifies this strategy by expanding large-format stores while scaling logistics and capital investments to support faster, higher-volume fulfillment. Specialty retailers are also integrating digital and store assets, using curated showrooms to enhance online conversion, improve product visualization, and increase average order value through assisted selling. These initiatives highlight the continued relevance of physical locations in driving discovery and supporting digital engagement. Overall, online penetration is growing, but store presence remains critical for conversion, customer experience, and service delivery.
B2B/project channels continue to hold a significant market size and are expected to grow at an 8.16% CAGR through 2031, particularly where space planning, compliance documentation, and installation services are essential. Retailers leverage store footprints as service centers for design consultations and pickup points, which reduce last-mile costs and improve satisfaction for bulky furniture deliveries. Omnichannel leaders are investing in fulfillment networks and strategic store openings in metro areas to enhance proximity to high-demand zones, enabling faster cycle times for both residential and project orders. Effective inventory management, margin protection under tariff scenarios, and streamlined delivery and assembly processes are key differentiators for vendors in 2026. This approach allows companies to balance cost, speed, and customer experience across channels. The result is a furniture market where online sales grow within a store-led ecosystem that stabilizes margins, enhances repeat purchase behavior, and strengthens overall channel performance.
Geography Analysis
Asia-Pacific dominates the global furniture market with a 47.76% share in 2025 and is projected to record the fastest growth at a 7.44% CAGR through 2031. India's growth in the region stands out, supported by compact-footprint housing programs and urban densification that favor modular and multifunctional furniture for both new and replacement cycles. China continues to drive replacement demand in urban apartments, with city-level upgrades and retail sales growth supporting compact and convertible furniture formats. Regulatory initiatives, such as low-emission furniture standards introduced in 2025, are shaping material and finish choices for suppliers in the region. Southeast Asia’s manufacturing base also remains critical, enabling brands to diversify sourcing while balancing labor and logistics costs.
North America is the second-largest regional market, anchored by the United States, where housing starts and remodeling activity provide a steady base for furniture demand. United States housing starts reached 1.50 million annualized units in early 2025, while remodeling activity, projected at USD 509 billion, supports upgrades and home office improvements. Canada contributes through hybrid work upgrades and residential replacement cycles, and Mexico records the fastest regional growth, driven by nearshoring and expanded manufacturing capacity for United States-bound exports. Leading omnichannel retailers and pure-play e-commerce platforms continue to align store footprints with digital assets to optimize delivery speed and conversion on larger orders. Across the region, demand is increasingly influenced by ergonomic upgrades, faster fulfillment, and certified materials that meet ESG criteria.
Europe remains a significant market, with regulatory frameworks shaping product design, documentation, and end-of-life planning. The EU Ecodesign for Sustainable Products Regulation, including Digital Product Passports, is increasing compliance requirements and influencing furniture assortments toward repairability and recyclability. European-rooted global brands are investing in automation and network expansion to maintain cost efficiency and faster delivery. In the Middle East and Africa, growth is driven by Saudi Arabia’s Vision 2030 housing and hospitality projects, while African urbanization creates a two-tier market of formal high-growth metros and informal budget segments. Across these regions, energy costs, logistics reliability, and policy developments continue to shape material selection, pricing, and distribution strategies in 2026.

Competitive Landscape
The global furniture market remains highly fragmented, but consolidation is reshaping specific segments where scale and regulatory compliance offer competitive advantages. In December 2025, HNI Corporation acquired Steelcase, creating North America’s largest office-focused platform by revenue and enhancing coverage across enterprise and mid-market accounts through complementary dealer networks. IKEA continues to lead globally through vertical integration and automation, maintaining cost efficiency and product traceability, with 97% of its FY24 wood FSC-certified or recycled. Wayfair’s 2026 strategy highlights the market’s omnichannel shift, combining store expansions, logistics investments, and balance-sheet measures to maintain service levels on bulky products nationwide. [5]Wayfair Inc., “Wayfair’s Physical Retail Expansion Continues, New Atlanta Store Coming in 2026,” Wayfair Investor Relations, investor.wayfair.com. MillerKnoll’s PFAS elimination drive shows how compliance is now a differentiator with corporate buyers, particularly in office and healthcare settings that prize verified low-emission materials. Together, these moves deepen the moat for scale players with robust compliance, logistics, and product development capabilities.
Several white-space opportunities are emerging in 2026, particularly in connected and sensor-enabled furniture, circular and refurbishment programs, and hospitality project demand. Connected products, especially in healthcare, are moving from pilot stages to scaled deployment, enabling new service models linked to monitoring, maintenance, and outcomes. Circular programs, including trade-in, buy-back, and certified resale, are helping brands extend customer relationships and diversify revenue beyond initial sales. Hospitality furniture is benefiting from infrastructure investments and high-traffic project demand, which favors durable, serviceable products. Multi-country manufacturing footprints in Asia-Pacific and Europe allow brands to balance logistics, manage policy shifts, and meet demand cycles efficiently.
In 2026, competitive moves emphasize compliance, portfolio discipline, and operational efficiency to protect margins and meet buyer requirements. Several contract-focused suppliers are pruning catalogs and simplifying SKUs to streamline manufacturing and focus on high-velocity hero products. Lifestyle-focused retailers are expanding through acquisitions of small-space and youth-oriented labels, using store and digital data to personalize customer journeys. Capital investments target facilities and logistics networks to enable faster delivery and pickup in dense urban markets, while also supporting job creation and export capacity. With regulation, tariffs, and ESG priorities embedded in the market, suppliers that demonstrate verified inputs, reliable fulfillment, and durable designs are best positioned to capture growth and maintain competitive advantage.
Furniture Industry Leaders
Ashley Furniture Industries, Inc.
Steelcase Inc.
IKEA
MillerKnoll, Inc.
Williams-Sonoma Inc.
- *Disclaimer: Major Players sorted in no particular order

Recent Industry Developments
- December 2025: HNI Corporation acquired Steelcase for USD 2.2 billion, creating the world’s largest office furniture manufacturer with over USD 5.8 billion in revenue. The deal consolidates 16.48% of North American office specifications, integrates complementary dealer networks, and targets cost synergies of USD 120 million by year three.
- August 2025: Nitori Holdings opened its fifth Indonesian outlet, advancing its goal of 3,000 global stores by 2032 as part of its Asia-Pacific expansion strategy. The Japan-based furniture and home-goods retailer targets Southeast Asian middle-class consumers with its value-for-money positioning, leveraging vertical integration from manufacturing to retail to undercut local competitors on comparable SKUs.
- May 2025: Williams-Sonoma Inc. acquired the intellectual property of Dormify, an online retailer specializing in college dorm and small-space furnishing solutions, with plans to relaunch the brand in 2026. The acquisition supports a lifecycle strategy that shifts young customers across banners as they age and establish households.


Research Methodology Framework and Report Scope
Market Definitions and Key Coverage
Our study defines the global furniture market as the value of new household, office, hospitality, and institutional furniture sold by manufacturers and branded assemblers to first-time buyers, measured at ex-factory prices and converted to constant 2025 US dollars for cross-country comparability. According to Mordor Intelligence, services such as installation and after-sales maintenance are captured only where they are bundled with the product price.
Scope Exclusion: Repurposed or second-hand furniture, in-built fixtures, and purely decorative accessories are outside the study.
Segmentation Overview
- By Application
- Home Furniture
- Chairs
- Tables (side tables, coffee tables, dressing tables, etc.)
- Beds
- Wardrobes
- Sofas
- Dining Tables/Dining Sets
- Kitchen Cabinets
- Other Home Furniture (bathroom furniture, outdoor furniture, etc.)
- Office Furniture
- Chairs
- Tables
- Storage Cabinets
- Desks
- Sofas and Other Soft Seating
- Other Office Furniture
- Hospitality Furniture
- Educational Furniture
- Healthcare Furniture
- Other Applications (public places, retail malls, government offices, etc.)
- Home Furniture
- By Material
- Wood
- Metal
- Plastic & Polymer
- Other Materials
- By Price Range
- Economy
- Mid-Range
- Premium
- By Distribution Channel
- B2C/Retail
- Home Centers
- Specialty Furniture Stores
- Online
- Other Distribution Channels
- B2B /Project
- B2C/Retail
- By Geography
- North America
- Canada
- United States
- Mexico
- South America
- Brazil
- Peru
- Chile
- Argentina
- Rest of South America
- Europe
- United Kingdom
- Germany
- France
- Spain
- Italy
- BENELUX (Belgium, Netherlands, and Luxembourg)
- Sweden
- NORDICS (Denmark, Finland, Iceland, Norway, and Sweden)
- Rest of Europe
- Aisa Pacific
- India
- China
- Japan
- Australia
- South Korea
- South East Asia (Singapore, Malaysia, Thailand, Indonesia, Vietnam, and Philippines)
- Rest of Asia-Pacific
- Middle East And Africa
- United Arab of Emirates
- Saudi Arabia
- South Africa
- Nigeria
- Rest of Middle East And Africa
- North America
Detailed Research Methodology and Data Validation
Primary Research
We interviewed procurement heads at contract manufacturers, product managers from mass-market and premium retailers, logistics partners, and interior designers across Asia-Pacific, North America, Europe, and the Gulf. These conversations let us validate price corridors, substitution trends between wood and engineered panels, and the speed at which online channels capture first-time buyers.
Desk Research
We begin by mapping the demand pool through publicly available datasets; we analyze trade flows from UN Comtrade, production volumes from China's National Bureau of Statistics, retail sales tables from the US Census Bureau, Eurostat's construction permits, and household expenditure series in the World Bank's ICP. Trade associations, such as the European Furniture Industries Confederation and the American Home Furnishings Alliance, supply pattern data on material mix and channel shifts.
To profile suppliers and cost structures, we reference D&B Hoovers company filings, Dow Jones Factiva news archives, and patent counts from Questel that flag emerging smart-furniture designs. Press releases, dealer price lists, and customs rulings help us benchmark average selling prices. The sources cited here are illustrative; many additional publications informed data collection, cross-checks, and clarification.
Market-Sizing & Forecasting
A top-down model converts national furniture consumption and trade balances into a global revenue baseline, which is then sense-checked with bottom-up supplier roll-ups for high-volume categories. Key variables include new housing starts, commercial office capex, disposable household income per capita, hardwood and engineered-wood price indices, and online retail penetration, each forecast with multivariate regression fitted on ten years of history. Where bottom-up gaps appear, such as limited disclosure in privately held Asian firms, we interpolate using sampled ASP × unit volumes from customs shipments and retailer scans.
Data Validation & Update Cycle
We run variance checks against historical series, peer ratios, and event news, and any anomaly triggers a second analyst review before sign-off. Models refresh every twelve months, with interim tweaks if material events, such as tariffs, pandemics, or raw-material shocks, shift underlying assumptions. A fresh audit precedes each client delivery so users receive our latest view.
Why Mordor's Furniture Baseline Stands Up to Scrutiny
Published estimates rarely align; scope choices, pricing conventions, and refresh cadences differ. We clarify these drivers up front so decision-makers understand why numbers move.
Key gap drivers in rival outputs include inclusion of specialty décor items, exclusion of contract segments, aggressive post-pandemic rebound scenarios, or conservative price-escalation paths, all of which nudge totals away from our balanced midpoint.
Benchmark comparison
| Market Size | Anonymized source | Primary gap driver |
|---|---|---|
| USD 691.87 B (2025) | Mordor Intelligence | |
| USD 786.13 B (2025) | Global Consultancy A | Wider material scope and optimistic demand rebound assumption |
| USD 597.71 B (2025) | Industry Publisher B | Omits contract and institutional sales and applies flat ASP progression |
Taken together, the comparison shows that our disciplined scope, transparent variable set, and annual refresh cadence give clients a dependable middle ground they can trace back to clear, reproducible steps.


Key Questions Answered in the Report
What is the 2026 valuation and 2031 outlook for the global furniture market, and what CAGR does this imply?
The global furniture market is valued at USD 729.61 billion in 2026 and is forecast to reach USD 952.10 billion by 2031, which implies a 5.47% CAGR over the period.
Which regions will contribute the most incremental demand through 2031?
Asia-Pacific leads with 47.76% share in 2025 and the fastest trajectory to 2031, with India advancing at 11.33% and China supporting replacement-led purchases in dense urban centers.
Which applications are expanding fastest in 2026, and why is that happening?
Which applications are expanding fastest from 2026 to 2031, and why is that happening?
What channel strategy best converts high-ticket purchases in 2026?
Omnichannel wins, as large-format showrooms and smaller urban stores drive configuration, reduce returns, and function as micro-fulfillment nodes that compress delivery windows for online-originated orders.
How will EU ESPR rules and United States Section 232 duties change sourcing and costs from 2026 onward?
EU ESPR brings durability, repairability, recycled content, and Digital Product Passports into scope, while United States Section 232 duties add cost layers to import-reliant supply, which together accelerate nearshoring and compliance investments.
Which material choices align with ESG procurement and lifecycle economics?
Metal gains specification share for recyclability and durability, certified wood is preferred where traceability is verified, and repair-friendly modular designs support end-of-life goals without sacrificing performance.
Page last updated on:


