
Fundus Camera Market Size and Share
Market Overview
| Study Period | 2020 - 2031 |
|---|---|
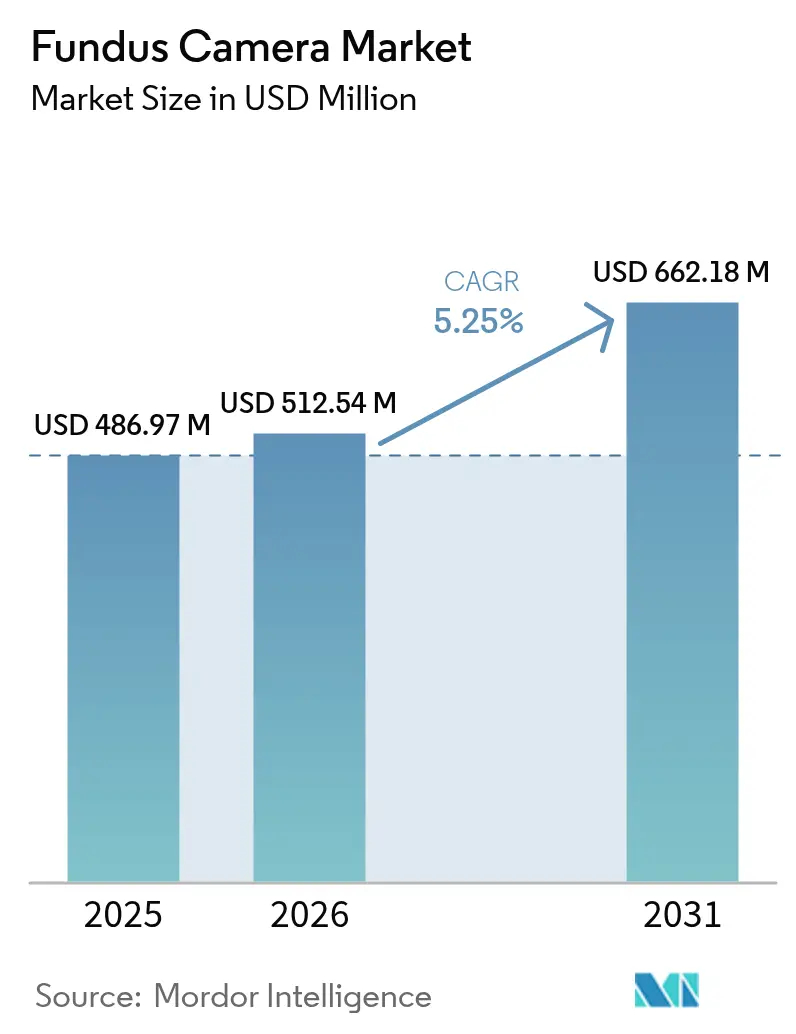
| Market Size (2026) | USD 512.54 Million |
| Market Size (2031) | USD 662.18 Million |
| Growth Rate (2026 - 2031) | 5.25 % |
| Fastest Growing Market | Asia Pacific |
| Largest Market | North America |
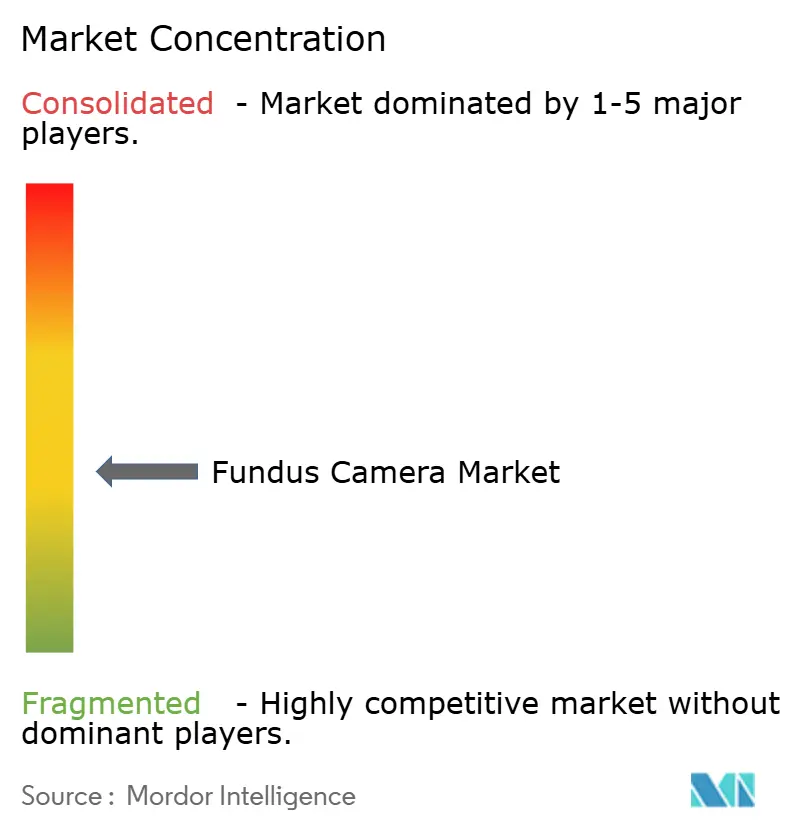
| Market Concentration | Medium |
Major Players *Disclaimer: Major Players sorted in no particular order Image © Mordor Intelligence. Reuse requires attribution under CC BY 4.0. | |
Fundus Camera Market Analysis by Mordor Intelligence
Fundus Camera Market size in 2026 is estimated at USD 512.54 million, growing from 2025 value of USD 486.97 million with 2031 projections showing USD 662.18 million, growing at 5.25% CAGR over 2026-2031.
Demand strengthens as artificial-intelligence algorithms move from pilot to routine use, with FDA-cleared platforms such as IDx-DR and EyeArt showing more than 96% sensitivity for diabetic-retinopathy detection. Mandatory screening programs, improved reimbursement for tele-ophthalmology, and CMS guidance that recognizes AI-interpreted fundus photography as medically necessary are expanding adoption. Product preferences continue to favor non-mydriatic systems that integrate smoothly with electronic health records, yet hybrid and ultra-widefield devices are growing fastest because they capture up to 200 degrees of retinal surface. Portable hand-held cameras dominate modality demand, while combination platforms that fuse OCT and fundus photography gain momentum for comprehensive retinal assessment. Regionally, North America leads on market share, but Asia-Pacific posts the highest growth as diabetes prevalence rises and governments invest in community eye-care delivery.
Key Report Takeaways
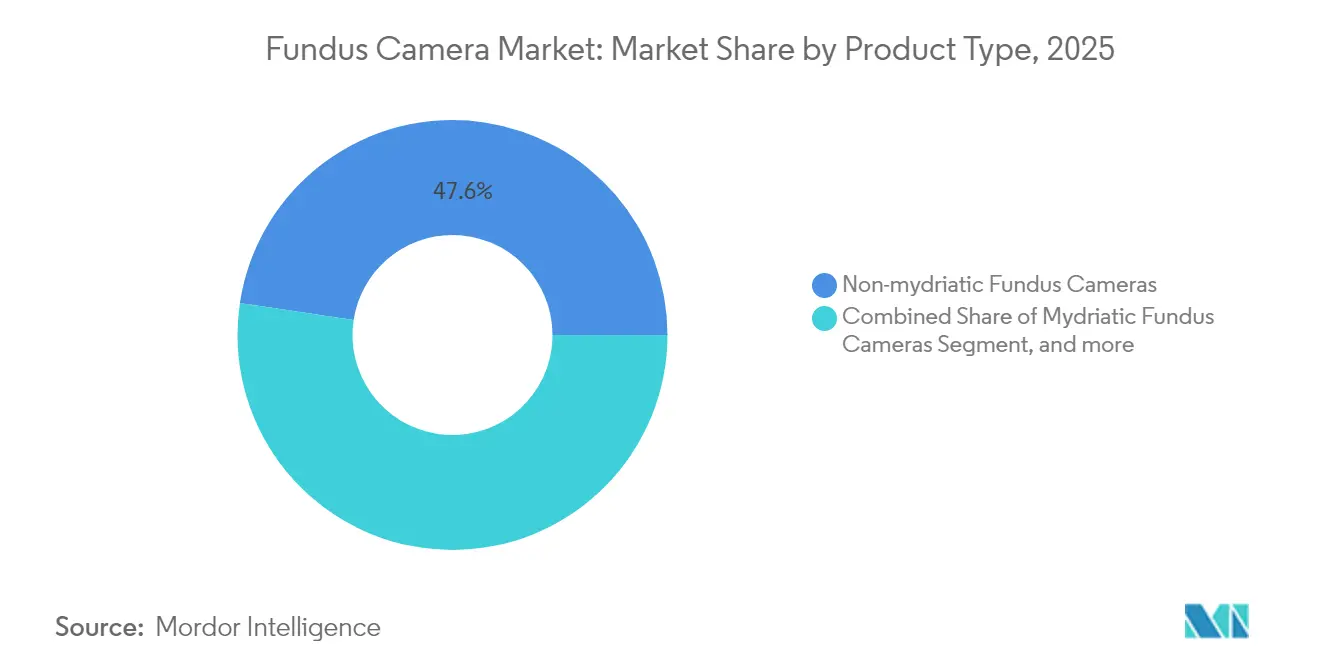
- By product type, non-mydriatic systems held 47.62% of fundus camera market share in 2025, whereas hybrid and wide-field cameras are projected to grow at a 6.32% CAGR to 2031.
- By modality, hand-held devices accounted for 53.10% share of the fundus camera market size in 2025; combination imaging platforms are advancing at a 7.02% CAGR through 2031.
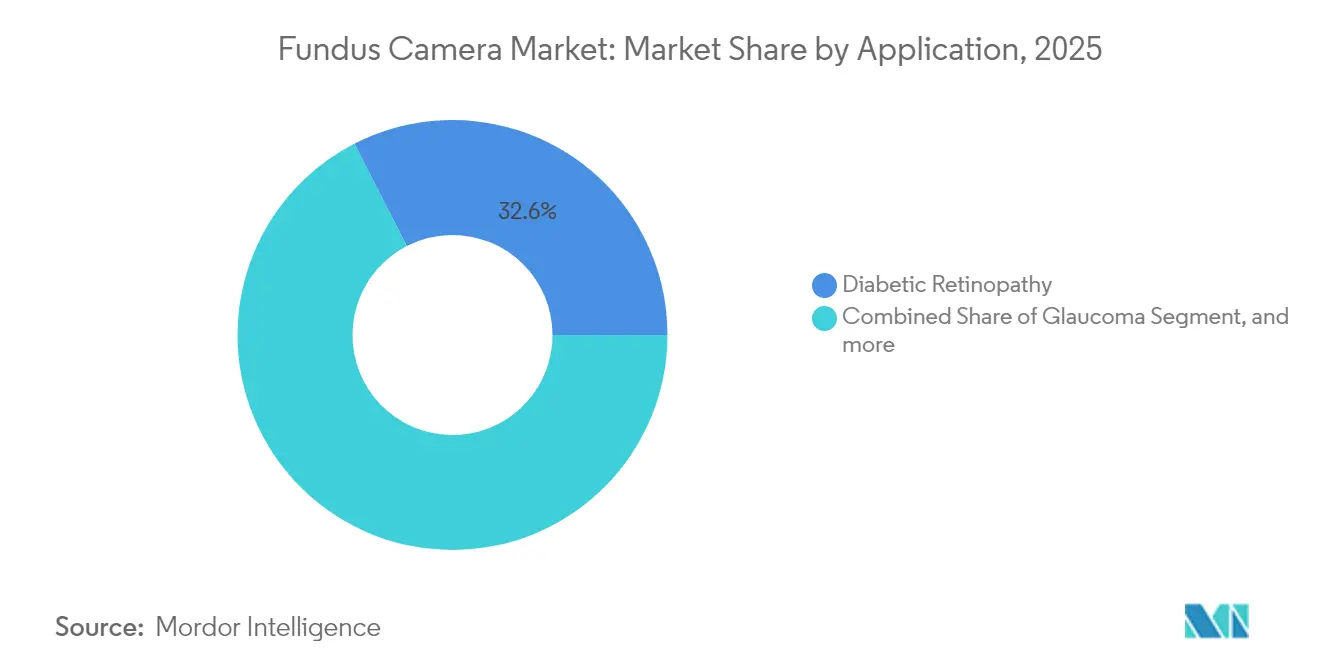
- By application, diabetic-retinopathy screening led with 32.55% revenue share in 2025, while age-related macular degeneration applications are forecast to expand at an 8.28% CAGR to 2031.
- By end user, hospitals captured 52.10% share of the fundus camera market in 2025, whereas specialty clinics are set to grow at a 8.88% CAGR up to 2031.
- By geography, North America dominated with a 41.20% share in 2025, yet Asia-Pacific shows the fastest 6.55% CAGR through 2031.
Note: Market size and forecast figures in this report are generated using Mordor Intelligence’s proprietary estimation framework, updated with the latest available data and insights as of 2026.
Market Trends and Insights
Drivers Impact Analysis of Fundus Camera Market*
| Driver | (~) % Impact on CAGR Forecast | Geographic Relevance | Impact Timeline |
|---|---|---|---|
| Accelerating Diabetic-Retinopathy Screening Mandates | +1.2% | Global, with early gains in North America, EU | Medium term (2-4 years) |
| Rapid Adoption of AI-Embedded Imaging Workflows | +1.8% | North America & EU, spill-over to APAC core | Short term (≤ 2 years) |
| Prevalence Spike of Age-Related Macular Degeneration | +0.9% | Global, concentrated in aging populations | Long term (≥ 4 years) |
| Tele-Ophthalmology Reimbursement Parity | +1.1% | North America, expanding to EU and APAC | Medium term (2-4 years) |
| Smartphone-Based Neonatal ROP Screening Roll-Outs | +0.7% | APAC core, emerging in MEA and Latin America | Medium term (2-4 years) |
| ESG-Linked Procurement Favouring Low-Energy Handhelds | +0.4% | EU leading, North America following | Long term (≥ 4 years) |
| Source: Mordor Intelligence | |||
Accelerating Diabetic-Retinopathy Screening Mandates
Many countries now require annual retinal exams for people with diabetes, and U.S. Medicare policies deem AI-interpreted fundus images medically necessary. These rules spur bulk purchases of cameras that produce AI-ready images and support telemedicine workflows. More than 4.1 million U.S. adults live with diabetic retinopathy, and systematic screening using fundus cameras prevents avoidable vision loss while lowering long-term care costs.[1]Medicare Coverage Database, Centers for Medicare & Medicaid Services, cms.gov
Rapid Adoption of AI-Embedded Imaging Workflows
FDA-cleared AI platforms such as IDx-DR deliver ≥ 96% sensitivity and ≥ 93% specificity, producing results within three minutes of capture. Optos, Nikon and Google have co-developed ultra-widefield AI tools that detect macular edema alongside retinopathy.[2]Optos AI-Based Ultra-Widefield Imaging, Optos, optos.com Clinicians value the speed, consistency and reduced dependence on specialist readers, making AI-enabled cameras an essential element of expanded screening programs.
Prevalence Spike of Age-Related Macular Degeneration
AMD rates are climbing as populations age. Ultra-widefield imaging and AI algorithms detect drusen and pigment changes earlier than standard methods, enabling timely therapies that preserve vision.[3]Global Burden of Disease Study 2024, Nature, nature.com Manufacturers are embedding AMD-specific analytics into camera software, positioning the technology for broader preventive use.
Tele-Ophthalmology Reimbursement Parity
U.S. payers such as Aetna reimburse fundus photography delivered via telehealth under dedicated CPT codes, treating it as equal to in-office exams. Similar policies are advancing in the EU and parts of APAC. Parity removes financial barriers, especially for rural programs that rely on portable cameras linked to cloud readers.
Restraints Impact Analysis of Fundus Camera Market*
| Restraint | (~) % Impact on CAGR Forecast | Geographic Relevance | Impact Timeline |
|---|---|---|---|
| High Capex Versus OCT-Combo Systems | -0.8% | Global, particularly affecting smaller practices | Medium term (2-4 years) |
| Shortage of Trained Ophthalmic Technicians in LMICs | -0.6% | APAC, MEA, Latin America rural regions | Long term (≥ 4 years) |
| Data-Privacy Hurdles for Cloud-Based Retinal Archives | -0.4% | EU leading due to GDPR, expanding globally | Short term (≤ 2 years) |
| Import-Tariff Volatility on Optical Components | -0.5% | Global, with highest impact in North America | Medium term (2-4 years) |
| Source: Mordor Intelligence | |||
High Capex Versus OCT-Combo Systems
Combination imaging platforms command premium pricing due to their sophisticated technology integration, with systems often exceeding USD 100,000 compared to standalone fundus cameras priced below USD 50,000. This cost differential becomes particularly challenging for specialty eye clinics and ambulatory surgical centers operating under tight budget constraints while seeking to offer comprehensive diagnostic capabilities. The economic pressure intensifies when considering ongoing maintenance costs, software licensing fees, and staff training requirements associated with complex imaging systems.
Shortage of Trained Ophthalmic Technicians in LMICs
Many rural centers lack staff who can capture high-quality images or maintain equipment. Training gaps lead to underused cameras and inconsistent screening outcomes. Training infrastructure remains underdeveloped in many regions, with limited access to certification programs and continuing education opportunities for ophthalmic technicians. This human resource constraint often renders sophisticated fundus cameras underutilized or improperly operated, reducing their clinical effectiveness and return on investment.
*Our forecasts treat driver/restraint impacts as directional, not additive. The impact forecasts reflect baseline growth, mix effects, and variable interactions.
Fundus Camera Market Segment Analysis
By Product Type:
Non-Mydriatic Systems Drive Workflow EfficiencyNon-mydriatic systems secured 47.62% share of the fundus camera market in 2025 thanks to painless, drop-free imaging that accelerates patient throughput. Their seamless EHR integration enables instant upload for AI review, supporting large screening programs. Zeiss’s CIRRUS 6000 adds network-grade cybersecurity and the largest OCT reference database in the United States. Hybrid and wide-field devices are slated to expand at a 6.32% CAGR, capturing up to 200 degrees of retina in a single shot and doubling lesion detection rates.
Demand for ultra-widefield cameras grows in diabetic and peripheral-retinal disease management. Mydriatic cameras remain essential when maximum image clarity or research-grade color depth is required. Pediatric-specific cameras fill niche needs with tailored optics. The product palette thus enables providers to match imaging depth with clinical complexity while balancing capital budgets.



By Modality:
Portable Solutions Transform Access ParadigmsHand-held devices held 53.10% of the fundus camera market share in 2025 as portability opened doors to rural clinics, emergency rooms and drive-through screenings. Smartphone-coupled models achieve comparable accuracy with lower acquisition cost. Combination platforms that merge OCT and fundus imaging will grow at a 7.02% CAGR, responding to clinics that want comprehensive data in one sitting.
Stationary table-top cameras remain common in high-volume centers that prioritize image consistency over mobility. Portable OCT units such as SightSync extend point-of-care diagnostics to community programs. User-friendly designs reduce technician training needs, supporting wider deployment across general-practice offices.
By Application:
Diabetic-Retinopathy Screening Anchors Market GrowthDiabetic-retinopathy screening generated 32.55% of 2025 revenue and maintains momentum as guidelines prescribe annual exams and AI tools verify lesions with ≥ 96% sensitivity. Age-related macular degeneration imaging is the fastest-growing application at an 8.28% CAGR, propelled by earlier diagnosis through drusen-detection algorithms. Glaucoma screening benefits from optic-nerve analytics with 93.26% sensitivity, while retinopathy of prematurity programs rely on pediatric optics.
Retinopathy of prematurity screening utilizes specialized pediatric fundus cameras and smartphone-based systems to address critical gaps in neonatal eye care, particularly in low- and middle-income countries where ROP incidence can exceed 40% among screened infants.
By End User:
Specialty Clinics Accelerate Adoption RatesHospitals commanded 52.10% of fundus camera market size in 2025, pairing high patient throughput with capital budgets for multimodal platforms. Specialty eye clinics are set to grow at 8.88% CAGR as they deploy AI-driven models that streamline routine screening and free ophthalmologists for complex cases. Ambulatory surgery centers add imaging to pre- and post-operative workflows, capturing ancillary revenue.
Tele-ophthalmology programs use hand-held cameras in community vans, pharmacies and primary-care offices. Automated image-grading software lowers reliance on scarce retinal specialists, supporting economic sustainability for remote services.
Geography Analysis
North America Fundus Camera Market
North America maintains market leadership with 41.20% share in 2025, supported by robust healthcare infrastructure, favorable reimbursement policies, and early adoption of AI-enabled diagnostic systems. The region benefits from comprehensive diabetic retinopathy screening programs and established telemedicine frameworks that facilitate fundus camera integration across diverse clinical settings. Major healthcare systems invest in advanced combination platforms that provide multimodal imaging capabilities, while rural areas increasingly adopt portable solutions to address geographic access barriers.
APAC and Europe Fundus Camera Market
Asia-Pacific demonstrates the highest growth trajectory at 6.55% CAGR through 2031, driven by expanding healthcare access initiatives, rising diabetes prevalence, and government-backed screening programs across China, India, and Southeast Asian countries. The region's growth reflects substantial investments in healthcare infrastructure and increasing recognition of preventive eye care's economic benefits. Rural community-based eye care models emphasize portable fundus cameras and smartphone-based imaging solutions to overcome geographic and economic barriers that traditionally limited specialist access. Europe maintains steady growth supported by ESG-driven procurement policies that favor energy-efficient handheld devices and comprehensive regulatory frameworks that ensure device quality and safety standards.


Competitive Landscape
The fundus camera industry is moderately fragmented. Canon, Carl Zeiss Meditec and Topcon leverage optical heritage and global sales channels. Consolidation is advancing: EssilorLuxottica bought 80% of Heidelberg Engineering in 2024 to integrate imaging with spectacle-lens sales.
Technology partnerships drive differentiation. Optos, Nikon and Google co-created an AI algorithm that flags diabetic macular edema on ultra-widefield images at 96% sensitivity. Start-ups target new domains such as cardiovascular screening; Heart Eye Diagnostics positions its Dr.Noon CVD camera for cardiology and primary care. Success now hinges on delivering integrated hardware-software ecosystems that raise diagnostic accuracy while reducing exam time.
Fundus Camera Industry Leaders
NIDEK Co., Ltd.
Epipole Ltd.
Canon Inc.
Carl Zeiss Meditec AG
Topcon Healthcare
- *Disclaimer: Major Players sorted in no particular order
Fundus Camera Market Companies Covered in this Report
- Canon
- Carl Zeiss
- Topcon Healthcare
- Nidek
- Kowa
- Optos
- Revenio Group
- Heidelberg Engineering
- Optomed Oy
- Visionix
- Epipole
- Phelcom Technologies
- Forus Health Pvt Ltd.
- Visunex Medical Systems
- Clarity Medical Systems
- Phoenix Technology Group
- HEINE Optotechnik
- Nikon Corp.
- Beye
- EssilorLuxottica

Market Opportunities and Future Outlook
White-space is widening around AI-ready, cloud-connected screening workflows that extend fundus imaging beyond ophthalmology into primary care, pharmacies, and mobile programs. In these settings, non-mydriatic handheld cameras and automated image-quality checks can reduce dependence on trained technicians. Recent vendor moves reflect this direction: Optomed introduced the Optomed Lumo handheld fundus camera (June 2025) for programmable workflows in non-specialist settings, and identifeye HEALTH launched a compact retinal screening platform (September 2025) that pairs a portable camera with a cloud portal and integrated AI for image quality assessment and lesion detection. This aligns with the routine-use AI screening pattern highlighted in the market overview, where payor recognition of AI-interpreted fundus photography and reported sensitivity benchmarks in the mid-90% range are driving demand for integrated hardware plus software services rather than standalone devices.
A second opportunity cluster is emerging around ultra-widefield and multimodal consolidation, as providers look for broader retinal coverage and more complete assessment in a single visit. Vendors are competing on field of view, modality stacking, and regulatory access: ZEISS secured NMPA approval in China for the CLARUS 700 (June 2025), supporting expansion in high-volume screening, and Optos launched the Silverstone RGB (October 2025) with multiple modalities in one platform. As these systems become more software-defined, practical differentiation is shifting toward data-privacy compliant workflows for cloud-based retinal archives and EHR integration, especially in regions and health systems that require tighter governance for image storage and AI grading.
Recent Industry Developments in Fundus Camera Market
- April 2026: SYSEYE launched the RetiCam 3100 Plus ultra-widefield true color fundus camera, highlighting 176-degree imaging in a single capture. The release adds competitive pressure in wide-field segments where clinical programs value peripheral lesion visibility and rapid screening throughput.
- October 2025: Optos introduced the Silverstone RGB retinal imaging system with multiple modalities integrated into a single platform, including swept-source OCT and autofluorescence options. This supports the trend toward consolidated multimodal workflows used by hospitals and high-volume specialty clinics seeking fewer patient visits per diagnostic workup.
- June 2024: epipole advanced its handheld epiCam positioning around video direct ophthalmoscopy (VDO) concepts, reinforcing portability and non-specialist usability in retinal imaging. The direction supports broader deployment in community and optometric settings where screening programs depend on simpler capture and tele-ophthalmology pathways.


Fundus Camera Market Report Scope and Research Methodology
Market Definition and Coverage
For this report, the market covers revenue generated from fundus camera devices used to capture retinal images for screening, diagnosis, and monitoring in clinical and outreach settings, with values reported in USD and aggregated at a global level.
Scope exclusions: We exclude recurring services and consumables tied to imaging workflows (such as service contracts, software subscriptions, and disposables) unless they are bundled into the device sale price.
Segments Covered in This Report
- By Product Type
- Mydriatic Fundus Cameras
- Non-mydriatic Fundus Cameras
- Hybrid / Wide-field Fundus Cameras
- Other Product Types
- By Modality
- Hand-held Devices
- Table-top / Stationary Systems
- Combination Imaging Platforms
- By Application
- Diabetic Retinopathy
- Glaucoma
- Age-related Macular Degeneration
- Retinopathy of Prematurity
- Other Indications
- By End User
- Hospitals
- Specialty & Eye Clinics
- Ambulatory Surgical Centres
- Screening & Tele-ophthalmology Programs
- By Geography
- North America
- United States
- Canada
- Mexico
- Europe
- Germany
- United Kingdom
- France
- Italy
- Spain
- Rest of Europe
- Asia-Pacific
- China
- Japan
- India
- Australia
- South Korea
- Rest of Asia-Pacific
- Middle East & Africa
- GCC
- South Africa
- Rest of Middle East & Africa
- South America
- Brazil
- Argentina
- Rest of South America
- North America
Data Sources, Market Sizing, and Validation
Desk Research
Desk work starts with building a clean demand and supply picture for retinal imaging equipment, then narrowing it down to fundus camera shipments and the pricing logic behind them. Public sources such as the World Health Organization, the US Centers for Disease Control and Prevention, the International Diabetes Federation, and national statistical agencies were used for aging and diabetes prevalence signals that influence screening volumes.
To keep the model practical, we also reviewed evidence from peer reviewed ophthalmology journals on screening and referral patterns, plus ophthalmology society and association publications that describe how clinical practice has adopted fundus imaging. This was complemented with company filings, investor presentations, product brochures, and reputable press to understand device positioning and typical replacement cycles. Select paid subscriptions for company financials and intelligence, patent databases, and shipment-level import and export data were used in a limited way to cross-check direction and fill gaps. These references are illustrative only, and we relied on additional public sources for data collection, validation, and clarification.
Primary Interviews and Surveys
Primary work focused on validating pricing bands, purchase decision factors, and replacement and upgrade timing across hospitals, eye clinics, and screening programs, then translating that into realistic volume assumptions by region. We also tested how non-mydriatic and hybrid systems are adopted, typical utilization in screening camps versus specialty clinics, and the way tenders or reimbursement changes can shift annual demand, which is then reflected back into our model.
Distribution of primary research fieldwork respondents
| Company type | Respondent position | Region |
|---|---|---|
| Top tier: 29% | CXOs: 14% | APAC: 46% |
| Mid tier: 57% | Functional/Unit leaders: 31% | EMEA: 29% |
| Smaller Players: 14% | Managers: 55% | Americas: 25% |
Market-Sizing & Forecasting
Sizing was built using a top-down approach where the addressable retinal screening and diagnostic pool is reconstructed from diabetes prevalence, aging population trends, eye exam volumes, and the share of sites that typically use fundus imaging. Once the demand pool is established, it is converted into annual device demand using practical inputs such as replacement cycle, mix of mydriatic versus non-mydriatic systems, uptake of handheld units in outreach programs, and average selling price ranges by modality.
To keep the totals grounded, we corroborated the results with selective bottom-up checks, such as sampled average selling price times estimated unit volumes from channel conversations, tender activity signals, and supplier presence across major regions. Where direct unit signals were thin, gaps were handled by applying conservative penetration ranges and then re-testing them with interview feedback until the numbers remained consistent with observed hospital and clinic procurement behavior.
Forecasting relied mainly on scenario analysis, since adoption can move quickly when screening guidelines or funding changes. The scenarios were tied to a small set of drivers that experts could comment on confidently, including diabetic retinopathy screening expansion, growth in tele-ophthalmology programs, shifts toward non-mydriatic imaging, and pricing pressure from technology upgrades.
Data Validation & Update Cycle
Outputs are checked against independent signals, including regional procedure and screening trends, device price movement, and trade flow direction, before numbers are finalized. If a region shows an unusual jump, the assumptions behind adoption, ASP, or replacement timing are reviewed again, and respondents are re-contacted when the variance cannot be explained through documented events.
A multi-step analyst review is followed so that the model logic, inputs, and calculations are re-checked before sign-off. The report is refreshed annually, and interim updates are triggered when material events occur, such as regulatory shifts, major reimbursement changes, or demand shocks. Before delivery, a final pass is completed so clients receive the latest updated view.
Mordor Intelligence's Fundus Camera Market Size Compared Against Other Published Estimates
Published market numbers for fundus cameras can differ even when the product name looks similar, because firms may not align on what is included, which year is treated as the base, and how pricing is handled across modalities and geographies. Differences also show up when one study relies more on assumed penetration rates, and another relies more on supplier side indicators.
Some external estimates roll the category together with broader retinal imaging or add adjacent imaging components in hybrid systems, which increases the addressable total. In Mordor Intelligence, only fundus camera device revenue is counted, and hybrid platforms are included only to the extent that the fundus imaging hardware value is attributable, with services and unrelated imaging modules kept out.
Benchmark comparison
| Source | Market Size | Gaps in Research Methodology |
|---|---|---|
| Mordor Intelligence | USD 512.54 M (2026) | |
| Industry Publisher A | USD 370.60 M (2024) | Uses a different base year and a shorter horizon, and the published figure is sensitive to 2024 pricing and shipment timing, which can understate the later cycle uplift captured in models that start in 2026. |
| Research Firm B | USD 374.90 M (2024) | Starts from a 2024 base and applies a broad growth rate through 2032, but limited visibility on modality mix and regional ASP progression can shift totals when handheld adoption and price tiers are modeled in more detail. |
Taken together, the spread is mostly explained by base-year choice and how the device-only scope is kept clean when hybrid systems and services are present. By tying demand to screening volumes, replacement timing, and realistic ASP bands, our estimate stays traceable to inputs that can be rechecked and updated as market conditions change.


Key Questions Answered in the Report
What is the current size of the fundus camera market?
The fundus camera market stands at USD 512.54 million in 2026 and is projected to reach USD 662.18 million by 2031 at a 5.25% CAGR.
Which fundus-camera product segment leads in revenue?
Non-mydriatic systems lead with 47.62% market share, favored for drop-free imaging and EHR integration.
Why is Asia-Pacific the fastest-growing region?
Rising diabetes prevalence, government screening programs and portable-camera deployments fuel a 6.55% CAGR in Asia-Pacific.
How is artificial intelligence changing fundus-camera use?
FDA-cleared AI platforms provide ≥ 96% sensitivity, deliver three-minute results and reduce reliance on specialist graders, accelerating adoption.
What restrains wider uptake of advanced combination cameras?
High capital cost often exceeding USD 100,000 plus maintenance fees delay purchases by smaller practices.
Which companies recently expanded in fundus-camera technology?
Canon opened a U.S. imaging center, Topcon restructured ownership, and EssilorLuxottica acquired Heidelberg Engineering to deepen AI capabilities.
Page last updated on:


 Your data is secure and never sold or shared.


