Fumaric Acid Market Size and Share
Market Overview
| Study Period | 2021 - 2031 |
|---|---|
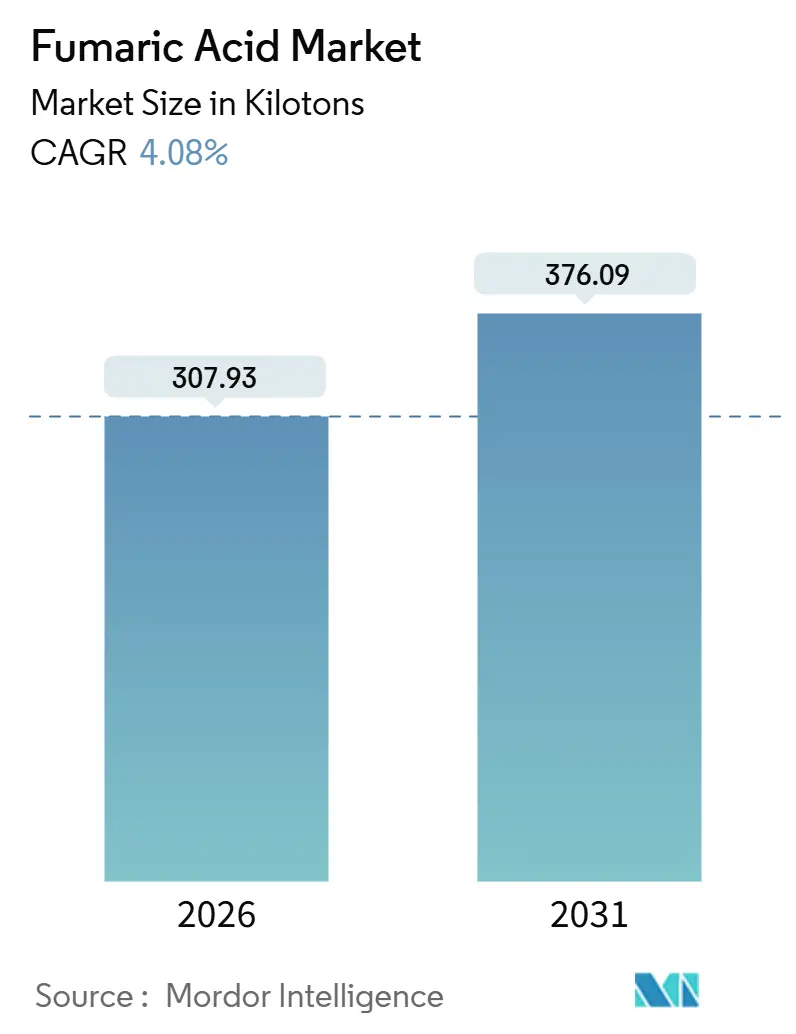
| Market Volume (2026) | 307.93 kilotons |
| Market Volume (2031) | 376.09 kilotons |
| Growth Rate (2026 - 2031) | 4.08% CAGR |
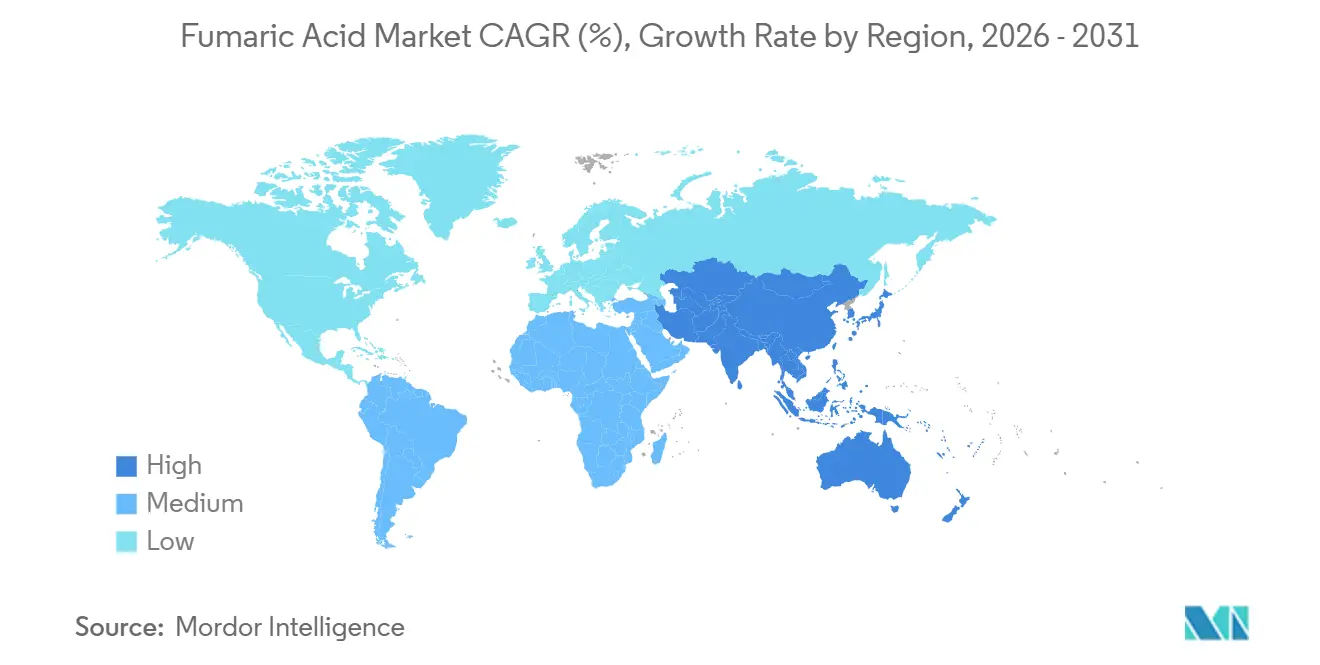
| Fastest Growing Market | Asia Pacific |
| Largest Market | Asia Pacific |
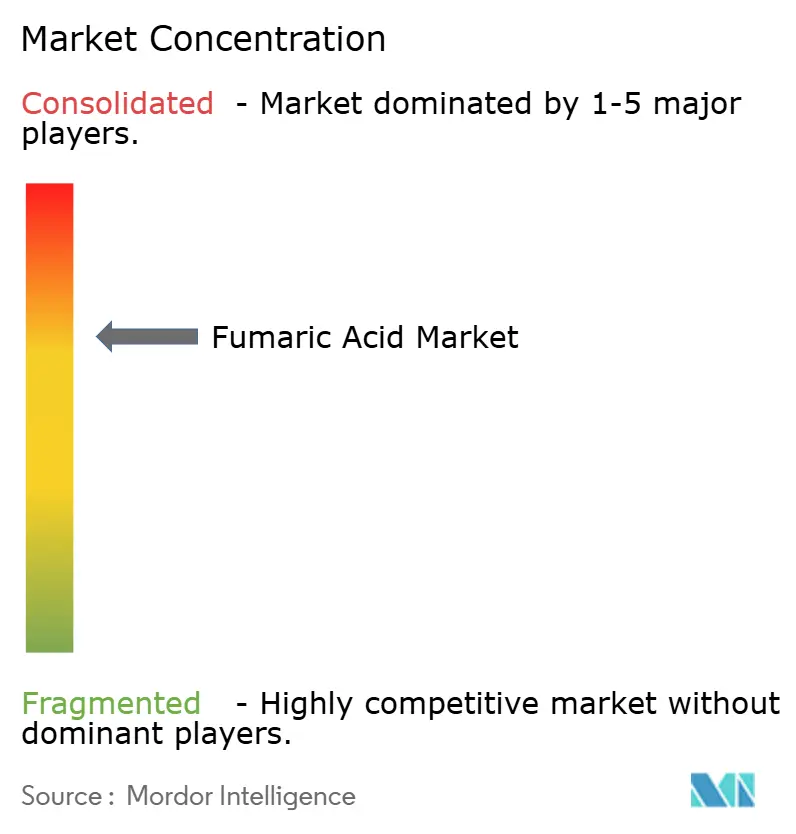
| Market Concentration | Medium |
Major Players *Disclaimer: Major Players sorted in no particular order Image © Mordor Intelligence. Reuse requires attribution under CC BY 4.0. | |
Fumaric Acid Market Analysis by Mordor Intelligence
The Fumaric Acid Market size is estimated at 307.93 kilotons in 2026, and is expected to reach 376.09 kilotons by 2031, at a CAGR of 4.08% during the forecast period (2026-2031). Strong clean-label adoption in packaged foods, escalating EU and U.S. pressure to curb antibiotic use in livestock, and rapid scale-up of carbon-negative fermentation routes are steering demand toward bio-based supply. At the same time, maleic-anhydride feedstock volatility and the European Union’s Carbon Border Adjustment Mechanism (CBAM) are squeezing petro-route margins, encouraging backward integration and new regional capacity. Automotive lightweighting and wind-energy investments are underpinning unsaturated polyester resin (UPR) demand, while semiconductor fabs are creating a lucrative niche for ultra-high-purity polymers. Competitive intensity is moderate; the top five producers account for roughly 69% of global capacity, yet more than 20 sub-scale Chinese firms still vie for share in Asia-Pacific.
Key Report Takeaways
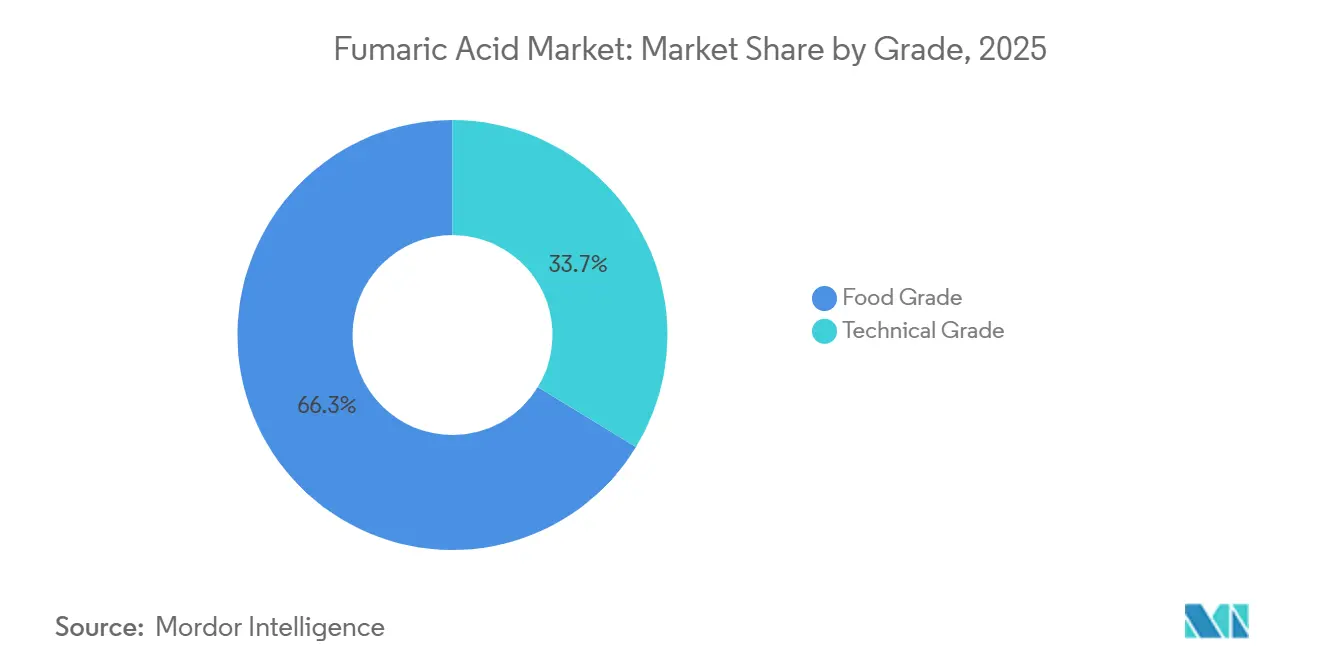
- By grade, food-grade held 66.28% of Fumaric Acid market share in 2025; and is projected to expand at a 4.51% CAGR to 2031.
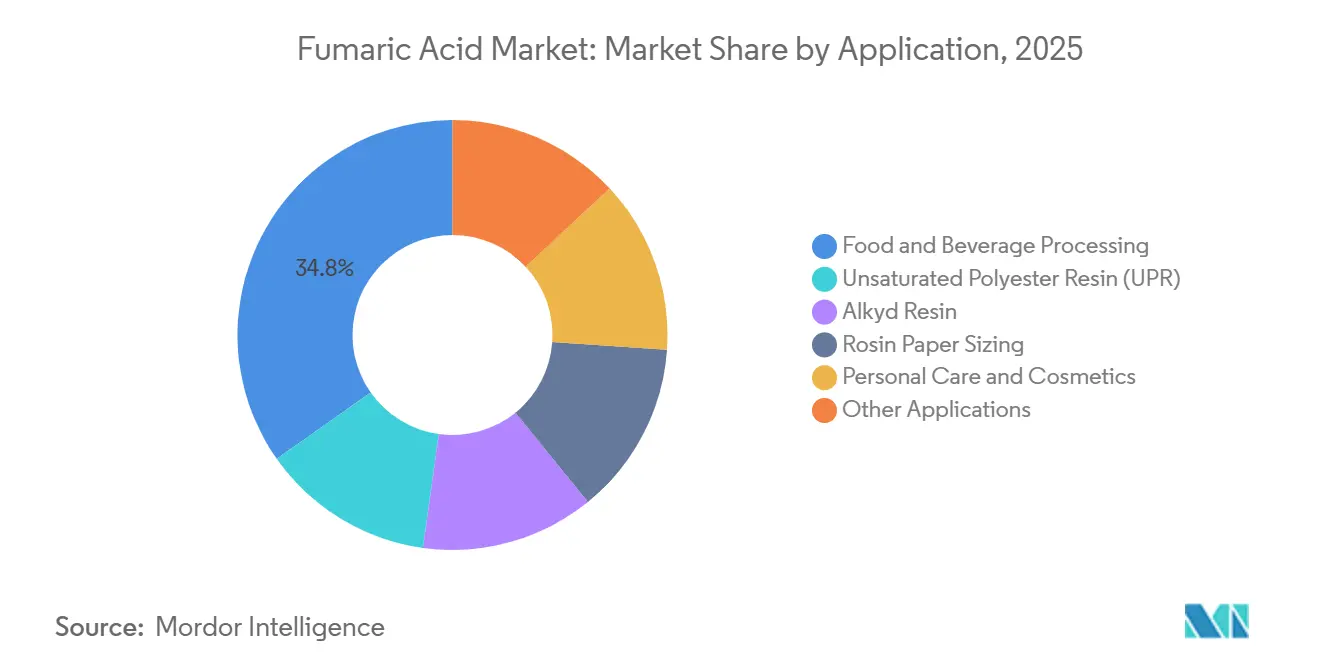
- By application, food and beverage processing led with 34.76% of Fumaric Acid market share in 2025 and is set to rise at a 4.74% CAGR through 2031.
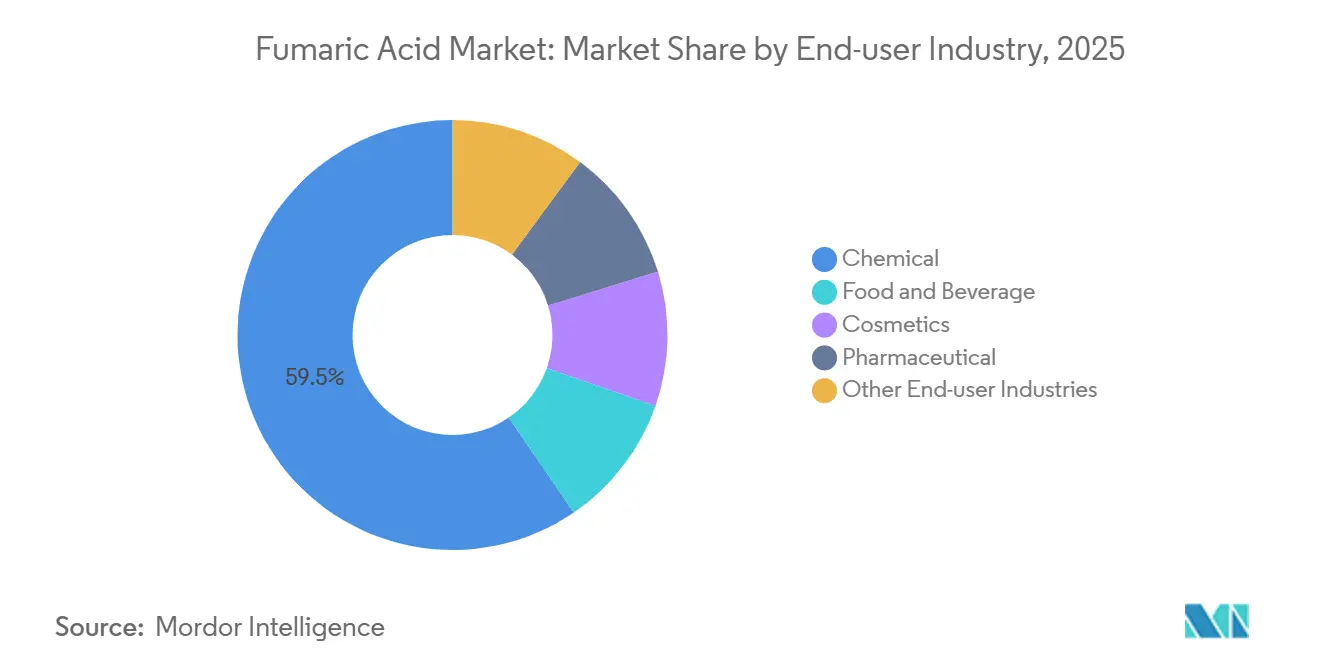
- By end-user industry, the chemical segment commanded 59.54% of Fumaric Acid market size in 2025; pharmaceuticals represent the fastest-growing end-user industry at a 4.96% CAGR through 2031.
- By geography, Asia-Pacific captured 60.21% of global Fumaric Acid market share in 2025; and is forecast to post the highest regional CAGR at 4.88% to 2031.
Note: Market size and forecast figures in this report are generated using Mordor Intelligence’s proprietary estimation framework, updated with the latest available data and insights as of January 2026.
Global Fumaric Acid Market Trends and Insights
Drivers Impact Analysis*
| Driver | (~) % Impact on CAGR Forecast | Geographic Relevance | Impact Timeline |
|---|---|---|---|
| Clean-label demand for bio-fermented fumaric acid in Asian convenience foods | +0.9% | Asia-Pacific (China, Japan, South Korea, ASEAN), spill-over to North America | Medium term (2-4 years) |
| Shift to unsaturated polyester resins for lightweight EV and wind-blade composites | +0.7% | Global, with concentration in China, Europe, North America | Long term (≥ 4 years) |
| Europe and North America antibiotic-free feed laws boosting demand for fumaric acid as an acidulant | +0.6% | Europe, North America | Short term (≤ 2 years) |
| Growth of specialty water-treatment polymers in semiconductor fabs | +0.3% | Asia-Pacific (Taiwan, South Korea, Japan), North America | Medium term (2-4 years) |
| Cradle-to-gate carbon-negative fermentation technologies attracting green finance | +0.5% | Europe, North America, emerging in China | Long term (≥ 4 years) |
| Source: Mordor Intelligence | |||


Clean-Label Demand for Bio-Fermented Fumaric Acid in Asian Convenience Foods
Spiking consumer scrutiny over ingredient declarations is reshaping acidulant sourcing in Japan, South Korea, and China. Japan’s April 2024 Food Sanitation Act amendments require explicit labeling of synthetic additives, spurring a reformulation wave among convenience-store chains. South Korea’s November 2024 guidance encourages producers to disclose production routes, further nudging demand toward fermentation-derived material. Chinese firms such as Yantai Hengyuan and Changmao Biochemical added an estimated 15,000 tons of bio-capacity across 2024-2025, narrowing the historical 25% price premium for food-grade bio-material to roughly 12% by 2025. Rising middle-class incomes in ASEAN are expected to mirror this trend, expanding regional uptake.
Shift to Unsaturated Polyester Resins for Lightweight EV and Wind-Blade Composites
Electric-vehicle platforms now incorporate about 450 pounds of plastics and composites compared with 310 pounds in ICE vehicles, a delta largely driven by weight-offsetting battery mass. European automakers seeking to meet 2025 fleet-wide CO₂ targets are specifying glass-fiber UPR parts that contain 8%-12% fumaric-based co-monomers. Offshore wind projects similarly favor fumaric-modified UPR for blades over 80 meters long, where enhanced fatigue resistance is critical. Counterbalancing forces include premium-segment moves to carbon-fiber prepregs and bio-epoxy systems, but the overall pull from mass-market EVs supports continued volume growth.
Europe and North America Antibiotic-Free Feed Laws Boosting Fumaric-Acid Acidulants
The European Food Safety Authority’s October 2024 opinion validated fumaric acid at inclusion rates up to 2% for all livestock species[1]European Food Safety Authority, “Scientific Opinion on the Safety and Efficacy of Fumaric Acid as Feed Additive,” efsa.europa.eu . Parallel U.S. initiatives in California and Oregon set stricter antibiotic reduction targets, encouraging integrators to switch to organic acids. Fumaric acid’s hydrophobic profile prolongs gut acidification, enabling lower inclusion rates than formic or propionic alternatives and giving it an 8%-10% share of a USD 2.5 billion feed-acidulant pool in 2025. Producers such as Bartek Ingredients and Thirumalai Chemicals expanded feed-grade lines in 2024 to capture rising demand.
Growth of Specialty Water-Treatment Polymers in Semiconductor Fabs
Migration to sub-3-nanometer process nodes is tightening particle and metal-ion thresholds in fab water systems. Fumaric-based polyacrylic copolymers provide superior chelation for calcium and magnesium, critical for ultrapure-water loops. Each advanced fab commissioned by Taiwan Semiconductor Manufacturing Company or Samsung Electronics requires roughly 10-15 tons of these polymers annually. Japan’s 2024 Economic Security Promotion Act further incentivizes domestic production of critical materials, providing a high-margin outlet for pharmaceutical-grade or higher purity fumaric feedstock.
Restraints Impact Analysis*
| Restraint | (~) % Impact on CAGR Forecast | Geographic Relevance | Impact Timeline |
|---|---|---|---|
| Volatility in maleic-anhydride feedstock and benzene spot prices | -0.8% | Global, acute in Asia-Pacific and Europe | Short term (≤ 2 years) |
| EU CO₂-footprint taxation on petro-route acids (CBAM) | -0.5% | Europe, indirect impact on global trade flows | Medium term (2-4 years) |
| Competitive threat from succinic and malic acid in shelf-stable foods | -0.4% | North America, Europe | Medium term (2-4 years) |
| Source: Mordor Intelligence | |||
Volatility in Maleic-Anhydride Feedstock and Benzene Spot Prices
Spot maleic-anhydride quotations see-sawed between USD 1,050 and USD 1,400 per ton in China during 2024-2025, mirroring benzene price swings. Several small Chinese fumaric acid producers idled units in Q1 2024 when benzene briefly spiked past CNY 7,200 per ton. European operators faced a double hit from volatile benzene and natural-gas prices that averaged EUR 35-45 per MWh in 2024. Lacking long-term maleic contracts, producers struggle to lock in stable margins, prompting vertical integration and portfolio diversification.
EU CO₂-Footprint Taxation on Petro-Route Acids (CBAM)
Full enforcement of CBAM in January 2026 imposes a levy equivalent to EUR 80-90 per ton CO₂ on imports under CN 2917. With petro-route fumaric acid carrying around 2.8 kg CO₂-eq/kg, Chinese shipments face a USD 50-70 per ton landing-cost increase. European buyers are now qualifying suppliers able to certify ISO 14067 footprints or offer bio-based alternatives, tilting the trade balance toward regional and carbon-negative production.
*Our forecasts treat driver/restraint impacts as directional, not additive. The impact forecasts reflect baseline growth, mix effects, and variable interactions.
Segment Analysis
By Grade: Food grade drives the clean-label revolution
Food-grade accounted for 66.28% of the Fumaric Acid market in 2025, expanding at a 4.51% CAGR to 2031. Bartek’s new line is devoted wholly to food-grade output, illustrating strategic emphasis on higher-margin, regulation-intensive channels. Technical-grade demand, tied closely to UPR and alkyd resins, lags amid CBAM costs and volatile maleic feedstocks, yet remains vital for construction and automotive coatings.
Bio-fermentation has compressed the historic 20-25% price premium down to 12-15% by 2025, increasing addressable demand in price-sensitive developing markets. BASF expects its CO₂-negative process to reach commercial readiness by 2027, potentially redefining the carbon disclosure landscape for food additives. Producers with dual-spec plants can toggle between grades to cushion swings in either segment, a hedge increasingly favored by integrated chemical houses.

By Application: Food and Beverage Processing leads Multi-sector Growth
Food and beverage processing commanded 34.76% of Fumaric Acid market size in 2025 and is advancing at a 4.74% CAGR, buoyed by clean-label momentum and hydrophobic leavening properties in bakery mixes. UPR benefits from EV and wind-blade adoption yet faces eventual substitution from carbon-fiber prepregs in high-end vehicles.

By End-user Industry: Chemical Segment Faces Substitution Pressure
Chemical absorbed 59.54% of global volume in 2025, but growth is slowing as bio-epoxy and carbon-fiber systems advance. Food and beverage end-users are the main growth engine, switching from synthetic acidulants to fermentation-based options under label-cleaning programs. The pharmaceutical end-user pool, though smaller, expands most rapidly on DMF uptake, while cosmetics gain traction as brands emphasize naturally derived actives. Animal nutrition and semiconductor polymers collectively add a steady, regulation-driven uplift.
Pharmaceutical industry is growing at 4.96% CAGR through 2031 as dimethyl fumarate consolidates its role in multiple sclerosis and psoriasis therapies. Premium pricing of USD 3,500-4,500 per ton under GMP standards lures producers able to clear pharmacopeial hurdles. Specialty polymers for semiconductor water treatment and rosin-sizing agents for food-contact paper round out a portfolio of high-margin, lower-volume uses.
Geography Analysis
Asia-Pacific controlled 60.21% of global volume in 2025 and is set for a 4.88% CAGR through 2031. China alone contributes major world capacity, with clusters in Shandong, Hebei, and Jiangsu and a growing share of bio-fermentation units. India is scaling output to meet pharmaceutical and food-grade demand, while Japan and South Korea rely on imports aligned with stringent purity laws. ASEAN nations, especially Vietnam and Thailand, are emerging demand bases as rising urban incomes fuel convenience-food uptake.
North America benefits from Bartek’s capacity doubling, positioning the region as a net exporter of bio-grade material. Europe is reshaping supply chains in response to CBAM. Germany, France, and Italy are key consumption nodes, with regional resin producers qualifying low-carbon feedstock. EFSA’s favorable feed-additive ruling further enlarges the European addressable pool.
South America and the Middle East and Africa together account for lower global demand. Brazil leads South America via its food sector, while Argentina trials fumaric acid in livestock rations. Gulf Cooperation Council nations are exploring backward integration for construction-grade resins, and South Africa provides incremental pharmaceutical and food-processing demand.
Mordor Intelligence provides coverage of the fumaric acid market across other key regional markets. Detailed country-level analysis extends to United States incorporating local coverage and market participation, as required.

Competitive Landscape
The Fumaric Acid market exhibits a moderate concentration: Bartek Ingredients, Polynt, Thirumalai Chemicals, FUSO Chemical, and Yantai Hengyuan together control roughly 69% of installed capacity. Bartek’s Stoney Creek plant, online since September 2024, delivers an 80% emissions cut and solidifies the firm’s position as the largest bio-based producer. BASF’s CO₂-negative FUMBIO pilot, backed by EUR 2.6 million in federal funding, illustrates big-chemistry bets on stricter carbon policies[2]BASF SE, “FUMBIO Project Targets Carbon-Negative Organic Acids,” basf.com .
Niche opportunities in semiconductor polymers and pharma-grade intermediates provide attractive margins but demand stringent quality systems, limiting easy entry. Chinese start-ups such as Huaheng Bio and Xuelang Bio are piloting 2,000-10,000 ton bio-plants, though export penetration hinges on meeting Western regulatory audits. Vertical integration is accelerating in both directions: resin producers such as Polynt consider backward moves into fumaric acid, while acid producers eye forward integration into specialty resins and pharma esters.
Fumaric Acid Industry Leaders
Bartek Ingredients Inc.
Polynt S.p.A.
Thirumalai Chemicals
FUSO CHEMICAL CO., LTD.
Yantai Hengyuan Biotechnology Co., Ltd.
- *Disclaimer: Major Players sorted in no particular order

Recent Industry Developments
- June 2024: BASF launched the FUMBIO project in collaboration with three German universities, supported by EUR 2.6 million in funding, to convert sugar and carbon dioxide into fumaric acid. The project aimed to evaluate the CO2 footprint of fumarate produced using biotechnological methods and compare it with that of petrochemical-based production.
- February 2024: Researchers at Osaka Metropolitan University successfully produced fumaric acid using carbon dioxide, renewable resources, and biomass-derived chemicals. By utilizing carbon dioxide directly from the gas phase as a raw material, they achieved the production of fumaric acid.


Research Methodology Framework and Report Scope
Market Definitions and Key Coverage
Mordor Intelligence defines the fumaric acid market as the global trade and on-site consumption of new, industrially produced fumaric acid, whether synthesized from maleic anhydride or bio-fermented, for use as an acidulant, intermediate, or resin modifier across food, chemical, polymer, and pharmaceutical value chains. Production volumes converted to finished-grade equivalents are the sizing currency.
Scope exclusion: Regenerated or recovered fumaric acid streams that are reused within the same facility are not counted.
Segmentation Overview
- By Grade
- Food Grade
- Technical Grade
- By Application
- Food and Beverage Processing
- Unsaturated Polyester Resin (UPR)
- Alkyd Resin
- Rosin Paper Sizing
- Personal Care and Cosmetics
- Other Applications
- By End-user Industry
- Chemical
- Food and Beverage
- Cosmetics
- Pharmaceutical
- Other End-user Industries
- By Geography
- Asia-Pacific
- China
- India
- Japan
- South Korea
- ASEAN Countries
- Rest of Asia-Pacific
- North America
- United States
- Canada
- Mexico
- Europe
- Germany
- United Kingdom
- France
- Italy
- Rest of Europe
- South America
- Brazil
- Argentina
- Rest of South America
- Middle-East and Africa
- Saudi Arabia
- South Africa
- Rest of Middle-East and Africa
- Asia-Pacific
Detailed Research Methodology and Data Validation
Desk Research
Our analysts began with supply-side footprints from public customs logs, U.S. ITC trade tables, Eurostat PRODCOM, and China Customs to benchmark export-import flows. Industry association yearbooks such as the European Food & Feed Acidulants Association and the Unsaturated Polyester Resin Alliance provided demand cues. Company 10-Ks, investor decks, and safety-data filings fleshed out capacity, grade mix, and average selling prices. Paid databases, D&B Hoovers for producer revenues and Dow Jones Factiva for price movements, anchored competitive shares. These illustrative sources are representative, not exhaustive; many additional references informed data checks.
Primary Research
We interviewed producers, food-additive formulators, UPR resin blenders, and regional distributors across Asia-Pacific, North America, and Europe. Discussions clarified throughput, line-run factors, and substitution trends (citric vs. fumaric) and helped stress-test desk estimates, especially where customs codes combine multiple acids.
Market-Sizing & Forecasting
The baseline volume was first derived top-down from national production and trade balances, then corroborated with sampled bottom-up roll-ups of producer nameplate capacity x utilization. Key variables, maleic anhydride price spreads, global processed-food output, UPR resin production, pharmaceutical fumarate demand, and announced capacity additions, feed a multivariate regression that projects volumes through the forecast period. Where bottom-up checks deviated beyond a specified threshold, assumptions on run-rates or inventory swings were iterated until convergence.
Data Validation & Update Cycle
Outputs pass a three-layer review: automated variance scans, peer analyst audit, and senior sign-off. We refresh models annually and trigger interim reviews for events like major plant shutdowns or food-acidulant regulatory changes. Prior to release, an analyst re-pulls key signals so clients receive our latest view.
Why Mordor's Global Fumaric Acid Baseline Deserves Reliance
Published figures differ because consultancies choose varying definitions, metrics, and refresh cadences; value-based reports may mask grade or currency shifts, while volume-led models like ours expose real supply-demand movement.
Key gap drivers include:
Benchmark comparison
| Market Size | Anonymized source | Primary gap driver |
|---|---|---|
| 296 kt (2025) | Mordor Intelligence | - |
| USD 583.5 m (2024) | Regional Consultancy A | Bundles niche derivatives; uses single global ASP |
| USD 808.4 m (2024) | Trade Journal B | Excludes technical-grade feedstock channels |
| USD 1.1 bn (2024) | Industry Analytics C | Utilizes aggressive demand CAGR, omits plant additions |
These contrasts show that when scope clarity, dual-path modeling, and frequent refreshes are applied, as Mordor analysts do, the resulting baseline remains the most balanced and reproducible foundation for decision-makers.


Key Questions Answered in the Report
What is the current global volume for the Fumaric Acid market?
It stood at 307.93 kilotons in 2026 and is projected to reach 376.09 kilotons by 2031.
How does CBAM affect pricing in Europe?
The mechanism adds USD 50-70 per ton to high-carbon imports, narrowing the historical price gap with European bio-based supply.
Why is food-grade fumaric acid gaining share?
Clean-label regulations in Asia-Pacific and Europe favor fermentation-derived material with verified purity and low carbon footprints.
What competitive advantage do carbon-negative processes offer?
They qualify for green-finance incentives and help buyers meet scope-3 emission targets, supporting premium pricing and market access.
Page last updated on:


