Humic Acid Market Size and Share
Market Overview
| Study Period | 2021 - 2031 |
|---|---|
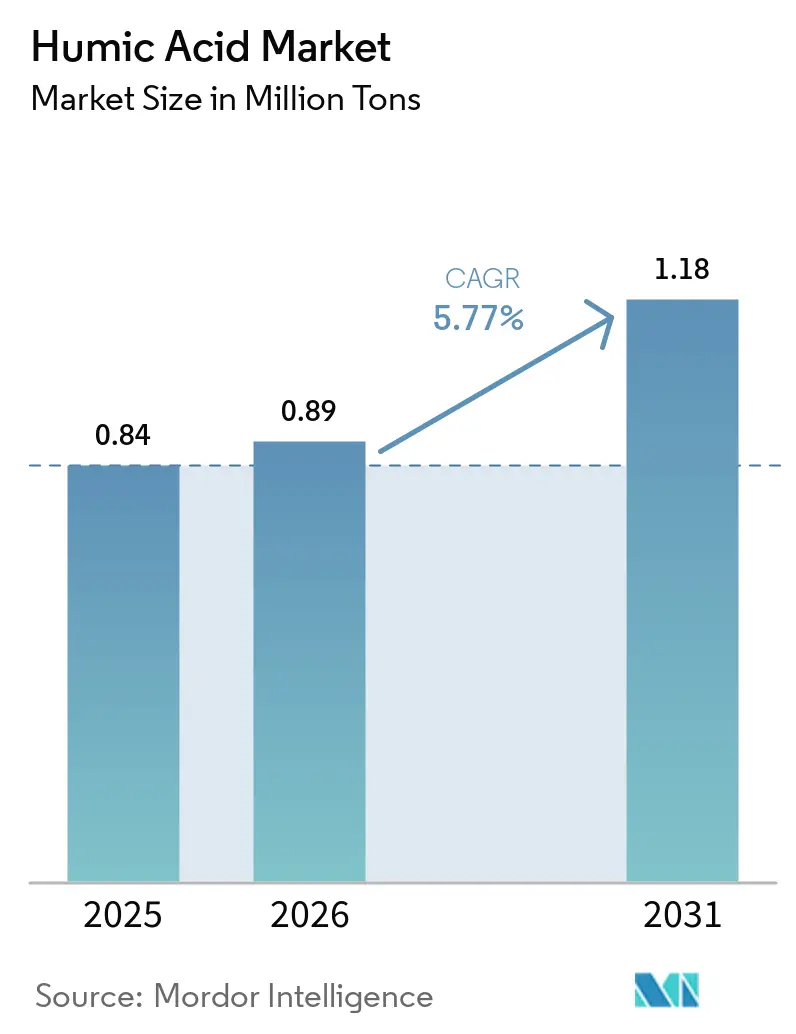
| Market Volume (2026) | 0.89 Million tons |
| Market Volume (2031) | 1.18 Million tons |
| Growth Rate (2026 - 2031) | 5.77% CAGR |
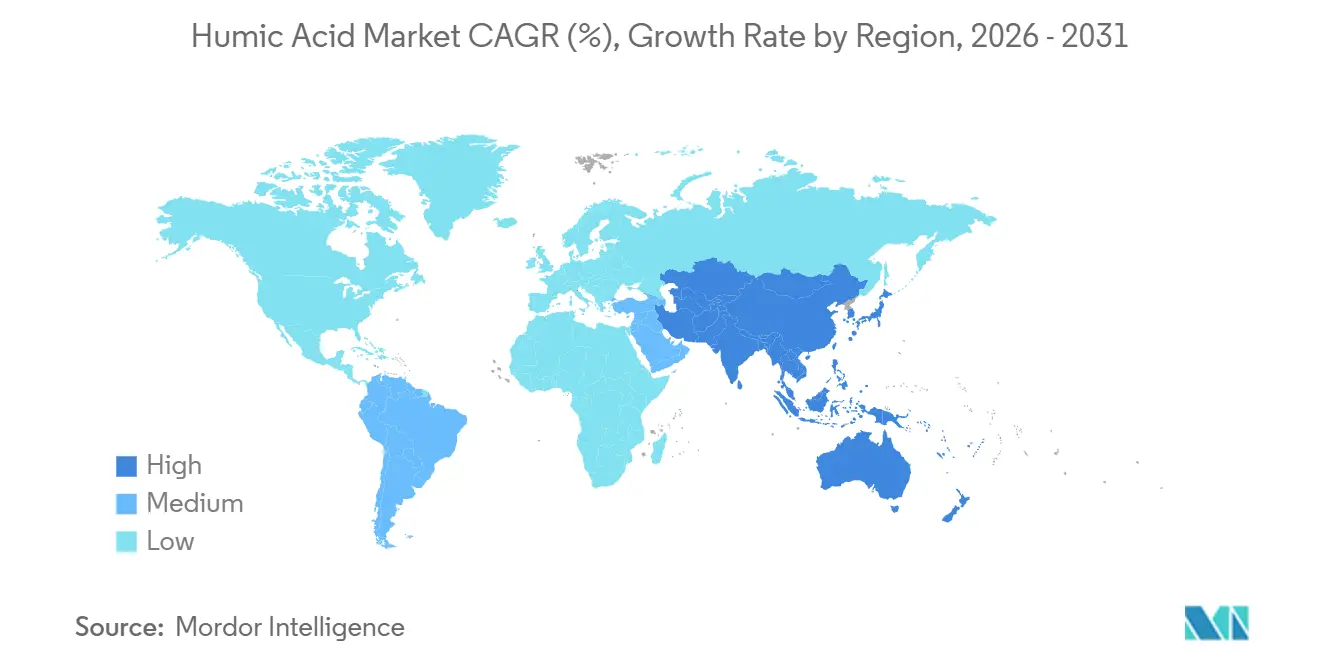
| Fastest Growing Market | Asia Pacific |
| Largest Market | Europe |
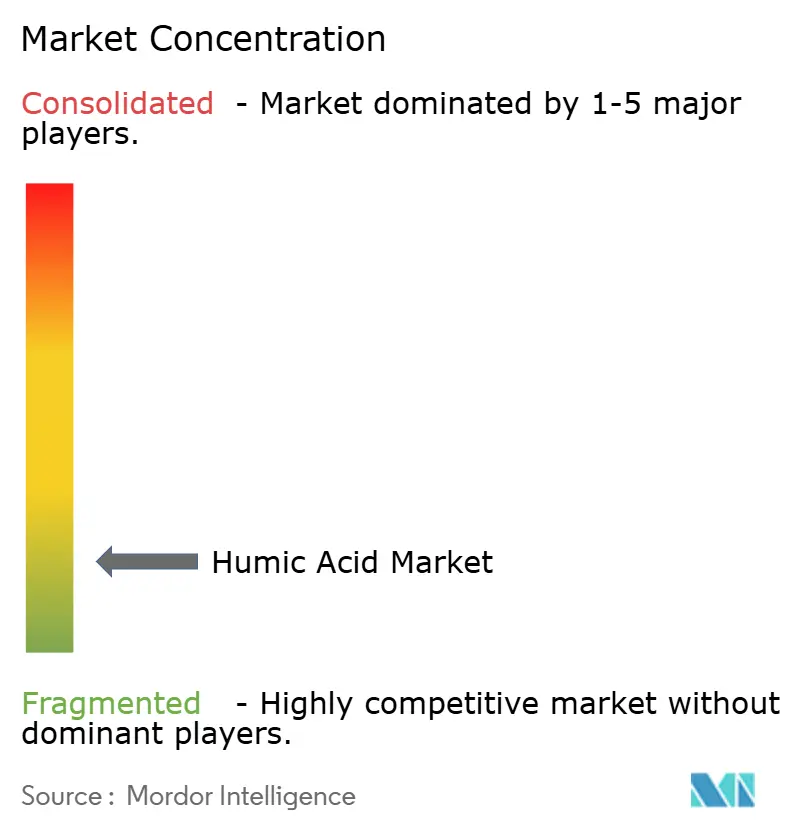
| Market Concentration | Low |
Major Players *Disclaimer: Major Players sorted in no particular order Image © Mordor Intelligence. Reuse requires attribution under CC BY 4.0. | |
Humic Acid Market Analysis by Mordor Intelligence
The Humic Acid Market size is projected to expand from 0.84 Million tons in 2025 and 0.89 Million tons in 2026 to 1.18 Million tons by 2031, registering a CAGR of 5.77% between 2026 to 2031. Demand is anchored in organic-fertilizer manufacturing, animal-feed supplementation, and a widening set of industrial water-treatment uses. Explicit regulatory approval in the European Union, sizable public incentives in India, and rising precision‐farming investments in drought-prone regions are reinforcing long-term growth. Vertically integrated producers are consolidating mining rights to ensure supply security, while ESG pressures are compelling new investments in solar-powered processing plants and third-party life-cycle assessments. At the same time, microbial consortia, compost-derived humic substances, and biochar are emerging substitutes that keep pricing competitive and spur innovation.
Key Report Takeways
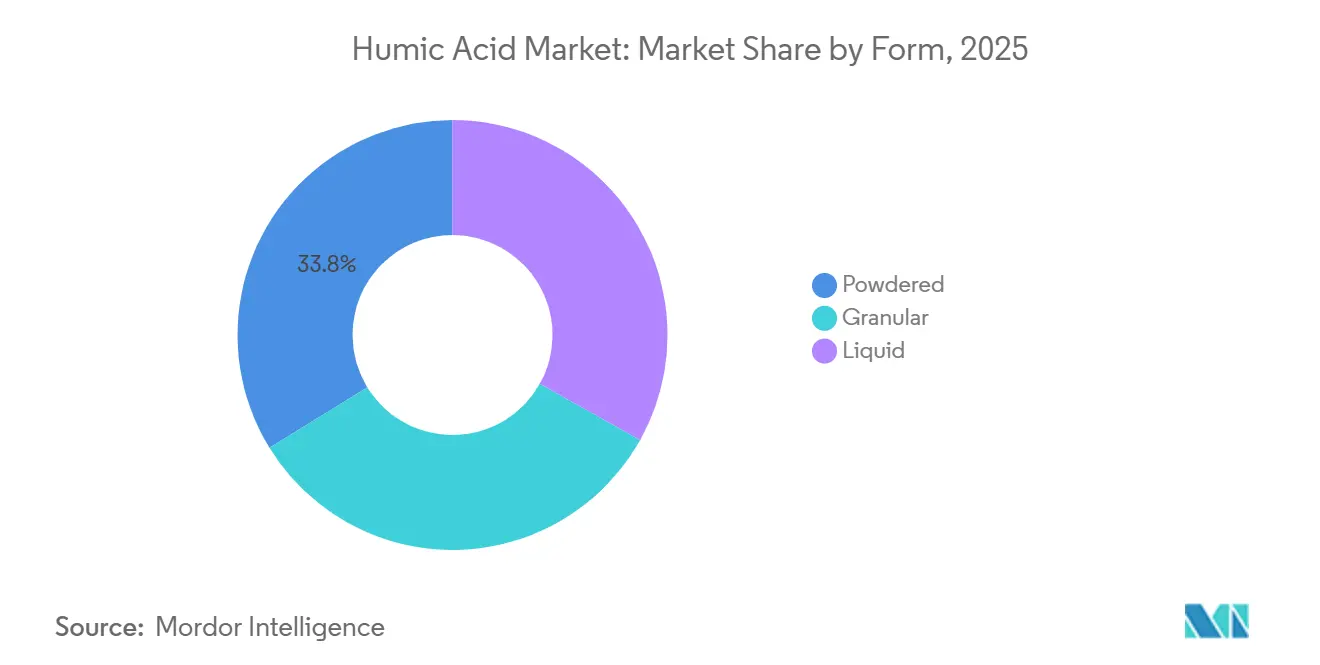
- By form, powdered products held 33.78% of the Humic Acid market share in 2025, while liquid formulations are forecast to expand at a 6.72% CAGR through 2031.
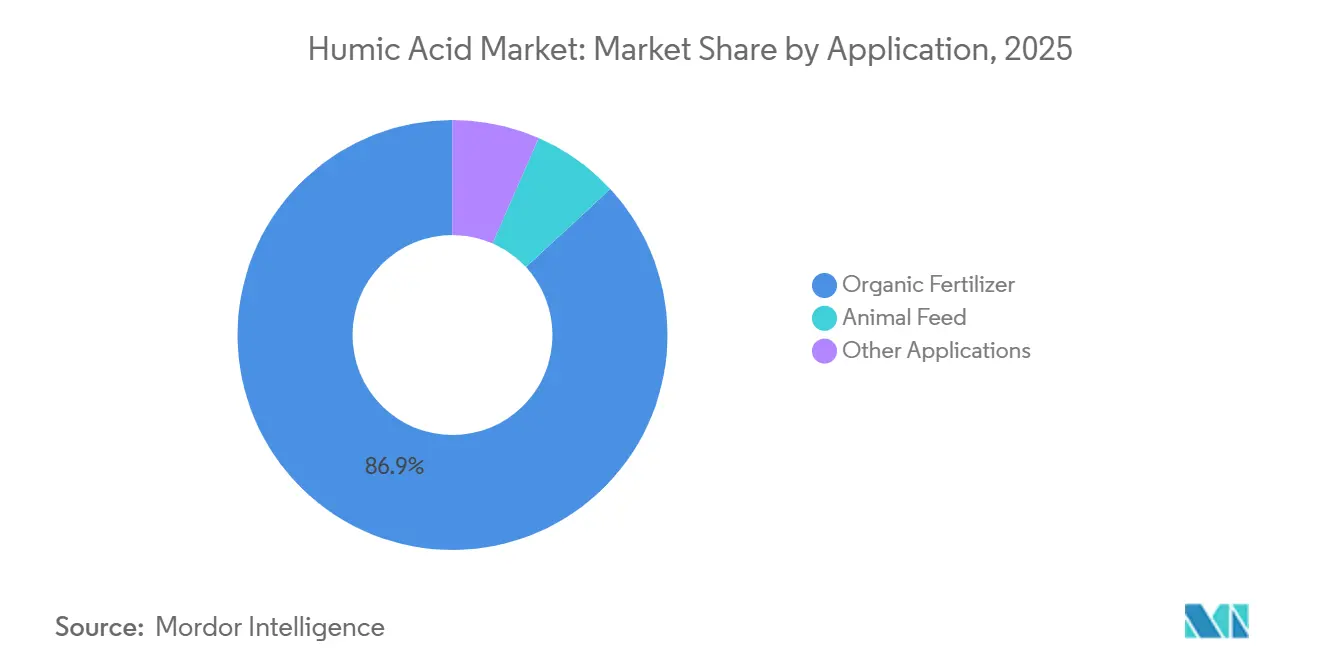
- By application, organic fertilizer accounted for 86.88% of the Humic Acid market size in 2025; other applications (industrial, water treatment, and specialty chemicals) are projected to grow at a 6.69% CAGR to 2031.
- By geography, Europe led with 32.17% volume share in 2025, whereas Asia-Pacific is advancing at a 7.22% CAGR during the same period.
Note: Market size and forecast figures in this report are generated using Mordor Intelligence’s proprietary estimation framework, updated with the latest available data and insights as of 2026.
Global Humic Acid Market Trends and Insights
Drivers Impact Analysis*
| Driver | (~) % Impact on CAGR Forecast | Geographic Relevance | Impact Timeline |
|---|---|---|---|
| Rising adoption in regenerative agriculture | +1.2% | Global, with early gains in North America, EU, and Australia | Medium term (2-4 years) |
| EU limits on synthetic fertilizer usage | +1.0% | Europe (Germany, France, Spain, Italy, Netherlands) | Short term (≤ 2 years) |
| Precision vertical-farm nutrient optimization | +0.8% | North America, East Asia (Japan, South Korea, Singapore), Middle East | Medium term (2-4 years) |
| Humic-acid biostimulants for drought resilience | +1.1% | Global, concentrated in Mediterranean, Middle East & North Africa, South Asia, and Southwest USA | Long term (≥ 4 years) |
| Humic Acid-based carbon-sequestration additives demand | +0.6% | North America, EU (carbon-credit pilot regions), Australia | Long term (≥ 4 years) |
| Source: Mordor Intelligence | |||
Rising Adoption in Regenerative Agriculture
Field studies show that Humic Acid improves cation-exchange capacity and microbial biomass, directly supporting regenerative-soil targets. A 2024 lettuce trial in Spain delivered higher tissue phosphorus, iron, and manganese when 500 kg/ha of commercial humate was applied. Large row-crop operators in the United States and Australia are scaling purchases because humates provide a bridge solution until higher-efficacy biochar and enhanced-weathering inputs reach cost parity. Advisory bodies highlight that performance is stress-dependent, yet growers still value the yield buffering under variable moisture conditions. Corporate sustainability programs that monetize nitrogen-runoff reductions and soil-organic-carbon gains further encourage procurement. Public conversations around soil-health credits are amplifying the perceived upside despite the absence of a formal carbon-credit methodology today.
EU Limits on Synthetic Fertilizer Usage
The European Commission’s Farm-to-Fork strategy seeks a 20% cut in synthetic fertilizers by 2030, and Regulation 2019/1009 explicitly lists Humic Acid as a permissible component in organic and organo-mineral fertilizers. Member states now incorporate humate purchases into national eco-scheme subsidies, accelerating uptake in greenhouse horticulture that favors drip-ready liquids. Germany, France, and Spain are the largest immediate beneficiaries because nutrient-use-efficiency targets under the Nitrates Directive have tightened agronomic margins. Suppliers must maintain cadmium below 1.5 mg/kg dry matter to preserve CE marking, but most industrial producers already batch-test to stricter internal limits, reducing compliance risk.
Precision Vertical-Farm Nutrient Optimization
Controlled-environment farms prize consistent pH and trace-element availability. Fulvic-acid fractions (1,000-10,000 Da) deliver superior solubility, rescuing manganese and iron availability in recirculating systems. A Tokyo operator reported a 15% yield gain in leafy greens after switching from synthetic chelates to fulvic-acid supplements. However, recommended commercial doses of 2-3 kg/ha remain far lower than the 50 kg/ha rates tested in laboratories, tempering the attainable agronomic lift. Growth in this driver therefore stays niche, adding only 0.8 percentage points to the Humic Acid market CAGR until costs decline or formulators validate higher-concentration protocols.
Humic-Acid Biostimulants for Drought Resilience
Water-scarce regions are adopting potassium-humate foliar sprays and fertigation blends to raise water-use efficiency. Egyptian barley trials under saline-sodic conditions achieved a 57% grain-yield jump and 25% phosphorus savings at 4.75 kg/ha application. Similar results in Xinjiang potatoes showed a 121% yield spike under deficit irrigation. National agencies in Saudi Arabia and India subsidize humate distribution to smallholder farms cultivating date palms, cotton, and groundnuts. Nonetheless, species-specific variability remains; heat-stressed lambs failed to benefit from 0.6% dietary inclusion, signaling that field validation is critical before mass deployment.
Restraints Impact Analysis*
| Restraint | (~) % Impact on CAGR Forecast | Geographic Relevance | Impact Timeline |
|---|---|---|---|
| Limited mechanized application infrastructure | -0.7% | Sub-Saharan Africa, South Asia (smallholder zones), Southeast Asia | Short term (≤ 2 years) |
| Competing microbial consortia products | -0.5% | Global, concentrated in North America, EU, and Brazil | Medium term (2-4 years) |
| ESG scrutiny of Humic Acid mining licences | -0.4% | North America (North Dakota, Wyoming), Spain (Teruel), Russia | Long term (≥ 4 years) |
| Source: Mordor Intelligence | |||
Limited Mechanized Application Infrastructure
Effective rates for powdered Humic Acid often exceed 200 kg/ha, but smallholder plots average 1.1 ha in India and lack drip systems. Manual broadcasting is labor-intensive and yields patchy coverage. India’s National Mission on Natural Farming will establish 10,000 bio-input resource centers, yet only 2% of farmers will be trained by 2026[1]Indian Ministry of Agriculture, “Mission on Natural Farming Progress Note,” pib.gov.in. Drip adoption below 10% across South Asia and Sub-Saharan Africa keeps distribution uneven. Ultra-concentrated liquids offer relief but remain more expensive than synthetic alternatives, delaying penetration in low-income geographies by at least five years.
Competing Microbial Consortia Products
Biofertilizers providing nitrogen fixation and phosphate solubilization retail at USD 15-30/ha, undercutting Humic Acid products that can cost up to USD 100/ha at agronomically effective doses. A 2024 study showed compost‐derived humic substances matched or outperformed mined humates in cadmium adsorption and pH buffering. Brazilian sugarcane growers now favor Azospirillum inoculants, reducing humate orders by 15% since 2024. Humic-acid suppliers are responding with hybrid carriers blending beneficial microbes and humate matrices, but must price at a 20-30% premium to recoup R&D.
*Our forecasts treat driver/restraint impacts as directional, not additive. The impact forecasts reflect baseline growth, mix effects, and variable interactions.
Segment Analysis
By Form: Liquid Formulations Gain Fertigation Traction
Liquid products contributed 6.72% CAGR to overall growth from 2026 to 2031, while powdered grades retained 33.78% volume share of the Humic Acid market in 2025. The Humic Acid market size for liquids is projected to rise to 0.39 million tons by 2031 as fertigation and precision-drip systems proliferate in water-scarce regions. Producers such as The Andersons and HumiSource deliver 12-20% humate liquids that integrate with GPS-guided injectors, cutting transport costs and improving dose precision[2]The Andersons, “UltraMate LQ Technical Sheet,” andersonsinc.com.
Powdered Humic Acid remains the low-cost choice, selling at USD 350-500/ton in China, and dominates broadcast applications across cereals and oilseeds. Granular formats serve golf-course and ornamental markets but represent under 10% of the Humic Acid market share and grow slowly because of higher production costs. Regulatory pH and solubility limits are more exacting for liquids, yet suppliers meet them through high-alkaline extraction and chelation steps. As liquid formulations achieve dose efficiency, their share will rise, narrowing the gap with powders without displacing them entirely.


By Application: Organic Fertilizer Dominates, Industrial Uses Accelerate
Organic fertilizers absorbed 86.88% of global volume in 2025, solidifying the segment’s leadership within the Humic Acid market. Europe’s CE-marked organo-mineral blends and the United States Department of Agriculture’s National Organic Program foster predictable demand, while India’s Natural Farming mission earmarks procurement budgets that scale from 2025 onward.
Other applications, including Industrial, water-treatment, and specialty-chemical, are the fastest-expanding bucket at 6.69% CAGR. Landfill-leachate treatment achieves 86% COD removal when acid flocculation uses specialty humate extracts, and cement-admixture demand in China and the Middle East supports premium prices near USD 3,000/ton. Humates’ biodegradable-mulch potential further widens the revenue base beyond agriculture, insulating suppliers from crop-price swings and underpinning diversified capital allocation in R&D pipelines.
Geography Analysis
Europe captured 32.17% of the Humic Acid market volume in 2025 due to Regulation 2019/1009, which legitimizes humates across fertilizer categories, with cadmium capped at 1.5 mg/kg dry matter. Germany, France, and Spain jointly advance humate adoption to meet nitrogen-use-efficiency targets, while Italian organic acreage rose 8% in 2024 under Common Agricultural Policy eco-schemes. Regional suppliers Humintech and Jiloca Industrial leverage local mining plus on-site processing to serve greenhouse belts where fertigation penetration exceeds 80%. Nordic restoration projects explore humate amendments in peatland carbon rebuilding, but volumes remain nascent.
Asia-Pacific is the highest-growth cluster, forecast at a 7.22% CAGR through 2031. India’s National Mission on Natural Farming funds 10,000 bio-input centers and 1 crore farmer outreach, institutionalizing procurement channels that should double domestic offtake by 2028. China operates 54 potassium-humate and fulvate plants, with Shandong hosting 14 exporters that ship to Southeast Asia and the Gulf. Tokyo and Singapore vertical farms incorporate fulvic supplements for micronutrient chelation, generating 15% fresh-weight gains in leafy crops. Capital expenditure for drip systems still restrains Southeast Asian smallholder uptake, but community fertigation hubs in Thailand and Indonesia foreshadow scalable models.
North America combines large reserves with growing ESG constraints. Minerals Technologies produced 41,000 tons from Gascoyne in 2024, down from 75,000 tons in 2023 as reclamation work proceeded. HGS BioScience’s April 2025 purchase of Menefee Mining adds New Mexico processing powered 40% by on-site solar, lowering Scope-2 emissions by 12%. Middle East desert agriculture is an emerging outlet; Saudi Arabia distributed humate soil amendments to 2,500 farms in 2025, and vertical farms in the UAE now test liquid fulvic blends in hydroponic lettuce. Sub-Saharan Africa lags because mechanization and credit access remain limited.

Competitive Landscape
The Humic Acid market is highly fragmented. Competitive tactics feature vertical integration from mine to finished good, hybrid humate-plus-microbe carriers that command 20-30% premiums, and regional expansion into Middle East and Southeast Asian markets where regulations are still evolving. Disruptors include compost-derived humic-substance start-ups selling at 20% discounts and microbial-consortia firms that deliver nitrogen fixation benefits. ESG scrutiny pressures miners to adopt renewable energy, water-recycling circuits, and third-party life-cycle analyses, raising barriers for entrants without capital or compliance acumen.
Humic Acid Industry Leaders
WestMET LLC
Humintech
HGS BioScience
The Andersons Inc.
Mineral Technologies Inc.
- *Disclaimer: Major Players sorted in no particular order

Recent Industry Developments
- June 2025: India's Ministry of Agriculture and Farmers Welfare rolled out the Fertilizer (Inorganic, Organic, or Mixed) (Control) Fourth Amendment Order, 2025. This new directive introduced explicit specifications for humic acid, fulvic acid, and seaweed-based biostimulants, delineating their composition, allowable ingredients, and suggested dosages tailored for different crops.
- December 2024: PT Bukit Asam Tbk (PTBA) teamed up with Universitas Gadjah Mada (UGM) to spearhead a research and development (R&D) initiative aimed at transforming low-calorific value coal into humic acid. The launch of the humic acid prototype took place at IUP Peranap in Indragiri Hulu, Riau. The duo plans to advance this prototype into a full-fledged pilot project.


Global Humic Acid Market Report Scope
Humic acid is a type of organic compound derived from coal, lignite (leonardite ore), soils, and organic materials. It plays a pivotal role in improving soil properties, mobilizing nutrients to promote plant growth, and enhancing the overall yield. Humic acid-based products are used as powder, granules, or liquid in organic fertilizers and animal feed. They are preferred due to their application in sustainable agriculture.
The humic acid market is segmented into form, application, and geography. By form, the market is segmented into powdered, granular, and liquid. By application, the market is segmented into organic fertilizers, animal feed, and other applications (industrial, water treatment, and specialty chemicals). The report also covers the market size and forecasts for the Humic Acid market in 27 major countries across various regions. For each segment, the market sizes and forecasts are provided on the basis of volume (tons).
| Powdered |
| Granular |
| Liquid |
| Organic Fertilizer |
| Animal Feed |
| Other Applications (Industrial, Water Treatment, and Specialty Chemicals) |
| Asia-Pacific | China |
| India | |
| Japan | |
| South Korea | |
| Indonesia | |
| Malaysia | |
| Thailand | |
| Vietnam | |
| Rest of Asia-Pacific | |
| North America | United States |
| Canada | |
| Mexico | |
| Europe | Germany |
| United Kingdom | |
| France | |
| Italy | |
| Spain | |
| Russia | |
| Turkey | |
| Nordic Countries | |
| Rest of Europe | |
| South America | Brazil |
| Argentina | |
| Colombia | |
| Rest of South America | |
| Middle East and Africa | Saudi Arabia |
| United Arab Emirates | |
| Qatar | |
| South Africa | |
| Nigeria | |
| Egypt | |
| Rest of Middle East and Africa |
| By Form | Powdered | |
| Granular | ||
| Liquid | ||
| By Application | Organic Fertilizer | |
| Animal Feed | ||
| Other Applications (Industrial, Water Treatment, and Specialty Chemicals) | ||
| By Geography | Asia-Pacific | China |
| India | ||
| Japan | ||
| South Korea | ||
| Indonesia | ||
| Malaysia | ||
| Thailand | ||
| Vietnam | ||
| Rest of Asia-Pacific | ||
| North America | United States | |
| Canada | ||
| Mexico | ||
| Europe | Germany | |
| United Kingdom | ||
| France | ||
| Italy | ||
| Spain | ||
| Russia | ||
| Turkey | ||
| Nordic Countries | ||
| Rest of Europe | ||
| South America | Brazil | |
| Argentina | ||
| Colombia | ||
| Rest of South America | ||
| Middle East and Africa | Saudi Arabia | |
| United Arab Emirates | ||
| Qatar | ||
| South Africa | ||
| Nigeria | ||
| Egypt | ||
| Rest of Middle East and Africa | ||


Key Questions Answered in the Report
What is the projected volume for global Humic Acid by 2031?
The Humic Acid market is expected to reach 1.18 million tons by 2031, growing at a 5.77% CAGR from 2026.
Which region will grow fastest in humic acid demand through 2031?
Asia-Pacific leads with a 7.22% CAGR, driven by India’s bio-input programs and China’s soil-health investments.
Why are liquid formulations gaining traction over powders?
Liquids integrate seamlessly with fertigation and foliar systems, offer higher efficacy per kilogram, and meet precision-agriculture needs.
How do carbon-credit schemes influence humic acid usage?
Verified soil-carbon gains allow farmers to monetize humic applications, turning the input into a revenue stream rather than a cost.
What major restraint affects large-scale adoption?
Limited mechanized application equipment for humic liquids hampers uniform field coverage in broad-acre farming.
Page last updated on:


