Fuel Tanker Services Market Size and Share
Market Overview
| Study Period | 2021 - 2031 |
|---|---|
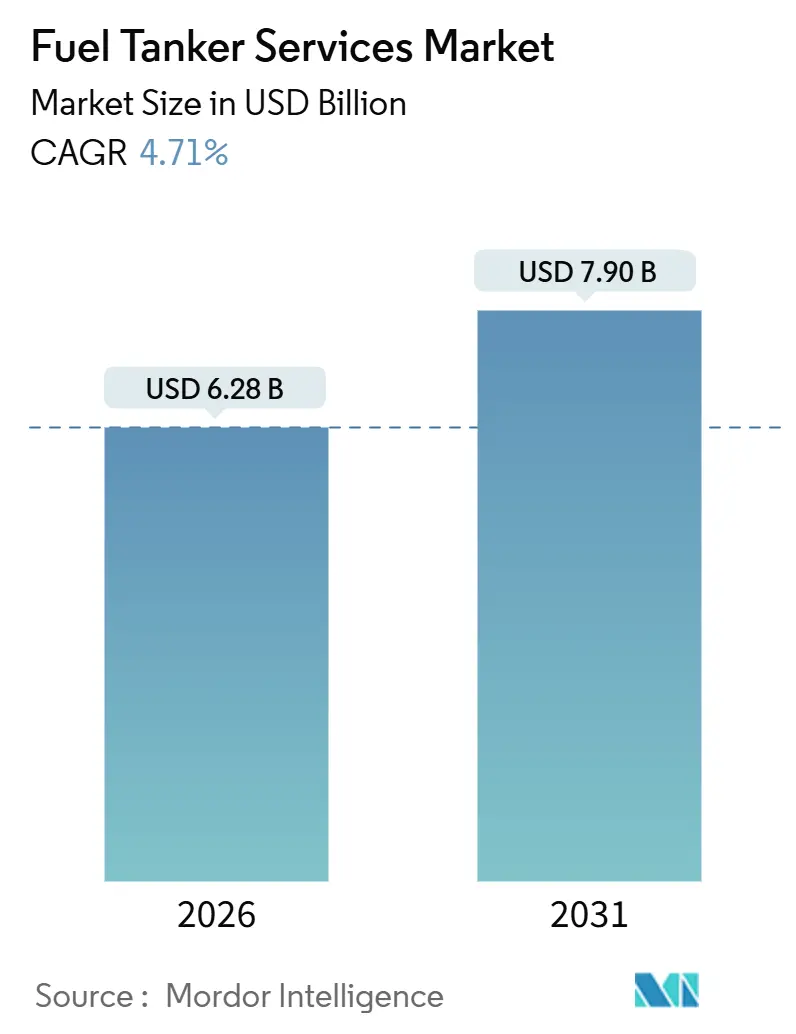
| Market Size (2026) | USD 6.28 Billion |
| Market Size (2031) | USD 7.90 Billion |
| Growth Rate (2026 - 2031) | 4.71% CAGR |
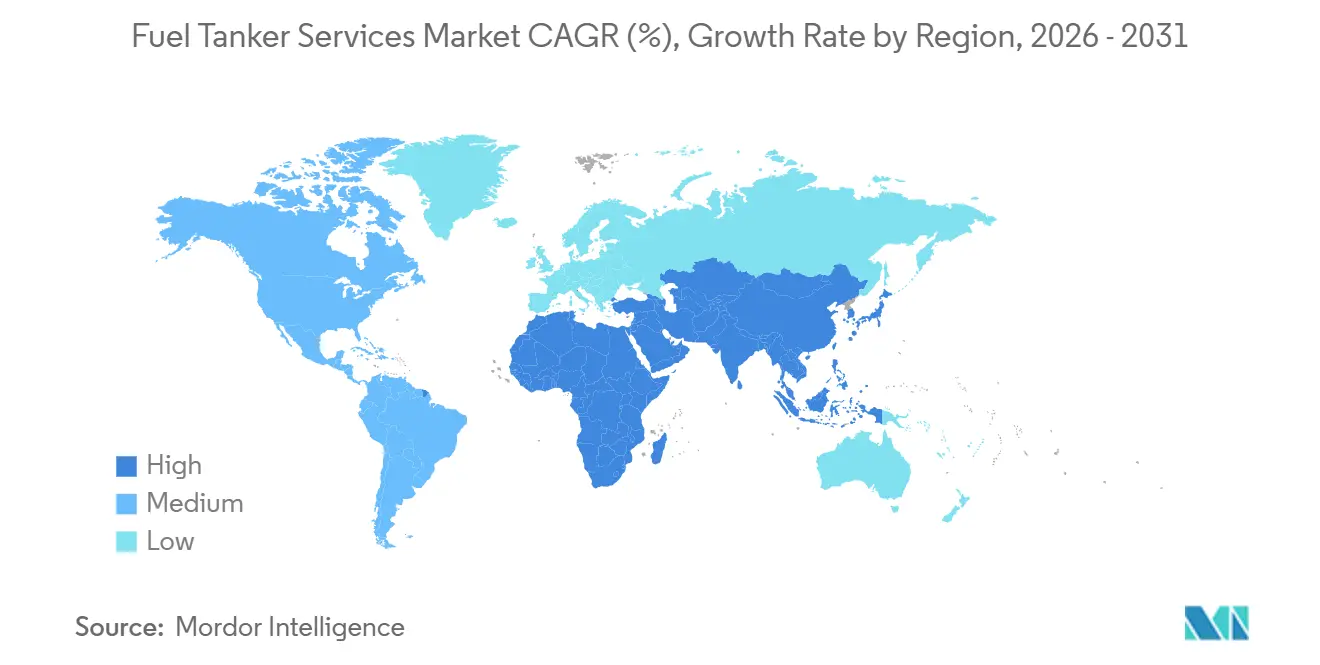
| Fastest Growing Market | Asia Pacific |
| Largest Market | Asia Pacific |
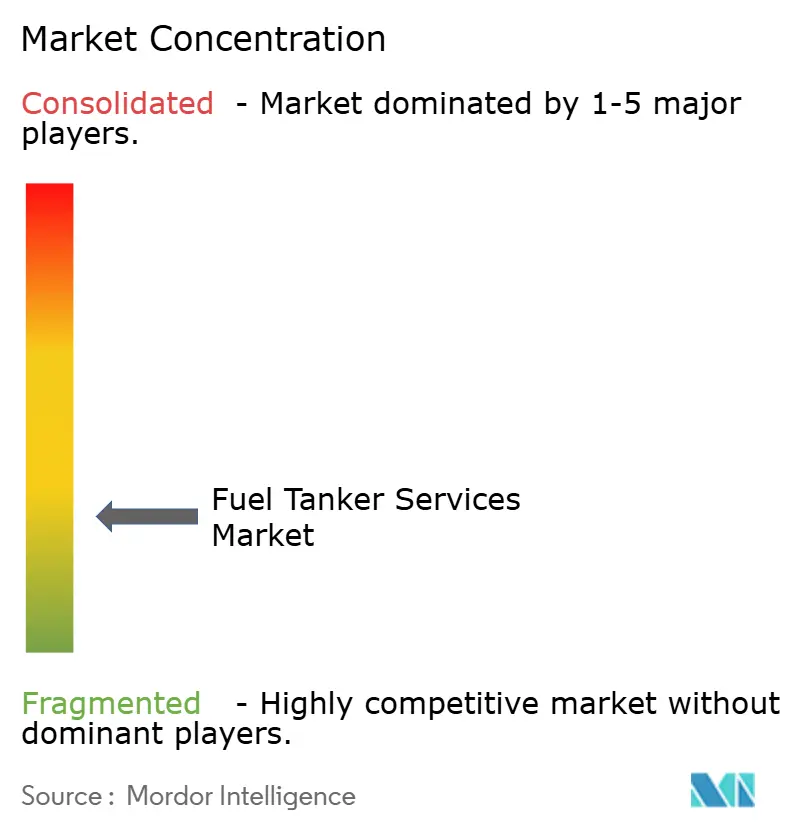
| Market Concentration | Low |
Major Players *Disclaimer: Major Players sorted in no particular order Image © Mordor Intelligence. Reuse requires attribution under CC BY 4.0. | |
Fuel Tanker Services Market Analysis by Mordor Intelligence
The Fuel Tanker Services Market size is estimated at USD 6.28 billion in 2026, and is expected to reach USD 7.90 billion by 2031, at a CAGR of 4.71% during the forecast period (2026-2031).
Growth stems from three structural tailwinds: the rollout of retail fuel stations in emerging economies, rising demand for mobile refueling at remote industrial sites, and biofuel-blend regulations that require specialized handling infrastructure.[1] Ministry of Petroleum and Natural Gas, India, “Monthly Fuel Retail Expansion Report,” mopng.gov.in Intensifying competition is prompting operators to deploy telematics for real-time load visibility, predictive maintenance, and route optimization, tools that cut empty miles and lower insurance premiums. At the same time, composite tanks that trim tare weight by 30–40% are gaining ground as fleets chase payload efficiency and corrosion resistance for ethanol blends above E15. Regional specialists remain well-positioned to win niche contracts in emergency response, aviation into-plane fueling, and defense logistics as global majors focus resources on LNG bunkering and blockchain-enabled fuel-tracking systems.
Key Report Takeaways
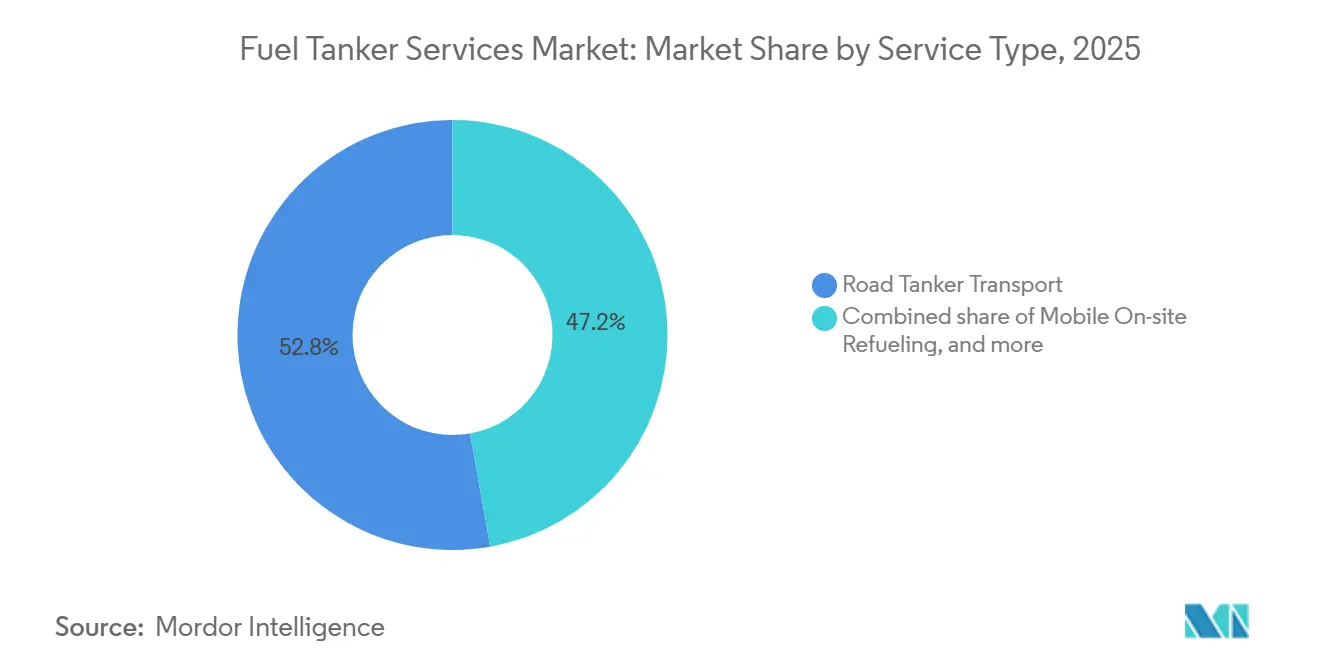
- By service type, road tanker transport led with 52.8% of fuel tanker services market share in 2025, while mobile on-site refueling is forecast to expand at a 7.9% CAGR to 2031.
- By material, carbon steel captured 60.1% share of the fuel tanker services market size in 2025; composite tanks are advancing at a 9.2% CAGR through 2031.
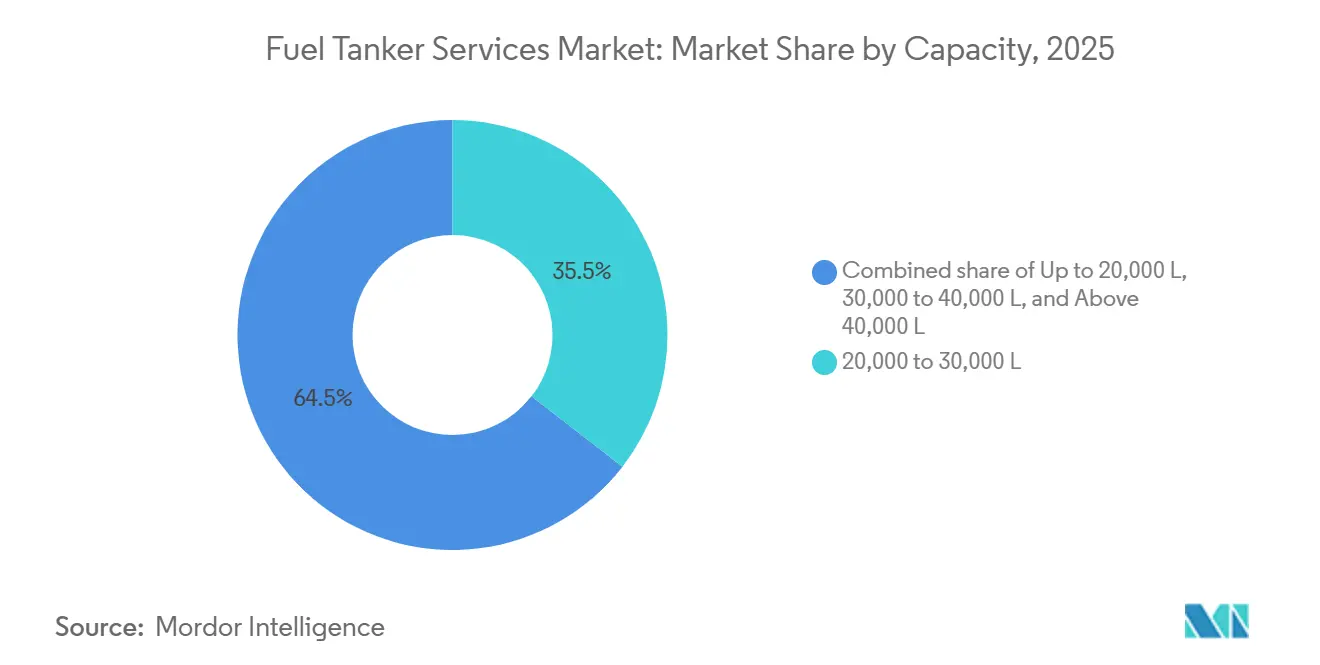
- By capacity, the 20,000–30,000-liter class held a 35.5% share in 2025, whereas the up-to-20,000-liter segment is set to grow at a 7.1% CAGR.
- By fuel type, diesel generated 39.9% revenue in 2025, yet the other segments (including biofuels, ethanol, and renewable diesel) will post a 9.7% CAGR to 2031.
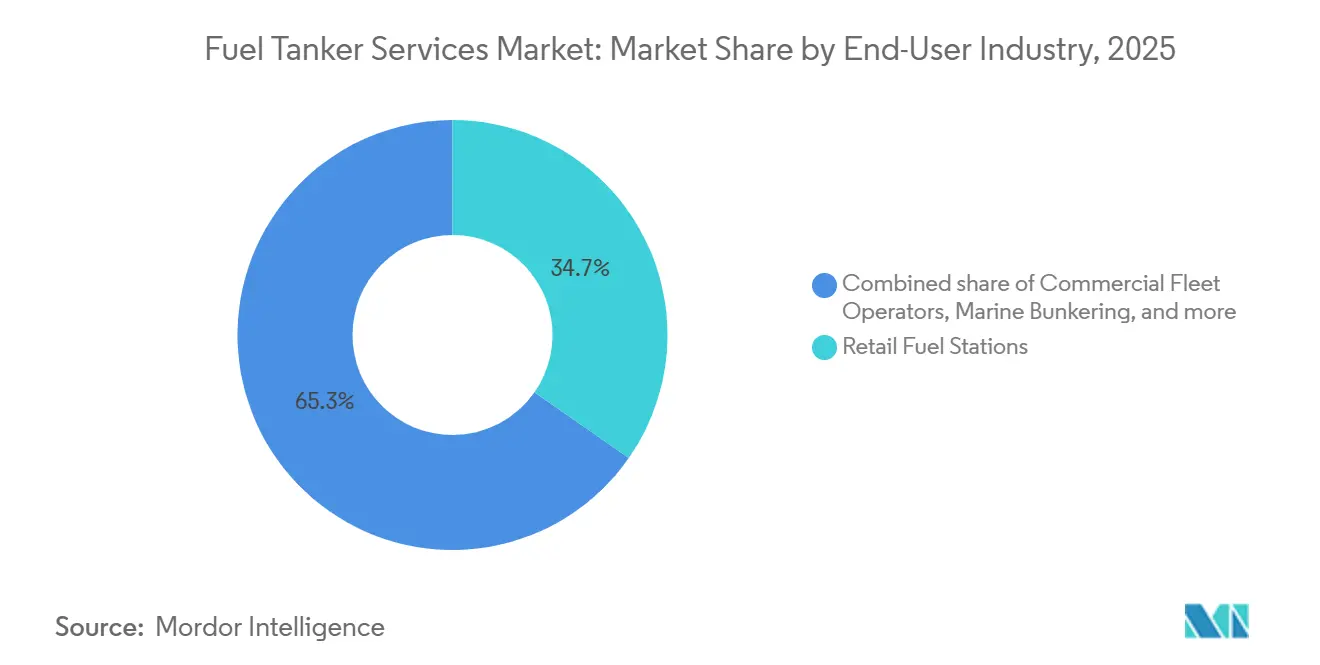
- By end-user, retail fuel stations commanded 34.7% in 2025, but marine bunkering is on track for an 8.3% CAGR through 2031.
- By region, Asia-Pacific contributed 33.6% revenue in 2025 and is projected to rise at a 6.4% CAGR, outpacing all other geographies.
Note: Market size and forecast figures in this report are generated using Mordor Intelligence’s proprietary estimation framework, updated with the latest available data and insights as of January 2026.
Global Fuel Tanker Services Market Trends and Insights
Drivers Impact Analysis*
| Driver | (~) % Impact on CAGR Forecast | Geographic Relevance | Impact Timeline |
|---|---|---|---|
| Expansion of retail fuel-station networks | +1.2% | Asia-Pacific core, spill-over to Middle East & Africa | Medium term (2-4 years) |
| Growth in commercial-vehicle freight demand | +0.9% | Global industrial corridors | Short term (≤ 2 years) |
| Heightened safety & compliance outsourcing | +0.7% | North America & Europe, emerging Asia-Pacific | Medium term (2-4 years) |
| On-site mobile refueling at remote operations | +1.0% | Mining zones and renewable-energy sites worldwide | Long term (≥ 4 years) |
| Biofuel-blend mandates | +0.8% | Americas and Europe | Medium term (2-4 years) |
| Source: Mordor Intelligence | |||
Expansion of Retail Fuel Station Networks in Emerging Markets
China added 3,200 retail outlets in 2025, lifting its network above 120,000 and stretching delivery routes into Tier-3 and Tier-4 cities. India is targeting 100,000 stations by 2028, intensifying demand for dense hub-and-spoke tanker operations that can navigate rural districts. Indonesia, Vietnam, and the Philippines mirror this trend, with Pertamina alone commissioning 1,400 sites in 2025 that rely on coastal bunkering relays and road-tanker last-mile supply. Saudi Arabia’s 2024 retail liberalization added 800 branded stations by end-2025, opening fresh contracts for international logistics providers. As networks disperse geographically, the fuel tanker services market pivots toward smaller, more frequent deliveries executed by 20,000-liter and sub-20,000-liter vehicles that can traverse narrow lanes and unpaved roads.
Growth in Commercial Vehicle Freight Demand
U.S. freight tonnage rose 3.8% year-over-year to 12.6 billion tons in 2025, keeping diesel demand high at fleet depots and distribution centers.[2]Bureau of Transportation Statistics, “Freight Transportation Services Index 2026,” bts.dot.gov China produced 4.2 million commercial vehicles that same year, including 1.8 million heavy-duty trucks, reinforcing Asia-Pacific’s status as the largest diesel consumer. Europe’s 2.4% uptick in road-freight volume came chiefly from e-commerce fulfillment, prompting fleet operators to outsource fuel logistics to specialists offering consolidated invoicing and telematics-enabled scheduling. Telematics suites deliver real-time inventory readings, shrinking administrative overhead and elevating customer retention. Collectively, these factors inject consistent lift into the fuel tanker services market even as alternative powertrains gain gradual traction.
Heightened Safety & Compliance Outsourcing to Specialists
The U.S. Pipeline and Hazardous Materials Safety Administration logged 1,240 fuel-tanker incidents in 2025, triggering stricter enforcement of 49 CFR Part 177 rules. Retail chains and fleet operators now outsource to logistics partners certified under ISO 9001 and ISO 45001, shifting liability for training and maintenance. Europe’s ADR update in January 2025 mandated pressure-relief devices and shut-offs that raise capital costs for owner-operators, nudging them toward consolidation.[3]United Nations Economic Commission for Europe, “ADR 2025 Amendments,” unece.org Insurers offer 10–15% premium discounts for fleets running collision-avoidance systems, further encouraging technology adoption. Multinationals operating in China and India increasingly demand ISO 28000 validation, favoring established players with documented security protocols.
On-Site Mobile Refueling Demand at Remote Operations
BHP’s Pilbara mines consumed 450 million liters of diesel in 2025 and sourced 35% via mobile tankers that bypassed storage-tank permitting hurdles. Ørsted’s offshore wind projects adopted similar strategies, refueling vessels at sea and skipping congested ports. Brazil’s Cerrado farms and Argentina’s Pampas likewise engage mobile services during planting and harvest, when timely diesel deliveries protect crop yields. The U.S. Defense Logistics Agency awarded USD 1.2 billion in mobile contracts, underscoring military reliance on just-in-time supply. Such contracts sustain robust margins and reinforce the long-term growth profile of the fuel tanker services market.
Restraints Impact Analysis*
| Restraint | (~) % Impact on CAGR Forecast | Geographic Relevance | Impact Timeline |
|---|---|---|---|
| Zero-emission truck penetration | -0.8% | North America & Europe, coastal China | Medium term (2-4 years) |
| Oil-price volatility | -0.5% | Global, acute in emerging markets | Short term (≤ 2 years) |
| Tighter diesel-emission rules | -0.6% | Europe, North America, China | Short term (≤ 2 years) |
| Driver shortages & high insurance premiums | -0.7% | North America & Europe | Medium term (2-4 years) |
| Source: Mordor Intelligence | |||
Accelerating Penetration of Zero-Emission Trucks
Battery-electric truck sales hit 14,200 units in the United States for 2025, equivalent to 4.6% of Class 8 sales, and California requires 40% zero-emission truck sales by 2032. Europe now enforces a 45% CO₂ reduction for heavy-duty fleets by 2030, while China recorded 89,000 new-energy commercial-vehicle registrations in 2025. Although long-haul diesel remains dominant, growing urban electric adoption erodes demand for conventional tanker deliveries along dense corridors. Tesla’s Semi and Volvo’s FM Electric platforms extend ranges past 500 miles, shrinking refueling events in regional logistics applications. As charging infrastructure proliferates, the fuel tanker services market must diversify into LNG, hydrogen, and renewable diesel to offset diesel attrition.
Driver Shortages & Soaring Insurance Premiums
The United States posted a 78,000-driver shortfall in 2025 and may see 160,000 vacancies by 2031, with hazmat-certified tanker drivers especially scarce.[4]American Trucking Associations, “Driver Shortage Report 2026,” trucking.org Commercial auto insurance for tank fleets rose 18–22% in 2025 owing to costly nuclear verdicts, squeezing smaller operators. Europe faces a deficit of 500,000 drivers, compelling fleets to raise wages and sign-on bonuses. Australia’s proposed chain-of-responsibility rules spread liability to shippers, elevating compliance costs and favoring vertically integrated logistics providers. Consolidation accelerates as sub-scale carriers sell to larger rivals able to absorb rising premiums and invest in driver retention.
*Our forecasts treat driver/restraint impacts as directional, not additive. The impact forecasts reflect baseline growth, mix effects, and variable interactions.
Segment Analysis
By Service Type: Mobile Refueling Outpaces Traditional Transport
Road Tanker Transport generated 52.8% of the fuel tanker services market revenue in 2025, but is expanding only modestly as pipeline networks mature in developed economies. Mobile On-site Refueling, rising at a 7.9% CAGR, capitalizes on mining, construction, and agricultural clients that value uptime over static storage infrastructure. Emergency fuel response deployments during the 2025 Atlantic hurricane season surpassed 120 million liters, reinforcing demand for rapid-response fleets. Long-term fuel supply contracts from the U.S. Defense Logistics Agency provide predictable cash flows that attract private-equity capital, demonstrating that service diversification underpins resilience in the fuel tanker services market.
Mobile refueling’s adoption curve is further supported by ISO 9001 and ISO 45001 certifications that reassure corporate procurement teams. Specialized pickup-truck-based tankers reach confined construction sites where conventional semi-trailers cannot maneuver. Telematics-equipped Road Tanker operators, meanwhile, enhance asset utilization and cut insurance premiums, though their growth remains tethered to mature urban distribution loops. As a result, service-mix realignment favors agile operators that can switch capacity between long-haul depot replenishment and last-mile on-site fueling.


By Material Type: Composite Tanks Gain Ground
Carbon Steel retained 60.1% share of the fuel tanker services market in 2025, owing to low acquisition costs and widespread repair know-how. Stainless Steel holds an 18% niche in aviation and pharmaceutical-grade fuels that demand purity. Aluminum Alloy’s 12% share reflects weight-saving advantages in Europe’s chemical logistics despite stress-corrosion limits. Composite Tanks, projected to expand at a 9.2% CAGR through 2031, secure orders from fleets handling ethanol blends above E15, driven by their corrosion immunity and 30–40% weight cuts.
The 2025 update to 49 CFR Part 178 introduced tougher crashworthiness thresholds that composite shells can meet with thinner walls, reducing tare while complying with safety mandates. Europe’s ADR now accepts composites after rigorous drop-test and fire-resistance trials, unlocking new addressable volume. Adoption barriers remain - higher upfront cost and scarce repair facilities - but total-cost-of-ownership gains are narrowing payback periods, tilting procurement toward advanced materials within the fuel tanker services market.
By Capacity: Urbanization Favors Smaller Tankers
The 20,000–30,000-liter segment controlled 35.5% of 2025 revenue, matching urban retail station throughput where axle-weight limits and turning radii constrain larger rigs. The Up-to-20,000-liter class will rise at a 7.1% CAGR to 2031, fueled by mobile refueling vans serving building sites and farms that lack fixed infrastructure. Vehicles exceeding 40,000 liters comprise just 12% of deployments, confined largely to interstate corridors in North America and Australia that permit higher gross vehicle weights.
China’s Tier-1 cities average one station per 8,000 residents, driving a rotation toward high-frequency, low-volume deliveries executed by compact tankers. The European Union’s low-emission zones restrict access for older, high-capacity diesels, accelerating fleet renewal with Euro VI-E-compliant mid-sizes. Multi-compartment designs in the 30,000–40,000-liter bracket let carriers deliver gasoline, diesel, and ethanol on a single route, raising utilization and mitigating deadhead runs. Through 2031, the skew toward smaller vehicles entrenches a structural shift in the equipment mix across the fuel tanker services market.
By Fuel Type: Biofuels Drive Fastest Growth
Diesel delivered 39.9% revenue in 2025 but faces incremental share loss as zero-emission fleets take root. Gasoline captured 28% yet grows modestly, echoing plateauing passenger-car sales in mature markets. LNG/CNG’s 12% slice reflects state incentives and abundant gas supply in China, the United States, and the Gulf. Aviation fuels secured 11% amid a post-pandemic air-travel rebound, offering stable, high-margin into-plane contracts. The Others category (including biofuels, ethanol, renewable diesel, and hydrogen) will log a 9.7% CAGR, the strongest within the fuel tanker services market, propelled by mandates such as the U.S. 22.68-billion-gallon RFS quota and Europe’s RED II targets.
Neste’s Singapore refinery exported 1.5 billion gallons of renewable diesel to U.S. West Coast markets in 2025, catalyzing specialized tanker demand for California’s Low Carbon Fuel Standard compliance. Singapore’s LNG bunkering hit 6.8 million tonnes, validating tanker investment in cryogenic fuel supply chains. Air Liquide deployed 12 hydrogen tankers across France and Germany, an early indicator of future diversification.
By End-User Industry: Marine Bunkering Surges
Retail fuel stations held 34.7% of 2025 revenue, yet growth moderates outside Asia-Pacific as station counts plateau. Commercial fleet operators own 22% and are consolidating procurement via telematics-integrated platforms that favor carriers offering bundled billing. Mining and construction maintain 14%, leveraging mobile refueling to bypass environmental permitting for on-site tanks. Agriculture’s 9% share is seasonal, demanding flexible capacity planning from carriers. Aviation contributes 8% through into-plane contracts, led by a USD 320 million, five-year award at 14 Indian airports to World Fuel Services. Marine bunkering, only 7% today, will race ahead at an 8.3% CAGR, driven by IMO sulfur caps and growing LNG adoption at ports such as Singapore, Rotterdam, and Fujairah.
Power generation, utilities, and defense together account for the balance, with diesel genset backup and military logistics sustaining a consistent baseline demand. Overall, end-user diversification buffers cyclicality and sustains volume resilience in the fuel tanker services market.
Geography Analysis
Asia-Pacific anchored 33.6% of global 2025 revenue and will grow at a 6.4% CAGR, supported by China’s 3,200-station expansion and India’s march toward 100,000 sites by 2028. ASEAN buildouts, led by Pertamina’s 1,400 new Indonesian stations, require coastal-road relay logistics that favor regional specialists. South Korea fields 45,000 LNG trucks that depend on cryogenic tankers, while Australia’s Pilbara mines rely on mobile refueling for 450 million liters of annual diesel consumption.
North America and Europe jointly held 42% in 2025 but progress more slowly as retail networks mature and zero-emission trucks nibble diesel volumes. U.S. freight tonnage reached 12.6 billion tons, locking in demand for depot refueling, yet insurance surges and driver shortages spark consolidation. Europe’s ADR 2025 update raises compliance costs by up to 12%, accelerating fleet renewal and mergers, as evidenced by the U.K. Competition and Markets Authority’s approval of a regional tie-up. Canada’s northern mines and Mexico’s post-reform retail sector inject upside despite wider regional maturity.
The Middle East and Africa captured 15% in 2025, with Saudi Arabia’s liberalized fuel retail adding 800 new stations and ADNOC Distribution targeting 1,000 outlets by 2028. South Africa introduced 10 ppm diesel, necessitating tanker upgrades and cleaning procedures. South America contributed 10%, propelled by Brazil’s 35 billion-liter ethanol movement and Argentina’s 1.8 million-tonne biodiesel exports. Across these geographies, heterogeneous regulatory regimes and infrastructure maturity levels ensure that localized strategies remain central to success in the fuel tanker services market.

Competitive Landscape
The top five suppliers, Kenan Advantage Group, Hoyer Group, World Fuel Services, Shell Trading & Shipping, and BP Global Tanker Logistics, controlled roughly 28% of 2025 revenue, leaving ample headroom for regional challengers. Technology is the new competitive frontier: World Fuel Services deployed a blockchain ledger to guarantee custody transparency, winning long-term aviation and marine contracts. Hoyer Group integrated AI-based predictive maintenance across a 2,800-vehicle European fleet, targeting a 15% downtime reduction.
Private-equity funds are accelerating consolidation, exemplified by a 2025 buyout of a 120-vehicle Texas carrier aiming to scale via telematics and regional bolt-ons. Tanker OEMs, advanced-materials firms, and digital freight brokers partner with fleet operators to co-develop composite shells, telematics dashboards, and capacity-matching platforms. TotalEnergies’ LNG bunkering debut at Marseille, underpinned by an existing refinery-logistics footprint, highlights how integrated oil majors leverage asset synergies to disrupt niche segments.
Insurance cost inflation and driver scarcity accelerate exits by sub-scale firms, compressing competitive fragmentation. Yet heterogeneous regulations and localized demand, such as emergency response in hurricane belts, ethanol hauling in Brazil, and cryogenic hydrogen in northern Europe, continue to offer fertile ground for specialists, ensuring that the fuel tanker services market remains low in concentration.
Fuel Tanker Services Industry Leaders
Kenan Advantage Group Inc.
Hoyer Group GmbH
Imperial Logistics – Tanker Services
CLH Group
Certas Energy UK Ltd
- *Disclaimer: Major Players sorted in no particular order

Recent Industry Developments
- December 2025: The Indian government has greenlit the acquisition of six aerial refuelling aircraft for the Indian Air Force (IAF). The programme involves converting used Boeing 767 airframes into multi-role tanker transport aircraft, set to replace the IAF's ageing IL-78 fleet. Israel Aerospace Industries (IAI), in collaboration with Hindustan Aeronautics Limited (HAL), will oversee the conversion work.
- December 2025: AVG Logistics Limited and Baidyanath LNG Private Limited have inked a Memorandum of Understanding (MoU) to boost the use of Liquefied Natural Gas (LNG) in transportation.
- November 2025: Front End Limited Company, in collaboration with US-based Booster Fuels, has inked a Memorandum of Understanding (MoU) to roll out mobile fuel delivery services in Saudi Arabia. The initiative kicks off with a pilot program in Dammam.
- February 2025: OilMaxx, a fuel solutions provider, has unveiled a cutting-edge mobile fuel delivery service tailored for small volumes. Centered on delivering small quantities of HVO white and DERV, OilMaxx Express is dedicated to ensuring businesses operate seamlessly around the clock.


Global Fuel Tanker Services Market Report Scope
Fuel tankers are specialized vehicles designed to transport large quantities of fuel, such as gasoline, diesel, or aviation fuel. These tankers are a crucial component of the energy industry's supply chain, ensuring that fuel is efficiently and safely transported from refineries to distribution centers, commercial facilities, and retail outlets.
The global fuel tanker services market is segmented by service type, material type, capacity, fuel type, end-user industry, and geography. By service type, the market is segmented into road tanker transport, mobile on-site refueling, emergency fuel response, and fuel supply and logistics contracting. By material type, the market is segmented into carbon steel, stainless steel, aluminum alloy, and composite tanks. By capacity, the market is segmented by up to 20,000 L, 20,000 to 30,000 L, 30,000 to 40,000 L, and above 40,000 L. By fuel type, the market is segmented into gasoline, diesel, LNG/CNG, aviation fuel, and others. By end-user industry, the market is segmented by retail fuel stations, commercial fleet operators, mining and construction, agriculture, aviation and airports, marine bunkering, power generation and utilities, and defense. The report also covers the market size and forecasts for the fuel tanker services market across major regions. For each segment, the market sizing and forecasts were made based on revenue (USD).
| Road Tanker Transport |
| Mobile On-site Refueling |
| Emergency Fuel Response |
| Fuel Supply and Logistics Contracting |
| Carbon Steel |
| Stainless Steel |
| Aluminum Alloy |
| Composite Tank |
| Up to 20,000 L |
| 20,000 to 30,000 L |
| 30,000 to 40,000 L |
| Above 40,000 L |
| Gasoline |
| Diesel |
| LNG/CNG |
| Aviation Fuel |
| Others (Biofuels, Ethanol, etc.) |
| Retail Fuel Stations |
| Commercial Fleet Operators |
| Mining and Construction |
| Agriculture |
| Aviation and Airports |
| Marine Bunkering |
| Power Generation and Utilities |
| Defense |
| North America | United States |
| Canada | |
| Mexico | |
| Europe | Germany |
| United Kingdom | |
| France | |
| Italy | |
| Spain | |
| NORDIC Countries | |
| Russia | |
| Rest of Europe | |
| Asia-Pacific | China |
| India | |
| Japan | |
| South Korea | |
| ASEAN Countries | |
| Australia and New Zealand | |
| Rest of Asia-Pacific | |
| South America | Brazil |
| Argentina | |
| Colombia | |
| Rest of South America | |
| Middle East and Africa | Saudi Arabia |
| United Arab Emirates | |
| South Africa | |
| Egypt | |
| Rest of Middle East and Africa |
| By Service Type | Road Tanker Transport | |
| Mobile On-site Refueling | ||
| Emergency Fuel Response | ||
| Fuel Supply and Logistics Contracting | ||
| By Material Type | Carbon Steel | |
| Stainless Steel | ||
| Aluminum Alloy | ||
| Composite Tank | ||
| By Capacity | Up to 20,000 L | |
| 20,000 to 30,000 L | ||
| 30,000 to 40,000 L | ||
| Above 40,000 L | ||
| By Fuel Type | Gasoline | |
| Diesel | ||
| LNG/CNG | ||
| Aviation Fuel | ||
| Others (Biofuels, Ethanol, etc.) | ||
| By End-User Industry | Retail Fuel Stations | |
| Commercial Fleet Operators | ||
| Mining and Construction | ||
| Agriculture | ||
| Aviation and Airports | ||
| Marine Bunkering | ||
| Power Generation and Utilities | ||
| Defense | ||
| By Geography | North America | United States |
| Canada | ||
| Mexico | ||
| Europe | Germany | |
| United Kingdom | ||
| France | ||
| Italy | ||
| Spain | ||
| NORDIC Countries | ||
| Russia | ||
| Rest of Europe | ||
| Asia-Pacific | China | |
| India | ||
| Japan | ||
| South Korea | ||
| ASEAN Countries | ||
| Australia and New Zealand | ||
| Rest of Asia-Pacific | ||
| South America | Brazil | |
| Argentina | ||
| Colombia | ||
| Rest of South America | ||
| Middle East and Africa | Saudi Arabia | |
| United Arab Emirates | ||
| South Africa | ||
| Egypt | ||
| Rest of Middle East and Africa | ||


Key Questions Answered in the Report
How fast will the fuel tanker services market grow through 2031?
The market is expected to advance at a 4.71% CAGR, rising from USD 6.28 billion in 2026 to USD 7.90 billion by 2031.
Which service type is expanding the quickest?
Mobile On-site Refueling is projected to post a 7.9% CAGR as miners, builders, and farmers favor just-in-time delivery.
Why are composite tanks attracting investment?
They cut tare weight by up to 40%, boost payload, and resist ethanol corrosion, helping fleets meet stricter crashworthiness rules.
Which region offers the strongest near-term upside?
Asia-Pacific, led by China and India, is forecast at a 6.4% CAGR due to rapid fuel-station buildouts and commercial-vehicle growth.
What is driving marine bunkering demand?
IMO sulfur caps and LNG adoption at major ports are pushing marine bunkering volumes, yielding an 8.3% CAGR outlook.
How are fleets addressing driver shortages?
Carriers raise wages, deploy advanced driver-assistance systems, and integrate telematics to improve safety and retention amid a 78,000-driver U.S. deficit.
Page last updated on:


