Market Overview
| Study Period | 2021 - 2031 |
|---|---|
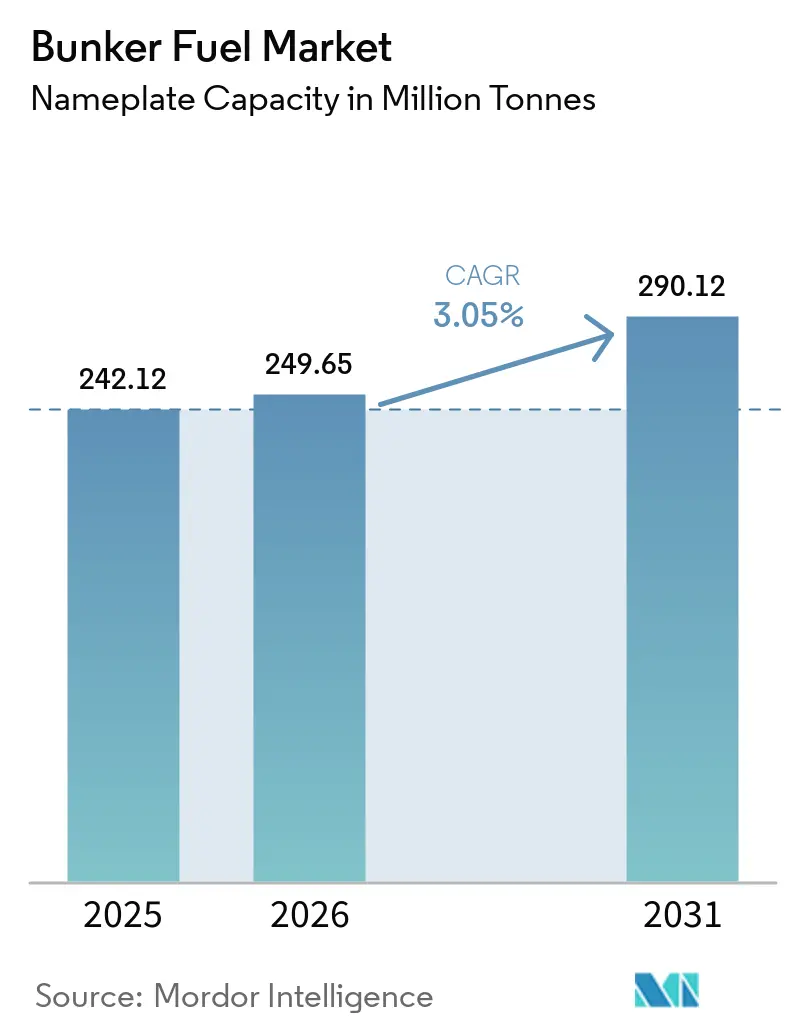
| Market Volume (2026) | 249.65 Million tonnes |
| Market Volume (2031) | 290.12 Million tonnes |
| Growth Rate (2026 - 2031) | 3.05% CAGR |
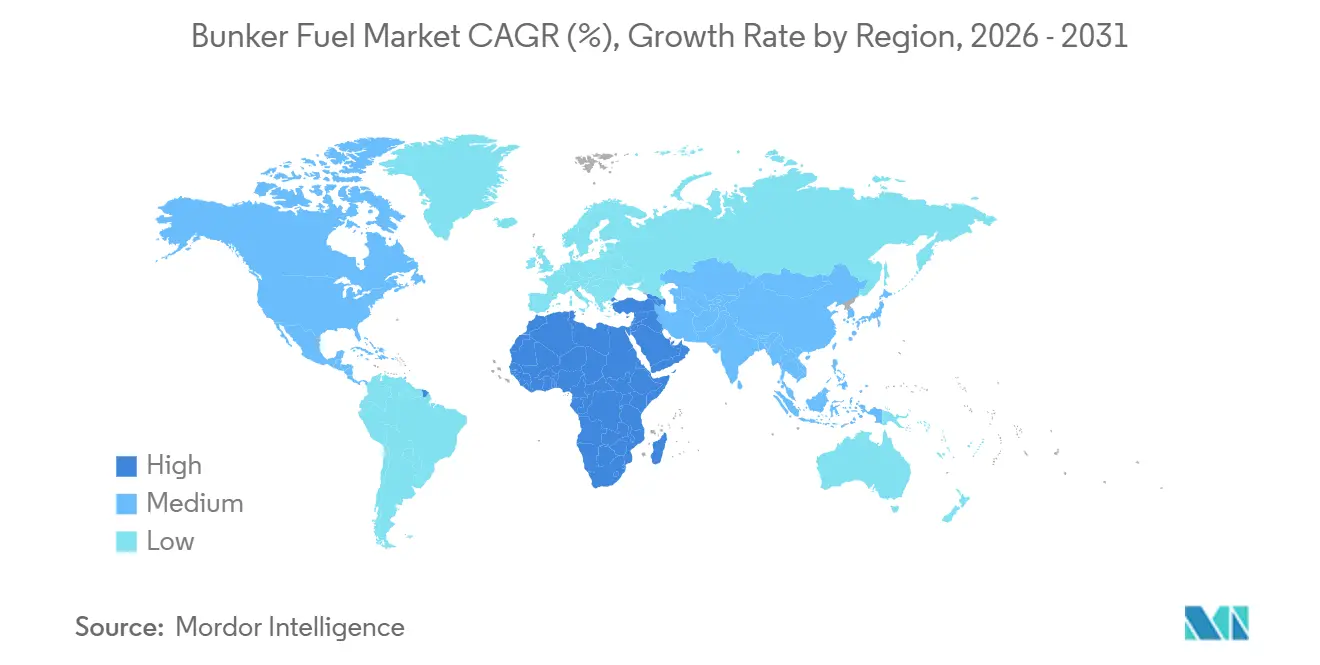
| Fastest Growing Market | Middle East and Africa |
| Largest Market | Asia-Pacific |
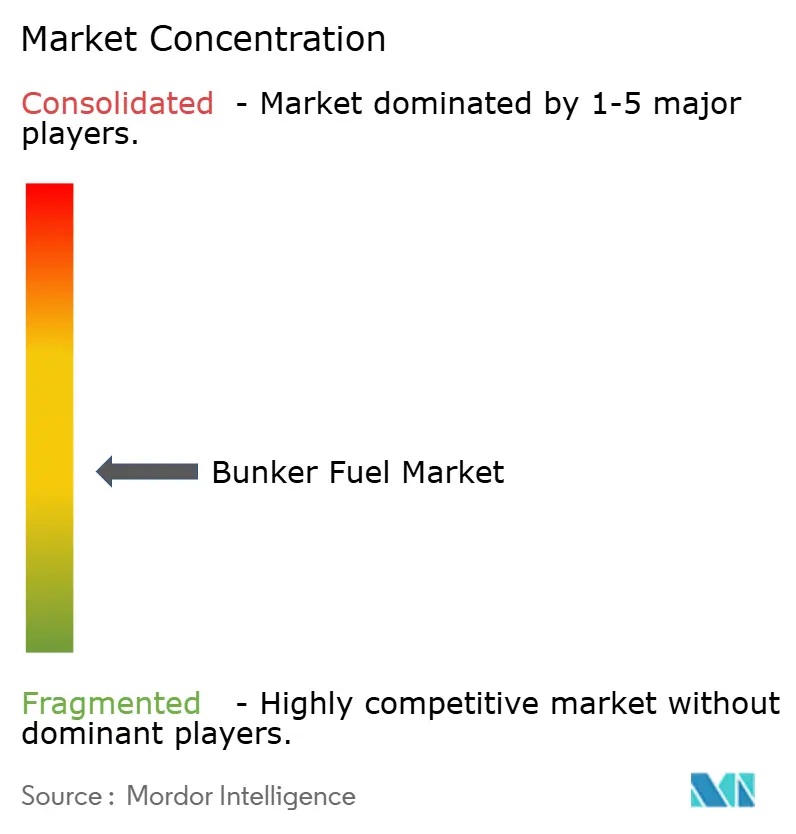
| Market Concentration | Medium |
Major Players *Disclaimer: Major Players sorted in no particular order Image © Mordor Intelligence. Reuse requires attribution under CC BY 4.0. | |
Bunker Fuel Market Analysis by Mordor Intelligence
The Bunker Fuel Market size in terms of nameplate capacity was valued at 242.12 million tonnes in 2025 and is estimated to grow from 249.65 million tonnes in 2026 to reach 290.12 million tonnes by 2031, at a CAGR of 3.05% during the forecast period (2026-2031).
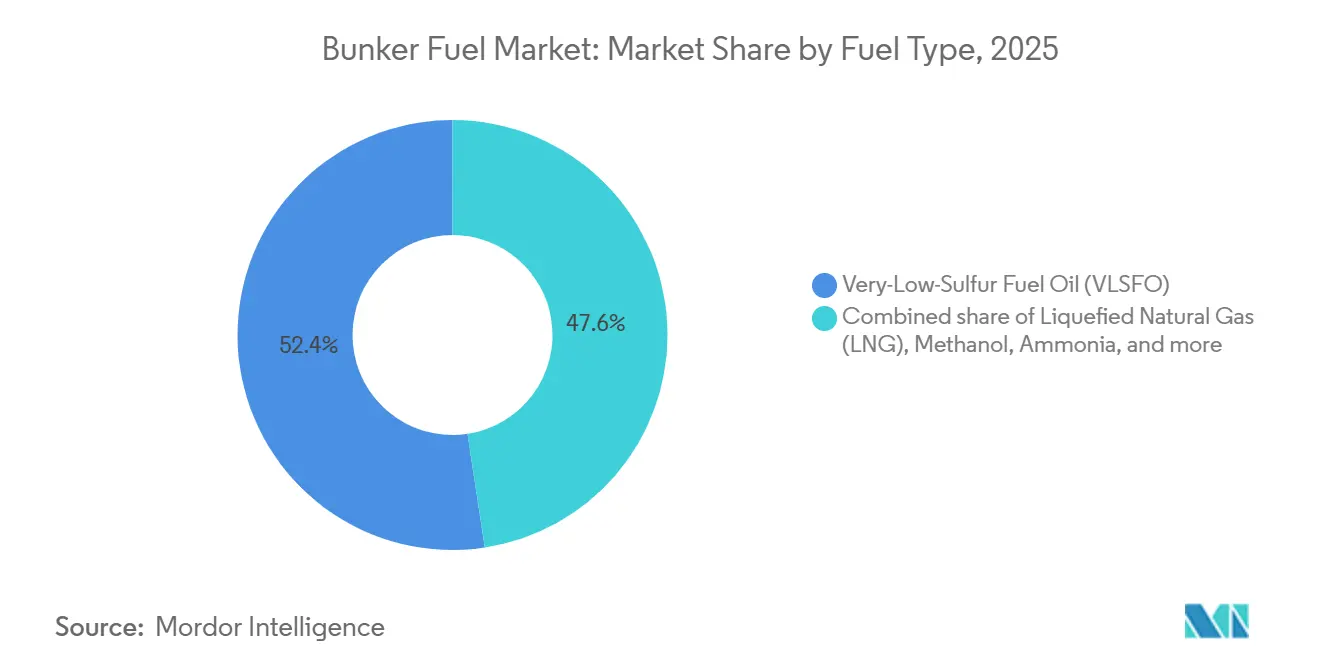
Supply is tilting toward cleaner grades as Very-Low-Sulfur Fuel Oil (VLSFO) retained a 52.4% bunker fuel market share in 2025, yet Liquefied Natural Gas (LNG) is scaling rapidly on the back of a 31.6% forecast growth that is spurring wholesale changes in vessel design and port infrastructure.[1]Jonathan Saul, “LNG-Fuelled Ships Surge as Shipping Seeks Cleaner Fuels,” Reuters, reuters.com Asia-Pacific anchored 44.7% of global volume, benefiting from heavy container flows through Singapore and Chinese gateways, while the Middle East and Africa will register the fastest regional growth at 3.5% as Fujairah and Saudi terminals target Red Sea and Suez diversions.[2]Tan Weizhen, “Singapore Expands LNG Bunkering Fleet,” Bloomberg, bloomberg.com Competitive intensity remains moderate: integrated majors such as Shell, TotalEnergies, and BP control roughly half of physical supply through long-term port concessions, yet independent traders use flexible delivery windows and bio-fuel blends to capture margins and help owners hit Carbon Intensity Indicator (CII) targets. Regulation is the key swing factor. FuelEU Maritime’s greenhouse-gas mandate and expanding Emission Control Areas (ECAs) tighten sulfur and carbon limits, accelerating demand for portfolio strategies that mix VLSFO, LNG, methanol, and emerging ammonia.
Key Report Takeaways
- By fuel type, Very-Low-Sulfur Fuel Oil captured 52.4% of bunker fuel market share in 2025, while Liquefied Natural Gas is set to expand at a 31.6% CAGR through 2031.
- By bunkering method, ship-to-ship transfers led with 39.9% share in 2025; LNG barge-to-ship operations are forecast to advance at a 30.1% CAGR to 2031.
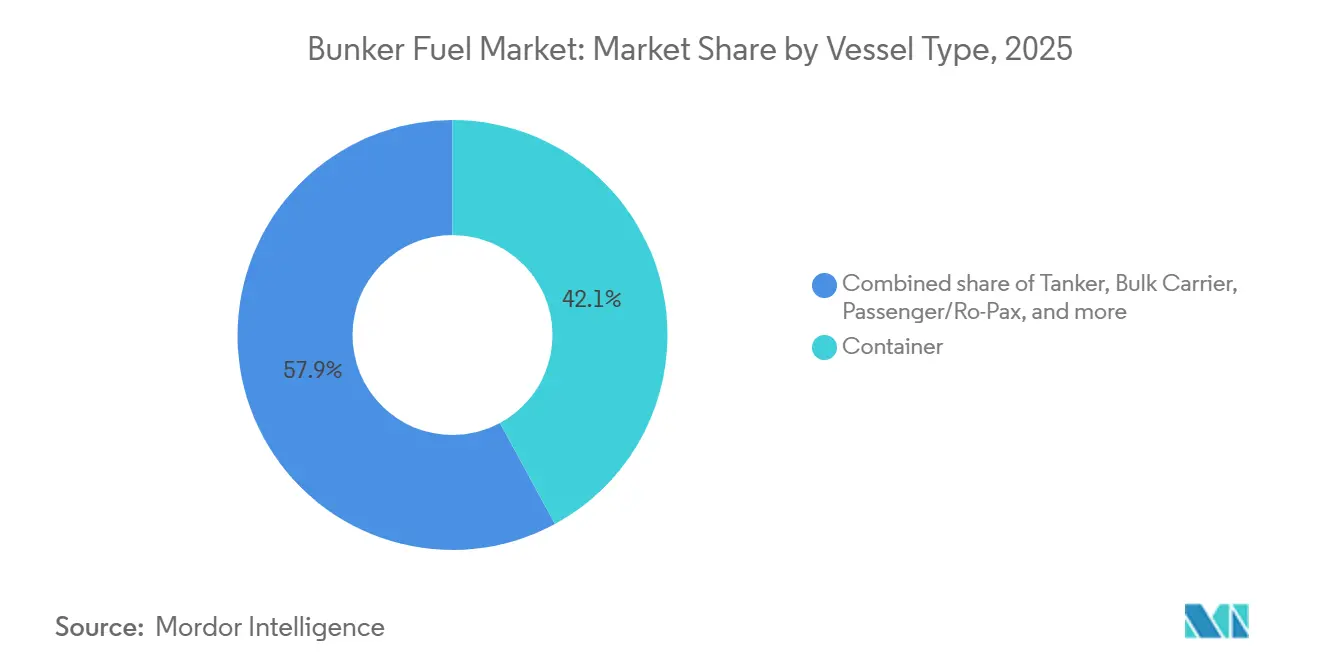
- By vessel type, container vessels accounted for 42.1% of the bunker fuel market size in 2025, whereas passenger and Ro-Pax fleets are growing at a 5.3% CAGR toward 2031.
- By geography, Asia-Pacific dominated with 44.7% volume in 2025, while the Middle East and Africa region is projected to post a 3.5% CAGR through 2031.
- Shell, TotalEnergies, and BP together controlled about 50% of the bunker fuel market share in 2025, underscoring a moderately concentrated supplier base.
Note: Market size and forecast figures in this report are generated using Mordor Intelligence’s proprietary estimation framework, updated with the latest available data and insights as of January 2026.
Global Bunker Fuel Market Trends and Insights
Drivers Impact Analysis*
| Driver | (~) % Impact on CAGR Forecast | Geographic Relevance | Impact Timeline |
|---|---|---|---|
| IMO 2020 enforcement & ECA expansion | 0.80% | Global, acute in North America, EU, APAC ECAs | Medium term (2-4 years) |
| Rapid growth in LNG-fuelled fleet orders | 1.20% | Global, led by APAC shipyards and European ferries | Long term (≥4 years) |
| Surging APAC seaborne trade volumes | 0.60% | Asia-Pacific core, spillover to Middle East hubs | Short term (≤2 years) |
| Scrubber retrofits sustaining HSFO demand | 0.30% | Global, concentrated in container and bulk carriers | Short term (≤2 years) |
| Green-corridor initiatives accelerating ammonia & methanol bunkering | 0.40% | North America & EU pilots, early APAC uptake | Long term (≥4 years) |
| AI-driven fuel-route optimization cutting wastage | 0.20% | Global, fastest among liner and tanker fleets | Medium term (2-4 years) |
| Source: Mordor Intelligence | |||
IMO 2020 Enforcement & ECA Expansion
Strict sulfur caps that began in 2020 continue to steer fleet owners toward compliant fuels. Detentions for non-compliant sulfur levels rose in Rotterdam and Singapore during 2025, pushing suppliers to install real-time testing at loading points. FuelEU Maritime layers carbon-intensity targets on top of sulfur limits, so operators now juggle VLSFO for short runs, LNG for new-builds, and bio-fuel blends for mid-life tonnage.[3]European Commission, “FuelEU Maritime,” ec.europa.eu Classification societies recorded 638 LNG-powered vessels on the water in 2024, with the orderbook pointing to 1,200 units by 2028, confirming that compliance has shifted from simple fuel switching to fleet renewal. ECAs in the Mediterranean and parts of Southeast Asia are widening, which narrows the economic case for high-sulfur grades outside scrubber-equipped fleets. As enforcement tightens, predictable demand for low-sulfur options anchors the bunker fuel market, yet the added carbon layer accelerates diversification toward methanol and ammonia.
Rapid Growth in LNG-Fuelled Fleet Orders
LNG secured around 70% of alternative-fuel vessel contracts placed during 2024, reflecting proven engine reliability and up to 25% lower well-to-wake CO₂ emissions versus VLSFO.[4]SEA-LNG, “Bio-LNG: Pathway to Net Zero,” sea-lng.org Hyundai Heavy Industries and China State Shipbuilding Corporation together hold more than 100 LNG-ready container and bulk carrier orders that will deliver between 2026 and 2029. European ferry operators are retrofitting Ro-Pax units to LNG, supported by discounted berthing fees in Norway and Germany that reward lower-emission vessels. Cruise lines mirror the trend; Carnival Corporation’s LNG ship orders align with passenger demand for greener itineraries. Engine lead times now stretch to 18 months, prompting owners to secure manufacturing slots ahead of final hull contracts, signaling confidence in LNG despite emerging debate over methane slip.
Surging APAC Seaborne Trade Volumes
Shanghai handled 49.16 million TEU in 2024, an 8.5% jump that underscores Asia-Pacific’s dominance in container flows and bunker liftings. Intra-Asian feeder routes support steady VLSFO uptake because smaller vessels lack LNG tank capacity. Red Sea security issues diverted Asia-Europe traffic around the Cape of Good Hope through 2025, adding 10-14 days per voyage and boosting fuel burn by roughly 30% on those rotations. India’s coastal shipping reforms opened cabotage to foreign-flagged tonnage on select lanes, lifting demand at Mumbai and Chennai even as storage for low-sulfur grades lags. The cumulative effect keeps the bunker fuel market tightly linked to Asian trade pulses, reinforcing the region’s role as volume anchor and price setter.
Green-Corridor Initiatives Accelerating Ammonia & Methanol Bunkering
Twenty-four governments have endorsed the Clydebank Declaration that targets zero-emission shipping routes by 2030, with pilots now active on Singapore–Rotterdam and Los Angeles–Shanghai lanes. Maersk’s 25-unit methanol order book and Mitsui O.S.K. Lines’ ammonia-fuelled bulkers show carrier commitment to fuels that can meet 2050 net-zero targets without relying on unproven carbon capture. Copenhagen, Rotterdam, and Singapore already supply methanol regularly, and the EU has earmarked EUR 1 billion to co-fund ammonia and methanol terminals. Toxicity and energy-density issues slow ammonia adoption, yet public-private capital inflows and early vessel orders confirm momentum. These corridors create a feedback loop: as supply certainty improves, owners firm up alternative-fuel new-builds, further diluting reliance on conventional bunkers.
Restraints Impact Analysis*
| Restraint | (~) % Impact on CAGR Forecast | Geographic Relevance | Impact Timeline |
|---|---|---|---|
| Tightening lifecycle-GHG regulations beyond CO₂ | -0.50% | Global, with EU and California leading | Medium term (2-4 years) |
| Volatile crude spreads disrupting VLSFO pricing | -0.30% | Global, acute in Middle East-dependent regions | Short term (≤2 years) |
| Limited global LNG bunkering infrastructure | -0.40% | Emerging markets, many secondary ports | Long term (≥4 years) |
| Refinery yield shift reducing residual supply | -0.30% | Global, highest in aging refinery clusters | Medium term (2-4 years) |
| Source: Mordor Intelligence | |||
Tightening Lifecycle-GHG Regulations Beyond CO₂
Global rules are shifting from tailpipe carbon to full lifecycle metrics that capture methane slip and upstream emissions. IMO draft guidelines due in 2026 will force owners to disclose methane leakage factors that can neutralize LNG’s headline emissions advantage if engines are not high-pressure systems. California’s planned Low Carbon Fuel Standard revisions outline similar penalties, putting older dual-fuel engines under cost pressure. Studies peg methane slip between 0.2% and 3.5% depending on engine load, and given methane’s 28× global-warming potential, this can materially shift fuel economics. Scrubber discharge bans in Singapore and Fujairah add parallel compliance burdens for HSFO users. The combined effect restrains LNG upside and crimps the bunker fuel market CAGR absent rapid hardware and regulatory evolution.
Limited Global LNG Bunkering Infrastructure
Singapore's third LNG bunker vessel, FueLNG Bellina, lifted the city-state's capacity to 36,000 m³, yet demand could outstrip supply once the LNG fleet exceeds 1,200 ships by 2028. Outside top hubs, cryogenic storage and truck-loading facilities remain rare; most South American, African, and many secondary Asian ports offer no commercial LNG service. Financing is the main roadblock: a mid-size terminal needs USD 50-150 million, but owners hesitate to sign long-term take-or-pay deals amid regulatory uncertainty. The gap is starker for ammonia and methanol; fewer than ten ports offer methanol bunkering, and ammonia remains in the pilot stage. The shortfall forces detours or dual-fuel fallback to VLSFO, diluting alternative-fuel momentum and tempering bunker fuel market growth in emerging regions.
*Our forecasts treat driver/restraint impacts as directional, not additive. The impact forecasts reflect baseline growth, mix effects, and variable interactions.
Segment Analysis
By Fuel Type: VLSFO’s Regulatory Lock-In Meets LNG’s Exponential Climb
VLSFO retained 52.4% of global volume in 2025, anchoring the bunker fuel market size at a point where one grade still meets broad compliance without major hardware changes. The fuel’s dominance is expected to erode only gradually because many owners hedge price risk through term contracts, limiting exposure to short-term spreads. LNG’s 31.6% forecast CAGR signals a second axis of growth that pulls investment into cryogenic storage, dual-fuel engines, and related supply chains. High-Sulfur Fuel Oil (HSFO) remains viable for scrubber-equipped tonnage, but refinery upgrades are shrinking residual output, squeezing discounts that justified scrubber spend.
Methanol and ammonia are moving from pilot to early commercialization as first-mover fleets secure green-corridor routes and subsidized bunkering slots. Bio-fuels and e-fuels are being blended at 5–20% levels, enabling owners to cut lifecycle intensity without engine changes, which shores up short-run demand while larger technology transitions play out. The result is a bifurcated bunker fuel market: legacy fleets maximize VLSFO economics, while strategic new builds lock in LNG or methanol to future-proof against carbon levies.


By Bunkering Method: Ship-to-Ship Efficiency Versus LNG Barge Scaling
Ship-to-ship transfers commanded a 39.9% share in 2025 and underpin the operational flexibility prized by liner alliances that require quick turnarounds at anchorage. LNG barge-to-ship supply, although smaller today, is on a 30.1% CAGR trajectory and is emerging as the preferred pathway for alternative fuels because barges avoid the sunk cost of fixed pipelines. Truck and pipeline port-to-ship deliveries remain essential in smaller harbors but face congestion and storage limits.
The rise of barges widens the addressable bunker fuel market because ports can flex across multiple fuels by swapping or retrofitting hulls. Singapore’s fourth LNG barge, due in 2026, will boost supply resilience, while Rotterdam’s Gate expansion doubled truck-loading slots, ensuring simultaneous barge and truck operations that cut vessel waiting time. The method split underscores a strategic choice: barges deliver modularity but demand capital and crew skills, whereas pipelines promise volume but risk obsolescence if fuel preferences change.
By Vessel Type: Container Dominance and Passenger Fleet Transformation
Container liners consumed 42.1% of bunkers in 2025, ensuring that their procurement tactics set implicit standards for pricing and grade spreads across the bunker fuel market. Alliance dynamics mean that fuel strategies adopted by the 2M, Ocean Alliance, and THE Alliance reverberate through the spot market. Passenger and Ro-Pax fleets, growing at a 5.3% CAGR, are early adopters of LNG and shore-power because ports extend environmental fee rebates that cushion fuel premiums. Tankers and bulkers adopt scrubbers or hedge spreads, weighing long-haul HSFO economics versus compliance costs.
Offshore support and specialized vessels test methanol blends and bio-LNG because their shorter voyages ease fuel availability risk. The International Maritime Organization’s CII ratings compel older hulls to slow-steam or install energy-saving devices, nudging consumption toward higher-quality grades that perform reliably at lower loads, IMO. This vessel-type mix locks in medium-term support for the bunker fuel market, even as alternative fuels gain share.
Geography Analysis
Asia-Pacific held 44.7% of volume in 2025, reflecting Singapore’s 50.6 million-tonne throughput and China’s surging port calls. South Korea and Japan expanded LNG offerings for short-sea ferries and trans-Pacific container loops, while Indonesia and Vietnam invested in truck-based VLSFO delivery to back near-shore manufacturing. India’s partial cabotage liberalization boosted bunker uplift at Mumbai and Chennai, yet limited low-sulfur storage caps growth.
The Middle East and Africa region is projected to outpace all others at a 3.5% CAGR, anchored by Fujairah’s 6.3 million-tonne sales and Saudi Aramco’s LNG investments at Red Sea gateways. ADNOC and TotalEnergies added 18,000 m³ of floating LNG storage in early 2026, positioning the Gulf to intercept Asia–Europe flows. Egypt seeks to replicate the model by studying LNG supply points at Port Said and Suez, as 20,600 vessels still used the canal in 2024 despite diversion shocks.
Europe remains defined by strict ECA rules in the Baltic, North Sea, and English Channel. Rotterdam’s 9.2 million-tonne throughput and expanded Gate terminal make it the regional hub for both VLSFO and LNG. FuelEU Maritime adds a carbon-intensity levy from 2025 onward, prompting owners to blend bio-fuels or book methanol slots to avoid EUR 2,400 penalties per tonne of CO₂ equivalent. North America’s Jones Act hurdles inhibit ship-to-ship LNG supply, while South American ports lack cryogenic storage, keeping the bunker fuel market there dependent on conventional grades.

Competitive Landscape
Integrated majors Shell, TotalEnergies, BP, ExxonMobil, and Chevron supply nearly half of global bunker volumes through refinery-to-wharf vertical chains that capture margin at each step. They leverage mass-flow meters, blockchain quality verification, and long-term concessions to lock in volumes at strategic gateways. Independent traders, Peninsula Petroleum, Minerva Bunkering, and World Fuel Services, win business by offering tailored delivery windows, blended bio-fuels, and digital booking portals that let owners hedge across ports. Liner majors now integrate backward: Maersk, MSC, and CMA CGM use joint ventures and offtake agreements to secure methanol and LNG for dedicated corridors, insulating schedules from spot volatility.
Technology is resetting competitive baselines. Wärtsilä’s Voyage and Kongsberg’s Vessel Insight feed weather, engine, and port data into AI algorithms that cut consumption by up to 10%, translating into lower lifted volumes but higher grade selectivity. Shell and TotalEnergies trial blockchain-based custody systems that reduce bunker quantity disputes, historically worth 5-10% of transaction value. Early entrants in methanol and ammonia supply, Neste and Preem, are capturing green-corridor volume that legacy suppliers cannot serve without retooling terminals.
Inorganic moves underline strategic positioning. BP’s 40% stake in a Singapore LNG supplier adds two 10,000 m³ barges to its fleet. TotalEnergies and ADNOC pooled resources to develop floating LNG storage in Fujairah, extending Gulf footprint into Asia-bound lanes. Shell committed EUR 120 million to an ammonia terminal in Rotterdam due online in 2028, pre-empting demand from green corridors .
Bunker Fuel Industry Leaders
Exxon Mobil Corporation
BP Plc
Royal Dutch Shell Plc
Gazpromneft Marine Bunker LLC
TotalEnergies SE
- *Disclaimer: Major Players sorted in no particular order

Recent Industry Developments
- June 2026: BHP and Singapore's Global Centre for Maritime Decarbonisation (GCMD) announced the successful testing of a biofuel bunker blend made from used cooking oil and waste animal fats. The trial confirmed the feasibility of using lower-carbon bunker fuels with existing bunkering infrastructure, potentially reducing lifecycle greenhouse gas emissions by approximately 79% compared to conventional marine fuel oil.
- March 2025: CMA CGM partnered with Preem to secure 50,000 tonnes of renewable methanol annually from 2026.
- March 2025: Mitsui O.S.K. Lines ordered two ammonia-fuelled Capesize bulkers from Japan Marine United for 2027 delivery.
- October 2024: TotalEnergies completed a 50% acquisition of a Fujairah LNG bunkering venture with ADNOC, adding 18,000 m³ of floating storage.
- January 2024: Carnival Corporation signed an agreement with Wärtsilä to retrofit 15 cruise ships with dual-fuel LNG engines by 2029.


Global Bunker Fuel Market Report Scope
Bunker fuel, often referred to as bunker oil, is a heavy, low-grade fuel primarily used to power large ships and select aircraft. The term "bunker" harks back to early steamships, where storage areas for coal were termed bunkers. Derived as a residual product from crude oil refining, bunker fuel is typically thick and tar-like, known in the industry as Heavy Fuel Oil (HFO). This viscosity necessitates heating for pumping. Traditionally high in sulfur content, the industry is witnessing a shift towards cleaner and lighter marine fuels.
The bunker fuels market is segmented by fuel type, bunkering method, vessel type, and geography. By fuel type, the market is segmented into high sulfur fuel oil (HSFO), very low sulfur fuel oil (VLSFO), marine gas oil (MGO), liquefied natural gas (LNG), and other fuel types. By bunkering method, the market is segmented into ship-to-ship, port-to-ship, LNG barge-to-ship, portable tanks, and containers. By vessel type, the market is segmented into containers, tankers, general cargo, bulk carriers, and other vessel types. The report also covers the sizes and forecasts for the bunker fuels market across major regions. For each segment, the market sizing and forecasts are done based on volume (Million Tonnes).
By Fuel Type
| High-Sulfur Fuel Oil (HSFO) |
| Very-Low-Sulfur Fuel Oil (VLSFO) |
| Ultra-Low-Sulfur Fuel Oil (ULSFO) |
| Marine Gas Oil (MGO) |
| Liquefied Natural Gas (LNG) |
| Methanol |
| Bio-/Synthetic Fuels |
| Ammonia |
| Other Fuel Types |
By Bunkering Method
| Ship-to-Ship |
| Port-to-Ship (Truck/Pipeline) |
| LNG Barge-to-Ship |
| Portable Tanks and Containers |
By Vessel Type
| Container |
| Tanker |
| Bulk Carrier |
| General Cargo |
| Passenger/Ro-Pax |
| Offshore and Specialized |
By Geography
| North America | United States |
| Canada | |
| Mexico | |
| Europe | Germany |
| United Kingdom | |
| Spain | |
| Italy | |
| NORDIC Countries | |
| Russia | |
| Rest of Europe | |
| Asia-Pacific | China |
| India | |
| Japan | |
| South Korea | |
| Singapore | |
| Indonesia | |
| Australia | |
| Rest of Asia-Pacific | |
| South America | Brazil |
| Argentina | |
| Chile | |
| Rest of South America | |
| Middle East and Africa | Saudi Arabia |
| United Arab Emirates | |
| Qatar | |
| South Africa | |
| Nigeria | |
| Egypt | |
| Rest of Middle East and Africa |
| By Fuel Type | High-Sulfur Fuel Oil (HSFO) | |
| Very-Low-Sulfur Fuel Oil (VLSFO) | ||
| Ultra-Low-Sulfur Fuel Oil (ULSFO) | ||
| Marine Gas Oil (MGO) | ||
| Liquefied Natural Gas (LNG) | ||
| Methanol | ||
| Bio-/Synthetic Fuels | ||
| Ammonia | ||
| Other Fuel Types | ||
| By Bunkering Method | Ship-to-Ship | |
| Port-to-Ship (Truck/Pipeline) | ||
| LNG Barge-to-Ship | ||
| Portable Tanks and Containers | ||
| By Vessel Type | Container | |
| Tanker | ||
| Bulk Carrier | ||
| General Cargo | ||
| Passenger/Ro-Pax | ||
| Offshore and Specialized | ||
| By Geography | North America | United States |
| Canada | ||
| Mexico | ||
| Europe | Germany | |
| United Kingdom | ||
| Spain | ||
| Italy | ||
| NORDIC Countries | ||
| Russia | ||
| Rest of Europe | ||
| Asia-Pacific | China | |
| India | ||
| Japan | ||
| South Korea | ||
| Singapore | ||
| Indonesia | ||
| Australia | ||
| Rest of Asia-Pacific | ||
| South America | Brazil | |
| Argentina | ||
| Chile | ||
| Rest of South America | ||
| Middle East and Africa | Saudi Arabia | |
| United Arab Emirates | ||
| Qatar | ||
| South Africa | ||
| Nigeria | ||
| Egypt | ||
| Rest of Middle East and Africa | ||


Key Questions Answered in the Report
What is the current bunker fuel market size and growth outlook?
The market is valued at 249.65 million tonnes in 2026 and is forecast to reach 290.12 million tonnes by 2031, at a CAGR of 3.05%.
Which fuel type will grow fastest through 2031?
Liquefied Natural Gas is projected to expand at 31.6% CAGR, driven by dual-fuel new-build deliveries and green-corridor mandates.
How will FuelEU Maritime affect fuel selection?
The rule layers carbon-intensity cuts onto sulfur limits, encouraging blends of VLSFO, LNG, methanol, and emerging ammonia to avoid penalties.
Which region offers the highest growth potential?
Middle East and Africa is set for the quickest rise at 3.5% CAGR as Fujairah and Saudi Arabia scale LNG bunkering capacity.
How concentrated is global supply?
Integrated majors hold about half of physical supply, giving the sector a moderate concentration score of 6.
Page last updated on:


