Chile Fruits And Vegetables Market Analysis by Mordor Intelligence
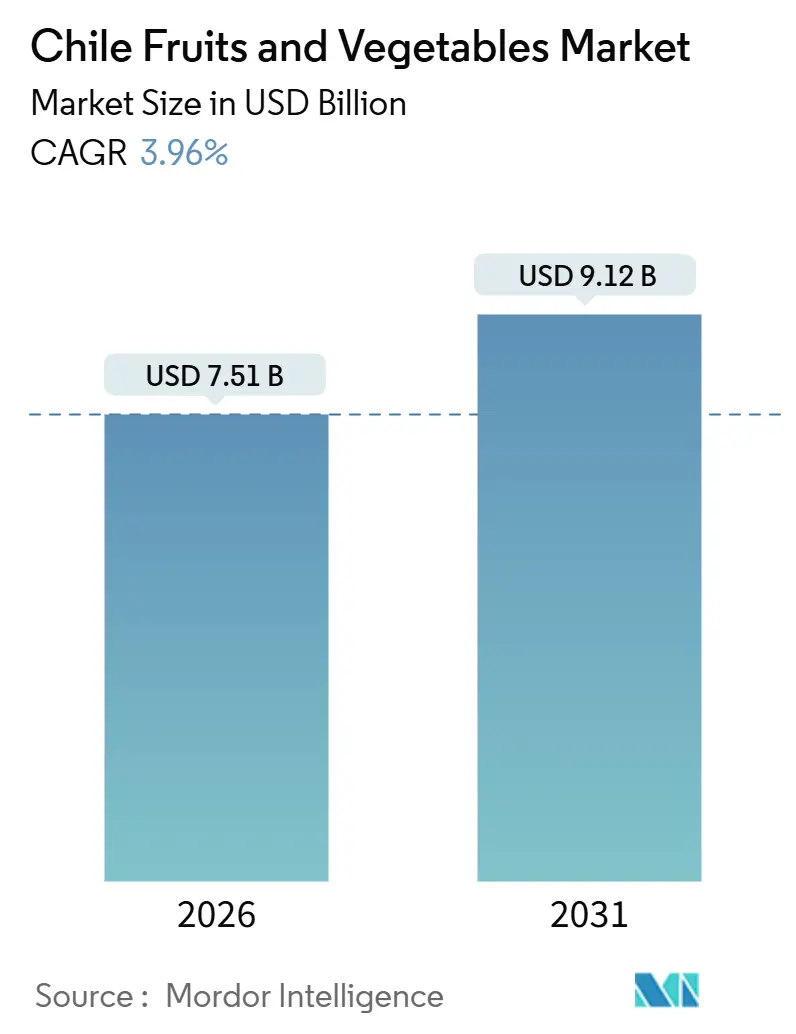
The Chile fruits and vegetables market size stands at USD 7.51 billion in 2026 and is projected to reach USD 9.12 billion by 2031, registering a 3.96% CAGR during 2026-2031. A decisive shift from wine-grape monoculture toward export-oriented cherries and blueberries, rising urban incomes, and strong plant-forward dietary trends are steering demand. Export volumes for cherries reached 401,203 metric tons in the 2024-2025 season, while domestic consumption increased due to the adoption of flexitarianism among millennials in Santiago, Valparaíso, and Concepción. Central Chile continues to dominate output, owing to its irrigated valleys and proximity to ports. Southern Chile is gaining traction as growers chase cooler microclimates and lower land costs to extend the export calendar. Government irrigation subsidies, precision agriculture rollouts, and a United States systems approach that eliminates costly fumigation have reduced operating risks and improved quality premiums. Persistent megadrought, labor shortages, port congestion, and residue-related shipment rejections remain headwinds that temper the medium-term outlook.
Key Report Takeaways
- By type, fruits accounted for 57% of the Chile fruits and vegetables market size in 2025 and are forecast to grow at a 3.8% CAGR through 2031.
Note: Market size and forecast figures in this report are generated using Mordor Intelligence’s proprietary estimation framework, updated with the latest available data and insights as of January 2026.
Chile Fruits And Vegetables Market Trends and Insights
Drivers Impact Analysis*
| Driver | (~) % Impact on CAGR Forecast | Geographic Relevance | Impact Timeline |
|---|---|---|---|
| Rising vegan and flexitarian population | +0.4% | National with early gains in Santiago, Valparaíso, and Concepción | Medium term (2-4 years) |
| Expansion of export-oriented orchards | +0.8% | Asia-Pacific focus with spillover to North America and Europe | Long term (≥ 4 years) |
| Government irrigation subsidies and water-efficiency tech adoption | +0.5% | Central and Northern Chile | Medium term (2-4 years) |
| United States-Chile systems approach reducing fumigation costs for grapes | +0.3% | North America, with secondary benefits in Europe | Short term (≤ 2 years) |
| Retail and e-commerce push for fresh-cut convenience stock keeping unit (SKUs) | +0.3% | National, concentrated in urban Santiago and Valparaíso | Short term (≤ 2 years) |
| Varietal renewal boosting post-harvest quality | +0.4% | Global, strongest in Asia-Pacific and North America | Medium term (2-4 years) |
| Source: Mordor Intelligence | |||
Rising Vegan and Flexitarian Population
Domestic per-capita consumption of fresh produce in Chile climbed 8% between 2019 and 2025, driven by a documented shift toward plant-based diets among urban consumers aged 25 to 40. Survey data from the Chilean Ministry of Health indicated that 22% of Santiago residents identified as flexitarian in 2025, up from 14% in 2020, reflecting heightened awareness of cardiovascular health and environmental sustainability [1]Source: Chilean Ministry of Health, “National Dietary Survey 2025,” minsal.cl. This behavioral pivot is amplifying demand for ready-to-eat salad kits, pre-cut vegetable trays, and organic berries in supermarket chains such as Jumbo and Walmart Chile. Retailers are responding by dedicating 15% to 20% of fresh-produce floor space to plant-based meal solutions, a category that generated USD 340 million in sales across Chile in 2024. The trend is particularly pronounced in Santiago, where disposable incomes exceed the national average by 28%, enabling premium pricing for organic and locally sourced vegetables.
Expansion of Export-Oriented Orchards
Growers converted 8,200 hectares of vineyard land and idle pasture to cherry and blueberry orchards in 2024 and 2025, targeting counter-seasonal export windows into China, where Chilean fruit commands a 40% premium over domestic alternatives during the Lunar New Year period. According to United States Department of Agriculture, Chile exported 401,203 metric tons of cherries in the 2024-2025 season, with 91% of the shipments going to China, generating FOB revenues of USD 1.8 billion. Blueberry shipments reached 134,000 metric tons in the same season, a 12% increase year-on-year, as late-season varieties such as Ventura and Cargo extended the harvest calendar into April and captured premium pricing in North American and European markets. The rapid expansion is straining cold-chain infrastructure, with reefer container shortages at Valparaíso port delaying shipments by up to 9 days during the peak harvest months of December and January.
Government Irrigation Subsidies and Water-Efficiency Tech Adoption
Chile's National Irrigation Commission (CNR), operating under the Ministry of Agriculture, allocated USD 43 million in 2024 and USD 49 million in 2025 to co-finance drip irrigation systems, pivot installations, and soil moisture sensors for smallholder and mid-sized growers. Chile's economic development agency launched a parallel program in 2024 to subsidize precision-agriculture platforms that integrate satellite imagery, weather forecasts, and real-time soil data to optimize irrigation scheduling. Early adopters in O'Higgins and Maule regions reported water savings of 18% to 25% and yield improvements of 12% for table grapes and stone fruits. The Chilean Association of Fruit Exporters (ASOEX) estimates that 14,000 hectares of orchards and vegetable fields adopted drip or micro-sprinkler systems in 2024, up from 9,800 hectares in 2023, as growers sought to mitigate rising water-trucking costs that exceeded USD 50 per cubic meter in peak summer months.
United States Chile Systems Approach Reducing Fumigation Costs for Grapes
The United States Department of Agriculture's Animal and Plant Health Inspection Service (USDA APHIS) approved Chile's system approach for table grapes in December 2023, eliminating the requirement for methyl bromide fumigation at United States ports of entry. This regulatory shift reduced post-harvest treatment costs by USD 0.08 to USD 0.12 per kilogram and cut spoilage losses by 6% to 8%, as fumigation-induced stem browning and berry softening were eliminated. The systems approach mandates orchard-level monitoring for Mediterranean fruit fly, packing-house sanitation protocols, and traceability systems that link each carton to its source block. Compliance costs average USD 0.03 per kilogram, a fraction of the fumigation expense. The approach has been extended to stone fruits and kiwifruit, with approval from the United States Department of Agriculture's Animal and Plant Health Inspection Service (USDA APHIS) granted in March 2025.
Restraints Impact Analysis*
| Restraint | (~) % Impact on CAGR Forecast | Geographic Relevance | Impact Timeline |
|---|---|---|---|
| Megadrought-induced water scarcity in Central Valley | −0.6% | Central Chile with spillover to Northern valleys | Long term (≥ 4 years) |
| Rising labor costs and seasonal labor shortages | −0.5% | National, acute in Central and Southern zones | Medium term (2-4 years) |
| Logistics bottlenecks at San Antonio and Valparaíso ports | −0.3% | National, affecting all exporters | Short term (≤ 2 years) |
| Pesticide-residue alerts triggering shipment rejections | −0.3% | Global, with the highest impact in Europe and Asia-Pacific | Medium term (2-4 years) |
| Source: Mordor Intelligence | |||
Megadrought-Induced Water Scarcity in Central Valley
Central Chile has experienced a 30% reduction in surface water availability since 2019, as the megadrought, now in its 15th consecutive year, has depleted reservoirs and snowpack in the Andes. The Maule River basin recorded flows 42% below the 30-year average in 2024, forcing growers to drill wells exceeding 200 meters in depth and truck water at costs surpassing USD 50 per cubic meter during peak summer months [2]Source: World Bank, “Chile Economic Outlook 2024,” worldbank.org . The Chilean Water Directorate (DGA) issued 1,240 water rights suspensions in the O'Higgins and Maule regions in 2024, affecting 18,600 hectares of orchards and vegetable fields, as priority allocation shifted to urban consumption and hydropower generation. Growers responded by investing in drip irrigation, soil moisture sensors, and deficit irrigation protocols that reduce water application by 20% to 30% while maintaining acceptable yields.
Rising Labor Costs and Seasonal Labor Shortages
Chile raised its monthly minimum wage to USD 475 in January 2025, a 7% nominal increase that elevated labor costs for harvest-intensive crops such as table grapes, cherries, and asparagus. Seasonal agricultural employment in Chile totaled 420,000 workers during the 2024-2025 harvest season, a 6% decrease from 447,000 in the 2019-2020 season, as younger workers migrated to urban service sectors and construction, which offer year-round contracts and higher wages. Hortifrut deployed 18 autonomous berry-harvesting platforms in its Maule blueberry fields in 2024, achieving picking rates of 25 kilograms per hour compared to 12 kilograms for manual labor. The company announced plans to expand robotic coverage to 40% of its Chilean acreage by 2027. Mechanical harvesting remains unsuitable for delicate stone fruits and premium table grapes, where hand-picking preserves stem integrity and minimizes bruising.
*Our forecasts treat driver/restraint impacts as directional, not additive. The impact forecasts reflect baseline growth, mix effects, and variable interactions.
Segment Analysis
By Type: Fruits Dominate Amid Berry and Cherry Export Surge
By type, fruits accounted for 57% of the Chile fruits and vegetables market size in 2025 and are forecast to grow at a 3.8% CAGR through 2031. According to the United States Department of Agriculture (USDA), berries and table grapes capitalize on counter-seasonal export windows into Asia, North America, and Europe. Cherry exports reached 401,203 metric tons in the 2024-2025 season, generating FOB revenues of USD 1.8 billion, with 91% of volumes shipped to China during the December-to-February window [3]Source: USDA Foreign Agricultural Service, “Chile Stone Fruit Annual Report 2025,” fas.usda.gov .
Blueberries contributed 134,000 metric tons, a 12% year-on-year increase, as late-season varieties such as Ventura and Cargo extended the harvest calendar into April and captured premium pricing when competing Southern Hemisphere suppliers exited the market. Table grapes, apples, and kiwifruit, along with seedless grape varieties, are gaining market share as the United States' Chilean systems approach eliminates methyl bromide fumigation costs and reduces spoilage by 6% to 8%. Avocados, citrus, and walnuts contributed smaller volumes but are expanding in Northern Chile, where arid conditions reduce fungal pressure and enable lower pesticide application rates.


Geography Analysis
Central Chile, encompassing the O'Higgins, Maule, and Ñuble regions, benefits from established irrigation infrastructure, proximity to Santiago's wholesale markets, and access to the San Antonio and Valparaíso export terminals. The region produced 78% of Chile's table grapes, 64% of stone fruits, and 52% of apples in 2024, capitalizing on Mediterranean microclimates that provide optimal chill hours and heat accumulation for deciduous crops. The Chilean Water Directorate (DGA) issued 1,240 water-rights suspensions in O'Higgins and Maule in 2024, affecting 18,600 hectares, and constraining production growth to 1.8% annually through 2031.
Southern Chile, spanning Biobío, La Araucanía, and Los Lagos, is the fastest-growing region as growers exploit cooler microclimates, lower land costs averaging USD 12,000 per hectare, and higher annual rainfall exceeding 1,200 millimeters. The region expanded cherry acreage by 1,800 hectares in 2024 and 2025, targeting late-season varieties that ripen in February and March, when Chinese demand peaks and competing suppliers have exited the market. Blueberry plantings reached 6,200 hectares in 2025, up from 4,800 hectares in 2022, with late-season cultivars such as Cargo and Atlas generating FOB prices 18% higher than mid-season fruit.
Northern Chile, encompassing Atacama, Coquimbo, and Valparaíso, specializes in table grapes, citrus, avocados, and walnuts that utilize arid conditions to minimize fungal pressure and reduce pesticide dependency. The region produced 22% of Chile's table grapes in 2024, with early-season varieties such as Sugraone and Crimson Seedless capturing premium pricing in November and December before Central Chile volumes arrive. Water scarcity remains acute, with the Elqui and Limarí river basins recording flows 38% below the 30-year average in 2024, prompting investments in desalination and wastewater-recycling projects that cost USD 1.20 to USD 1.50 per cubic meter.
Competitive Landscape
The Chilean fruits and vegetables market in 2025 is characterized by producers, importers, exporters, and other players holding significant shares, reflecting the dominance of mid-sized family operations and cooperative structures that aggregate smallholder output for export. Dispersion creates white-space opportunities for vertically integrated players that can control cold-chain logistics, secure long-term retail contracts, and invest in varietal innovation. Leading players are expanding robotic coverage to 40% of their Chilean acreage by 2027, a move that signals the sector's pivot toward mechanization as labor costs rise.
Unifrutti Traders acquired Verfrut in January 2024, integrating 2,400 hectares of stone-fruit orchards and securing long-term supply agreements with Walmart Chile and Costco. This acquisition demonstrates how consolidation is being driven by retailers' demand for year-round supply and traceability. Smaller exporters, such as Exportadora Subsole, Prize Export, and Greenvic, are carving out niches in organic certification, late-season varieties, and direct-to-consumer e-commerce, thereby bypassing traditional wholesale channels to capture higher margins.
Technology adoption is accelerating, with 14,000 hectares of orchards and vegetable fields adopting drip or micro-sprinkler systems in 2024, up from 9,800 hectares in 2023, supported by CLP 42 billion (USD 43 million) in government subsidies. The Chilean Association of Fruit Exporters (ASOEX) filed 14 varietal patents in 2024, covering late-season cherries, low-chill peaches, and extended-shelf-life blueberries, signaling the sector's shift toward intellectual-property-driven differentiation.
Recent Industry Developments
- January 2025: Chile has inaugurated a new inspection site for fresh fruits and vegetables destined for the United States. The site, which spans 3,650 square meters (11,975 square feet) and features 30 inspection tables, will enhance the capacity to review and comply with the required international standards.
- October 2025: Peru, Mexico, and Chile officially launched the Global Grape Group (GGG), a collaborative alliance of leading table grape exporters aimed at boosting global consumption and strengthening market access through coordinated promotional and marketing activities. The group’s efforts include campaigns such as “Have a Grape Day,” targeting major markets like the United States to elevate grapes as a healthy snack and support export growth. This initiative highlights the growing cooperation among southern-hemisphere producers to expand demand and enhance competitiveness in the face of evolving global fresh produce trends.
- May 2023: The Chilean government introduced the National Sovereignty Strategy for Food Security, titled “Juntos Alimentamos Chile.” This initiative focuses on strengthening domestic production, enhancing supply chain resilience, and improving access to nutritious fruits, vegetables, and other staple foods. Key components of the strategy include support for small and medium-sized farmers, investments in modern agricultural technologies, and measures to minimize post-harvest losses and logistical challenges. The program aims to increase local fruit and vegetable production capacity, enhance competitiveness, and reduce dependence on imports within Chile's agriculture market.


Chile Fruits And Vegetables Market Report Scope
Fruits and vegetables are defined as the edible parts of plants, including seed-bearing structures, flowers, buds, leaves, stems, shoots, and roots. These may be cultivated or harvested from the wild, either in their raw state or in a minimally processed form. The report provides comprehensive coverage of production analysis (volume), consumption analysis (value and volume), import analysis (value and volume), export analysis (value and volume), wholesale price trend analysis and forecast, a list of key players, and additional insights. The market forecasts are presented in both value (USD) and volume (metric tons) terms.
Type
| Vegetables | Potatoes | Production Analysis | Production Volume | |
| Area Harvested and Yield | ||||
| Consumption Analysis (Value and Volume) | ||||
| Trade Analysis (Value and Volume) | Import Market Analysis | Import Value and Volume | ||
| Key Supplying Markets | ||||
| Export Market Analysis | Export Value and Volume | |||
| Key Destination Markets | ||||
| Wholesale Price Trend Analysis and Forecast | ||||
| Seasonality Analysis | ||||
| Tomatoes | Production Analysis | Production Volume | ||
| Area Harvested and Yield | ||||
| Consumption Analysis (Value and Volume) | ||||
| Import Value and Volume | ||||
| Key Supplying Markets | ||||
| Export Value and Volume | ||||
| Key Destination Markets | ||||
| Wholesale Price Trend Analysis and Forecast | ||||
| Seasonality Analysis | ||||
| Onions | Production Analysis | Production Volume | ||
| Area Harvested and Yield | ||||
| Consumption Analysis (Value and Volume) | ||||
| Import Value and Volume | ||||
| Key Supplying Markets | ||||
| Export Value and Volume | ||||
| Key Destination Markets | ||||
| Wholesale Price Trend Analysis and Forecast | ||||
| Seasonality Analysis | ||||
| Fruits | Grapes | Production Analysis | Production Volume | |
| Area Harvested and Yield | ||||
| Consumption Analysis (Value and Volume) | ||||
| Import Value and Volume | ||||
| Key Supplying Markets | ||||
| Export Value and Volume | ||||
| Key Destination Markets | ||||
| Wholesale Price Trend Analysis and Forecast | ||||
| Seasonality Analysis | ||||
| Apples | Production Analysis | Production Volume | ||
| Area Harvested and Yield | ||||
| Consumption Analysis (Value and Volume) | ||||
| Import Value and Volume | ||||
| Key Supplying Markets | ||||
| Export Value and Volume | ||||
| Key Destination Markets | ||||
| Wholesale Price Trend Analysis and Forecast | ||||
| Seasonality Analysis | ||||
| Blueberries | Production Analysis | Production Volume | ||
| Area Harvested and Yield | ||||
| Consumption Analysis (Value and Volume) | ||||
| Import Value and Volume | ||||
| Key Supplying Markets | ||||
| Export Value and Volume | ||||
| Key Destination Markets | ||||
| Wholesale Price Trend Analysis and Forecast | ||||
| Seasonality Analysis | ||||
| Cherries | Production Analysis | Production Volume | ||
| Area Harvested and Yield | ||||
| Consumption Analysis (Value and Volume) | ||||
| Import Value and Volume | ||||
| Key Supplying Markets | ||||
| Export Value and Volume | ||||
| Key Destination Markets | ||||
| Wholesale Price Trend Analysis and Forecast | ||||
| Seasonality Analysis | ||||
| Avocados | Production Analysis | Production Volume | ||
| Area Harvested and Yield | ||||
| Consumption Analysis (Value and Volume) | ||||
| Import Value and Volume | ||||
| Key Supplying Markets | ||||
| Export Value and Volume | ||||
| Key Destination Markets | ||||
| Wholesale Price Trend Analysis and Forecast | ||||
| Seasonality Analysis | ||||
| Kiwi | Production Analysis | Production Volume | ||
| Area Harvested and Yield | ||||
| Consumption Analysis (Value and Volume) | ||||
| Import Value and Volume | ||||
| Key Supplying Markets | ||||
| Export Value and Volume | ||||
| Key Destination Markets | ||||
| Wholesale Price Trend Analysis and Forecast | ||||
| Seasonality Analysis | ||||
| Type | Vegetables | Potatoes | Production Analysis | Production Volume | |
| Area Harvested and Yield | |||||
| Consumption Analysis (Value and Volume) | |||||
| Trade Analysis (Value and Volume) | Import Market Analysis | Import Value and Volume | |||
| Key Supplying Markets | |||||
| Export Market Analysis | Export Value and Volume | ||||
| Key Destination Markets | |||||
| Wholesale Price Trend Analysis and Forecast | |||||
| Seasonality Analysis | |||||
| Tomatoes | Production Analysis | Production Volume | |||
| Area Harvested and Yield | |||||
| Consumption Analysis (Value and Volume) | |||||
| Import Value and Volume | |||||
| Key Supplying Markets | |||||
| Export Value and Volume | |||||
| Key Destination Markets | |||||
| Wholesale Price Trend Analysis and Forecast | |||||
| Seasonality Analysis | |||||
| Onions | Production Analysis | Production Volume | |||
| Area Harvested and Yield | |||||
| Consumption Analysis (Value and Volume) | |||||
| Import Value and Volume | |||||
| Key Supplying Markets | |||||
| Export Value and Volume | |||||
| Key Destination Markets | |||||
| Wholesale Price Trend Analysis and Forecast | |||||
| Seasonality Analysis | |||||
| Fruits | Grapes | Production Analysis | Production Volume | ||
| Area Harvested and Yield | |||||
| Consumption Analysis (Value and Volume) | |||||
| Import Value and Volume | |||||
| Key Supplying Markets | |||||
| Export Value and Volume | |||||
| Key Destination Markets | |||||
| Wholesale Price Trend Analysis and Forecast | |||||
| Seasonality Analysis | |||||
| Apples | Production Analysis | Production Volume | |||
| Area Harvested and Yield | |||||
| Consumption Analysis (Value and Volume) | |||||
| Import Value and Volume | |||||
| Key Supplying Markets | |||||
| Export Value and Volume | |||||
| Key Destination Markets | |||||
| Wholesale Price Trend Analysis and Forecast | |||||
| Seasonality Analysis | |||||
| Blueberries | Production Analysis | Production Volume | |||
| Area Harvested and Yield | |||||
| Consumption Analysis (Value and Volume) | |||||
| Import Value and Volume | |||||
| Key Supplying Markets | |||||
| Export Value and Volume | |||||
| Key Destination Markets | |||||
| Wholesale Price Trend Analysis and Forecast | |||||
| Seasonality Analysis | |||||
| Cherries | Production Analysis | Production Volume | |||
| Area Harvested and Yield | |||||
| Consumption Analysis (Value and Volume) | |||||
| Import Value and Volume | |||||
| Key Supplying Markets | |||||
| Export Value and Volume | |||||
| Key Destination Markets | |||||
| Wholesale Price Trend Analysis and Forecast | |||||
| Seasonality Analysis | |||||
| Avocados | Production Analysis | Production Volume | |||
| Area Harvested and Yield | |||||
| Consumption Analysis (Value and Volume) | |||||
| Import Value and Volume | |||||
| Key Supplying Markets | |||||
| Export Value and Volume | |||||
| Key Destination Markets | |||||
| Wholesale Price Trend Analysis and Forecast | |||||
| Seasonality Analysis | |||||
| Kiwi | Production Analysis | Production Volume | |||
| Area Harvested and Yield | |||||
| Consumption Analysis (Value and Volume) | |||||
| Import Value and Volume | |||||
| Key Supplying Markets | |||||
| Export Value and Volume | |||||
| Key Destination Markets | |||||
| Wholesale Price Trend Analysis and Forecast | |||||
| Seasonality Analysis | |||||


Key Questions Answered in the Report
What is the current and projected value of the Chile fruits and vegetables market?
The Chile fruits and vegetables market size is USD 7.51 billion in 2026 and is projected to reach USD 9.12 billion by 2031.
Which crop category leads sales?
Fruits hold 57% of the value of 2025, led by export-ready cherries, blueberries, and table grapes.
Which region in Chile is growing the fastest in terms of produce production?
Southern Chile is growing, driven by late-season cherry and blueberry plantings.
What technological trends are shaping competitiveness?
Precision irrigation, varietal renewal, and robotic harvesters help manage water scarcity, labor costs, and post-harvest quality.
Who is the market leader among exporters?
Producers, importers, and exporters such as Garces Fruit stand out with significant shares and substantial investments in automation and varietal research and development.
Page last updated on:


