
Brazil Fruits And Vegetables Market Analysis by Mordor Intelligence
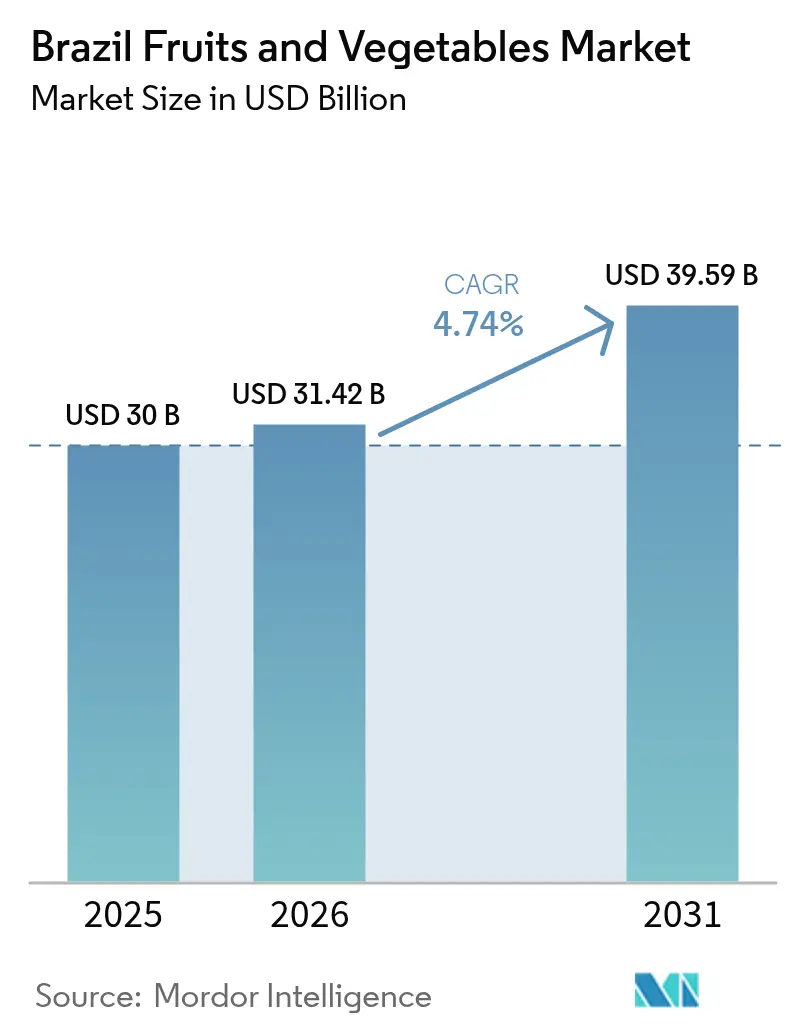
The Brazil fruits and vegetables market size is expected to grow from USD 30.0 billion in 2025 to USD 31.42 billion in 2026 and is forecast to reach USD 39.59 billion by 2031 at 4.74% CAGR over 2026-2031. The market expansion is attributed to urbanization, heightened health consciousness, and sustained production enabled by diverse agro-climatic conditions. Strategic investments in irrigation systems, cold chain infrastructure, and digital farming technologies are enhancing productivity and minimizing post-harvest losses. The favorable exchange rates maintain export margins despite fluctuating transportation costs. Processing companies are implementing vertical integration strategies to secure raw material supply and optimize profit margins, which is transforming supply chain dynamics. Producers are deploying cost-reduction technologies and diversifying market presence due to input price volatility and uncertain trade policies.
Key Report Takeaways
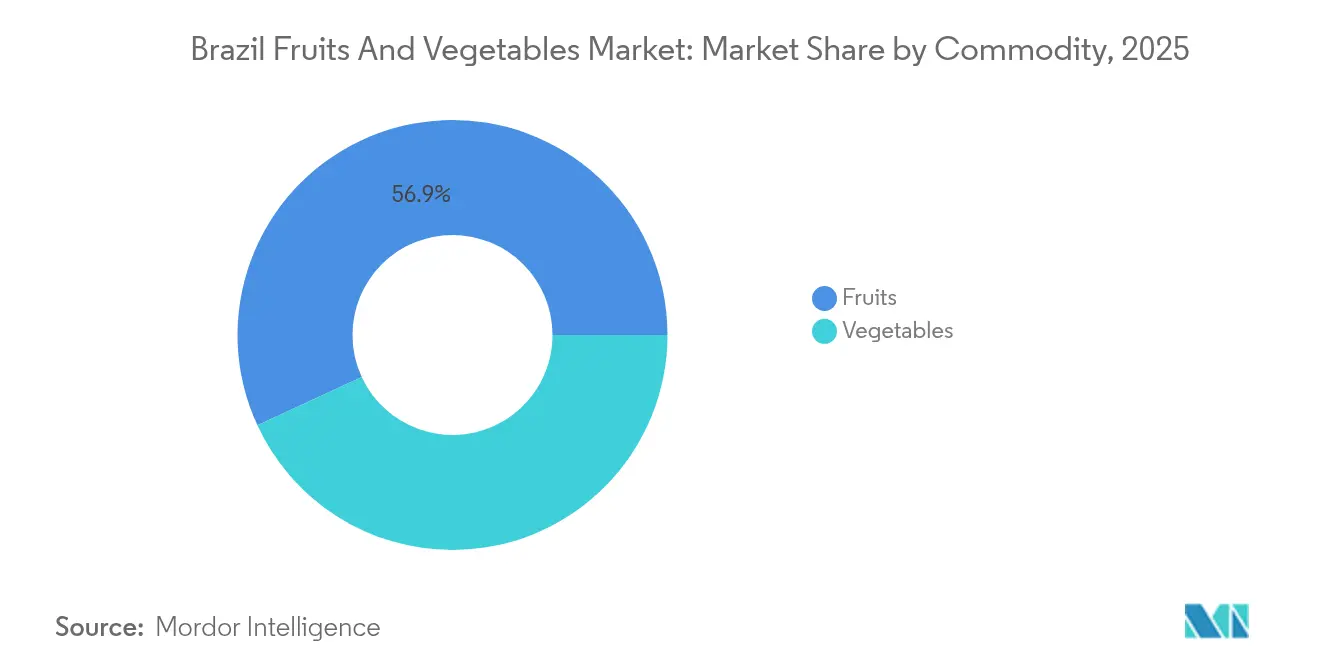
- By commodity, fruits accounted for 56.90% of the Brazil fruits and vegetables market share in 2025, whereas vegetables are projected to post a 4.93% CAGR through 2031.
Note: Market size and forecast figures in this report are generated using Mordor Intelligence’s proprietary estimation framework, updated with the latest available data and insights as of 2026.
Brazil Fruits And Vegetables Market Trends and Insights
Drivers Impact Analysis*
| Driver | (~) % Impact on CAGR Forecast | Geographic Relevance | Impact Timeline |
|---|---|---|---|
| Surging fruit-juice export contracts | +0.8% | Northeast Brazil, and São Paulo citrus belt | Medium term (2-4 years) |
| Accelerating domestic demand for fresh-cut fruits and vegetables | +0.6% | Southeast urban corridors | Short term (≤ 2 years) |
| Diverse agro-climatic zones enabling year-round output | +0.5% | Nationwide | Long term (≥ 4 years) |
| Government credit lines for horticulture tech | +0.4% | National family-farming areas | Medium term (2-4 years) |
| Expansion of drip-irrigation in semi-arid Northeast | +0.3% | Bahia and Pernambuco | Long term (≥ 4 years) |
| Ag-e-commerce platforms linking growers to institutional buyers | +0.2% | Southeast and South peri-urban belts | Short term (≤ 2 years) |
| Source: Mordor Intelligence | |||
Surging Fruit-Juice Export Contracts
Orange juice processors secured new multiyear contracts at premium prices, supported by a 36% increase in 2025-26 orange production to 314.6 million boxes. Export demand remained stable after the August 2025 United States tariff implementation, as juice concentrates and essential oils received exemptions. Processors invested in disease-resistant citrus varieties to protect against greening disease, which affects 50% of groves in São Paulo and Minas Gerais[1]. Asian and Middle Eastern buyers established binding off-take agreements, expanding beyond traditional North American markets. The industry's vertical integration expanded, exemplified by Louis Dreyfus Company's 2024 retail brand launch. These developments provided the Brazil fruits and vegetables market with protection against commodity price fluctuations and international policy changes.
Accelerating Domestic Demand for Fresh-Cut Fruits and Vegetables
The Brazil fruits and vegetables market is experiencing growth due to changing consumer preferences and operational improvements. Urban households and institutional kitchens prefer washed, sliced, and ready-to-cook products that reduce preparation time and provide a nine-day shelf life under cold storage[2]. Processing facilities near São Paulo operate double shifts, while new facilities in Minas Gerais serve interior cities. Restaurants and catering services are transitioning to value-added packages, reducing labor costs by up to 20% and increasing demand for leafy greens and root vegetables. Cold-chain improvements, supported by concessional loans, reduce post-harvest losses from previous levels of 35-40%. Medium-sized cooperatives are implementing audit compliance software to meet standardized good-manufacturing practices and food safety regulations. These market developments expand the customer base and strengthen relationships between processors and institutional buyers.
Diverse Agro-Climatic Zones Enabling Year-Round Output
Brazil's diverse geography, spanning from the equatorial Amazon to temperate Rio Grande do Sul, creates complementary growing seasons that reduce seasonal supply gaps. The Southeast region produces 51% of the country's fruit volume, while the Northeast accounts for 24%. This geographical distribution provides a natural buffer when one region experiences drought or frost. The country's varied climate enables counter-seasonal exports to Northern Hemisphere markets, allowing exporters to fulfill contracts despite weather challenges. Brazilian producers implement crop rotation to maintain soil health, meeting sustainability standards that earn premium prices in European and Japanese markets. The Plano Safra program supports climate-smart farming practices, including mulching, cover crops, and micro-irrigation, which enhance yields and reduce carbon emissions. These factors strengthen Brazil's position as a reliable supplier, particularly during global supply chain uncertainties.
Government Credit Lines for Horticulture Tech
The 2025-26 Plano Safra allocates BRL 89 billion (USD 16.5 billion) for family farms, representing a 55% increase and reducing interest rates to 2-3% for certified horticulture operations[3]. The program provides low-interest loans for drip irrigation systems, precision sprayers, and post-harvest cooling tunnels, making these technologies accessible to small growers. BNDES has distributed BRL 1.7 billion (USD 315 million) for these upgrades, with disbursement rates increasing by 12% in H1 2025[4]. The mechanization helps address rural labor shortages, while improved yields enable equipment cost recovery within five harvests for high-value crops such as grapes and melons. The program includes subsidized insurance with credit packages to protect growers from weather-related risks and ensure stable loan repayment. This initiative reduces the productivity gap between smallholder farmers and large export-oriented estates by improving access to agricultural technology.
Restraints Impact Analysis*
| Restraint | (~) % Impact on CAGR Forecast | Geographic Relevance | Impact Timeline |
|---|---|---|---|
| Inadequate refrigerated logistics and rural roads | -0.7% | National; highest in Northeast | Medium term (2-4 years) |
| High volatility in fertilizer and diesel prices | -0.5% | Nationwide | Short term (≤ 2 years) |
| Labor shortages from rural-urban migration | -0.4% | Southeast and South | Long term (≥ 4 years) |
| Europe deforestation-traceability compliance costs | -0.3% | Amazon fringe exporters | Medium term (2-4 years) |
| Source: Mordor Intelligence | |||
Inadequate Refrigerated Logistics and Rural Roads
Brazil's cold storage facilities are primarily located in coastal population centers, while agricultural production clusters are situated hundreds of kilometers inland. The poor condition of feeder roads increases transit time, and with only 12% of farm-gate trucks equipped with refrigeration, farmers must either accept lower prices or risk product spoilage during peak seasons. While government freight corridors prioritize bulk grain transportation, perishable goods compete for limited cold-chain capacity. Private investment concentrates in high-volume citrus production regions, creating regional disparities that limit market access for small-scale farmers in the Northeast. The Brazil fruits and vegetables market continues to lose 18% of annual production before reaching retail outlets due to inadequate specialized logistics infrastructure.
Labor Shortages from Rural-Urban Migration
The migration of young adults from farms to service sector jobs in Rio de Janeiro and São Paulo has reduced the availability of seasonal workers needed for labor-intensive crops such as tomatoes and strawberries. This labor shortage has led to increased wages, raising production costs, while mechanization remains challenging for delicate fruit harvesting. Although cooperatives have implemented training programs to improve worker productivity, the demographic shift continues. The constrained labor market affects growth strategies, especially for vegetable processors who require steady raw material supplies. The Brazil fruits and vegetables market faces ongoing labor availability challenges until harvesting automation technology improves.
*Our forecasts treat driver/restraint impacts as directional, not additive. The impact forecasts reflect baseline growth, mix effects, and variable interactions.
Segment Analysis
By Commodity: Fruits Lead Value While Vegetables Drive Growth
Fruits dominated the market, accounting for 56.90% of the Brazil fruits and vegetables market share in 2025 through established citrus, mango, and grape supply chains that combine favorable climate conditions with extensive research investment. Citrus processors maintain price stability through long-term contracts, while banana production meets domestic demand with a consistent year-round supply. Tropical fruits, particularly mango and papaya, have capitalized on export opportunities during Northern Hemisphere off-seasons, generating higher unit revenue and increasing the market size at the farm level.
The vegetable segment, though smaller in value share, demonstrates the strongest growth potential with a projected 4.93% CAGR through 2031. According to the Food and Agriculture Organization, tomato production reached 4.1 million metric tons in 2023, supporting processing centers that produce sauces and ready-to-cook products for urban retail markets. Potato production benefits from coordinated planting schedules across three regions, ensuring a continuous supply for food service customers. Onion and garlic production, concentrated among family farms in the South and Northeast regions, benefits from the National Program for the Strengthening of Family Farming (PRONAF) extended credit programs, strengthening smallholder operations. The expansion of fresh-cut vegetable processing adds value to the segment and increases its contribution to the overall Brazil fruits and vegetables market size.

Geography Analysis
The Southeast region holds 45.80% of the Brazil fruits and vegetables market share in 2025, driven by juice-concentrate facilities in São Paulo and greenhouse expansion in Minas Gerais. The region's extensive highway network and proximity to 45 million consumers reduce delivery times, resulting in higher profit margins compared to national averages. The region's innovation hubs host agricultural technology startups, accelerating the implementation of sensors, drones, and data analytics to improve yields and reduce pesticide usage.
The Northeast region is projected to grow at a 5.04% CAGR during 2026-2031. The Petrolina-Juazeiro irrigation center utilizes São Francisco River water through drip irrigation systems to produce high-brix mangoes, seedless grapes, and melons with extended shelf life. The region's proximity to European and North American markets reduces freight time by up to four days compared to Andean competitors. In 2025, public-private initiatives that installed 420 megawatts of solar power have reduced energy costs at packing facilities, improving regional competitiveness.
South Brazil's agricultural sector comprises small and medium-sized family farms that operate through cooperatives. The region's rolling terrain and mild climate support diverse production, including soybeans, corn, wheat, tobacco, dairy, fruits, and vegetables. While traditionally strong in grain production, the region faces challenges from extreme weather events that affect soybean yields and economic stability. The temperate climate enables specialized crop production through cooperative networks. In Paraná, ADM's nutrient facility has increased local input supply by 40%. Rio Grande do Sul benefits from lower night temperatures, which enhance apple and berry color development while reducing tropical pest exposure. The region's rail connections to São Paulo help stabilize delivery costs despite diesel price fluctuations throughout growing seasons.
Regulatory Landscape
Brazil regulates fruits and vegetables through MAPA oversight for plant-origin establishments and export programs, while Anvisa sets food safety rules and pesticide residue requirements. Decree No. 12.709 of October 31, 2025 strengthened official supervision for plant-based products by requiring economic agents to maintain documented self-control programs covering safety, quality, and traceability, which raises compliance expectations across growers, packers, and distributors.
For market access and health compliance, Anvisa began executing a new multi-year cycle of its Pesticide Residue Analysis Program (PARA) in 2026, monitoring a defined basket of plant-based foods that includes garlic, kale, grapes, and pineapple. This monitoring feeds into retail specifications and supplier auditing practices. On the trade side, Portaria SDA/MAPA No. 1.570 of April 8, 2026 updated requirements tied to exports and customs-bonded terminals handling plant-origin products for China. Law No. 15.359 of March 24, 2026 created a national system and unified portal for official export credit support, which can reduce financing friction for export-oriented fruit and vegetable supply chains.
Value Chain Analysis
The value chain starts with input suppliers (seedlings, fertilizers, crop protection, irrigation equipment, and bioinputs), then moves into farm production across diversified regions, including major Southeast and irrigated Northeast clusters. After harvesting and on-farm sorting, produce goes to packinghouses, cold rooms, and processing (fresh-cut and juice-concentrate), before reaching wholesale, retail, foodservice, and export channels. Public programs also shape market structure and transparency: Conab operates Prohort to modernize wholesale markets and track price and volume behavior for key hortigranjeiros (including tomato, potato, onion, banana, orange, apple, papaya, and watermelon), while MIDR runs the Rota da Fruticultura with active poles focused on integrating production, technical assistance, and downstream linkages.
Most constraints show up after harvest. High perishability, uneven rural road quality, and limited refrigerated transport and storage contribute to material losses that are commonly cited around 30% for fruits and vegetables, which tightens margins and reduces the feasibility of long-distance distribution and exports. This aligns with Brazil exporting only a small share of its fruit output (about 2% to 2.5%) even though it is among the largest global producers. To manage these gaps, larger processors and exporters continue to tighten coordination through vertical integration and compliance systems, including traceability, residue monitoring, and packhouse registration, while cooperatives and regional programs work to professionalize aggregation and improve reliability for institutional buyers and export protocols.
Market Opportunities and Future Outlook
Cold chain and compliant post-harvest capability are the most actionable whitespace, given persistent loss rates and the documented gap in refrigerated logistics between inland production clusters and coastal consumption and export gateways. Demand signals for higher-spec products are also becoming clearer through fresh-cut supply chains serving large urban corridors, where processors operate at higher utilization and therefore rely on auditable cold storage, standardized handling, and residue-compliant sourcing. These requirements align with Anvisa monitoring under PARA and MAPA requirements for plant-origin establishments and export registrations.
Financing and compliance infrastructure tied to policy provide workable routes for near-term capacity and process upgrades. The federal government launched the 2026/2027 Plano Safra with BRL 525.1 billion in total credit allocation, and Law 15.359/2026 created a unified system for official export credit support, which supports investments that connect farm output to exporters and processors. MIDR's Rota da Fruticultura and MAPA-aligned quality and traceability frameworks, including mandatory traceability for fresh produce groups under MAPA/Anvisa rules, also favor suppliers that can document origin, pesticide management, and packhouse controls. That creates opportunities for cooperatives and mid-sized growers to scale through shared compliance services, digital traceability, and targeted cooling and packing investments in the Northeast irrigation hubs and Southeast consumption corridors.
Recent Industry Developments
- July 2026: Brazil launched the 2026/2027 Plano Safra with BRL 525.1 billion in total credit allocation, continuing the use of subsidized rural credit to support on-farm investment. The program underpins spending on irrigation, machinery, and post-harvest infrastructure that directly affects productivity and loss reduction in fruits and vegetables. It also reinforces the role of formal credit channels as a key enabler for small and medium producers upgrading to meet traceability and buyer specifications.
- July 2025: The federal government launched Plano Safra 2025-26 with BRL 516.2 billion in credit, emphasizing low-carbon practices and irrigation upgrades relevant to horticulture. The scale of funding increased access to concessional finance for technology adoption across family farming areas and commercial horticulture clusters. This supported broader modernization efforts in cold chain and on-farm efficiency amid input-cost volatility.
- November 2024: Brazil received approval to export table grapes to China after MAPA and Chinese customs authorities established a new protocol. The agreement restricted participation to registered orchards, packing facilities, and cold treatment facilities operating under good agricultural practice requirements. The protocol increased incentives for investment in compliant packhouse infrastructure and traceability systems for export-grade fruit supply chains.
Research Methodology Framework and Report Scope
Market Definition and Coverage
This market is defined as the value and volume of fruits and vegetables consumed in Brazil, covering the movement from farm output through domestic sales and trade flows. Prices and handled volumes are used to translate that activity into market value.
Scope exclusions: We exclude beverages and industrial ingredients where fruits or vegetables are only used as an input (for example, pure juice concentrate used by drink makers).
Segmentation Overview
- By Commodity (Production Analysis (Volume), Consumption Analysis (Volume and Value), Import Analysis (Volume and Value), Export Analysis (Volume and Value), and Price Trend Analysis)
- Fruits
- Citrus (Orange, Lemon, Lime,Tangerines, mandarins, and clementines)
- Banana
- Watermelon
- Grapes
- Pineapples
- Mango
- Apple
- Papayas
- Other Fruits (Cantaloupes and other melons, Avocados, Peaches and nectarines, Strawberries, etc,)
- Vegetables
- Tomato
- Potato
- Onion and Shallots
- Garlic
- Brassicas
- Other Vegetables (Leafy Greens, Carrot, Beans, Eggplant, etc.)
- Fruits
Data Sources, Market Sizing, and Validation
Desk Research
Desk research starts with building a clean picture of supply, movement, and pricing for major fruits and vegetables traded and consumed in Brazil. We rely on public sources such as FAOSTAT and FAO price and supply notes, UN Comtrade and national customs releases for trade values and volumes, Brazil government agriculture statistics and bulletins (for planted area, yields, and crop calendars), and the World Bank and IMF for macro indicators and exchange-rate context.
To ground the model in what is happening on the ground, we also review company filings and investor materials from large growers, packers, and distributors, along with trade association updates, port and logistics releases, and reputable press coverage of harvest conditions and export demand. When needed, paid subscriptions for company financials and news help us confirm expansion plans, asset footprints, and event timelines that can shift volumes or pricing. These examples are not exhaustive, and many other public sources were also checked to collect data, validate assumptions, and clarify open questions.
Primary Interviews and Surveys
Primary work is used to test how the desk inputs behave in real transactions, especially around farmgate to wholesale price spreads, losses in handling, and how seasonality changes supply across Brazil regions. We spoke with a mix of producers, packhouse operators, distributors, retailers, and food service buyers across Brazil so assumptions on traded volumes, import reliance for select items, and typical pricing are confirmed, then tightened where gaps showed up.
Distribution of primary research fieldwork respondents
| Company type | Respondent position |
|---|---|
| Top tier: 36% | CXOs: 13% |
| Mid tier: 46% | Functional/Unit leaders: 39% |
| Smaller Players: 18% | Managers: 48% |
Market-Sizing & Forecasting
Sizing is built using a top-down approach where production and trade data reconstruct the available supply pool. That pool is then adjusted for typical losses and mapped to consumption value using observed price levels across major categories. To keep results realistic, the totals are corroborated with selective bottom-up approximations, such as sampled price per kilogram by commodity times marketed volumes, plus channel checks on wholesale and retail spreads.
Key inputs that shape the model include harvested area and yield trends for key crops, monthly seasonality and weather impacts that influence availability, import and export volumes by product group, domestic price movements by commodity, and logistics constraints that affect spoilage and delivered costs. Forecasting is carried using scenario analysis supported by regression checks on the strongest drivers (income, food inflation, and export pull). The final path is aligned to what interviewees expect for pricing and volume growth. Where a commodity has limited visibility, we use proxy indicators from similar crops and then re-check the implied per-capita consumption and trade balance so the number stays consistent.
Data Validation & Update Cycle
Validation is done in steps, starting with internal cross-checks that compare implied consumption against production plus net imports, followed by price sanity checks against reported ranges and seasonality patterns. When large variances appear, the assumptions are revisited, and follow-up calls are triggered to confirm if the gap came from pricing, losses, or shifts between channels.
Before sign-off, the model and key assumptions are reviewed by another analyst, and the final output is compared with independent signals such as export momentum, inflation patterns, and reported harvest conditions in Brazil. Reports are refreshed annually, with interim updates when material events occur, and a fresh pass is done just before delivery so clients receive the latest updated view.
Mordor Intelligence's Brazil Fruits and Vegetables Market Sizing Compared With Other Published Estimates
Published market sizes for fruits and vegetables in Brazil can look far apart because the included products, the selling channels counted, and the timing of price conversion are not handled the same way by every publisher. Differences also show up when one estimate leans more on retail scan style views, while another is built from supply plus trade reconciliation.
Processed vegetable products and shelf-stable fruit preparations sit outside Mordor Intelligence's scope, which is one reason some published values come in higher when they fold in preserved categories and related packaged sales. Another common gap is whether the estimate is retail-only or includes food service and institutional demand, and then how prices are averaged across seasons when supply swings are strong in Brazil.
Benchmark comparison
| Source | Market Size | Gaps in Research Methodology |
|---|---|---|
| Mordor Intelligence | USD 30.00 B (2025) | |
| Global Consultancy A | USD 25.80 B (2024) | Uses an earlier base year and a channel-led structure that can undercount informal wholesale flows, and it also blends fresh with preserved forms which shifts the price mix versus a fresh-first valuation. |
| Trade Journal B | USD 33.60 B (2029) | Reported as a retail fresh produce projection for a future year, so it can differ due to retail-only coverage, assumed growth rates, and inflation or currency timing embedded in the projection. |
The comparison shows that year selection, channel coverage, and whether preserved formats are included are the main levers behind the spread. By tying the market total back to production, net trade, loss assumptions, and observed price bands, the sizing steps stay repeatable and easier to audit when conditions change.
Key Questions Answered in the Report
How large is the Brazil fruits and vegetables market in 2026?
The value is USD 31.42 billion, with projections of USD 39.59 billion by 2031 at a 4.74% CAGR.
Which commodity group leads sales?
Fruits supply 56.90% of total 2025 spending, anchored by citrus, mango, and grape exports.
What is the fastest-growing segment?
Vegetables are on track for a 4.93% CAGR as fresh-cut demand rises in urban centers.
How are producers financing technology upgrades?
Plano Safra loans and BNDES credit supply subsidized rates as low as 2%, encouraging drip irrigation, cold storage, and precision equipment.
What risks could slow future growth?
Logistics bottlenecks, volatile fertilizer prices, and stringent EU deforestation rules pose downside threats to export margins.