United States FTL Freight Brokerage Market Size and Share
Market Overview
| Study Period | 2020 - 2031 |
|---|---|
| Forecast Data Period | 2026 - 2031 |
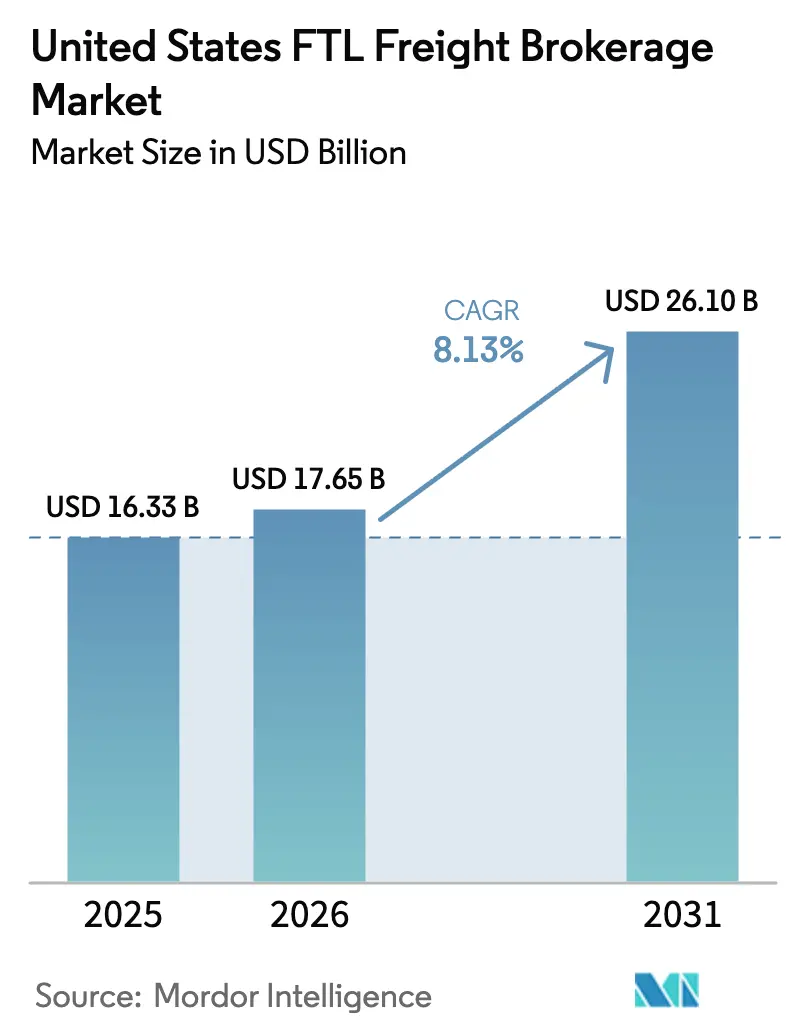
| Base Year Market Size (2025) | USD 16.33 Billion |
| Market Size (2026) | USD 17.65 Billion |
| Market Size (2031) | USD 26.10 Billion |
| Growth Rate (2026 - 2031) | 8.13% CAGR |
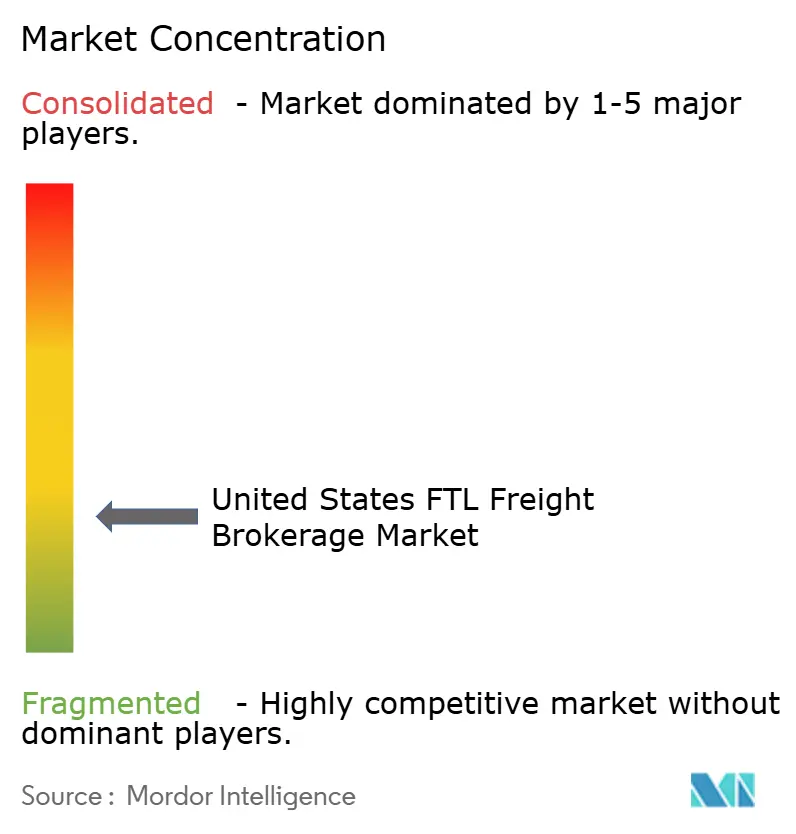
| Market Concentration | Low |
Major Players *Disclaimer: Major Players sorted in no particular order Image © Mordor Intelligence. Reuse requires attribution under CC BY 4.0. | |
United States FTL Freight Brokerage Market Analysis by Mordor Intelligence
The United States FTL freight brokerage market size is expected to grow from USD 16.33 billion in 2025 to USD 17.65 billion in 2026 and is forecast to reach USD 26.10 billion by 2031 at 8.13% CAGR over 2026-2031.
Artificial-intelligence pricing engines, shipper environmental mandates, and biologics-driven cold-chain requirements are redefining broker value propositions. Large shippers now demand verified low-emission carrier pools, pushing brokers to curate fleets certified under EPA SmartWay and emerging zero-emission truck programs. In pharmaceuticals, FDA rules for gene-therapy shipments require sub-zero compliance data, forcing brokers into credential-based differentiation and IoT-enabled temperature auditing. Cloud-native transportation-management systems (TMS), meanwhile, give small shippers direct carrier connectivity, eroding dependence on legacy broker relationships yet simultaneously expanding the total addressable load pool for brokers that integrate via open APIs. Cross-border trade under CUSMA is accelerating dedicated automotive and agriculture lanes that reward brokers able to manage complex customs and capacity guarantees.
Key Report Takeaways
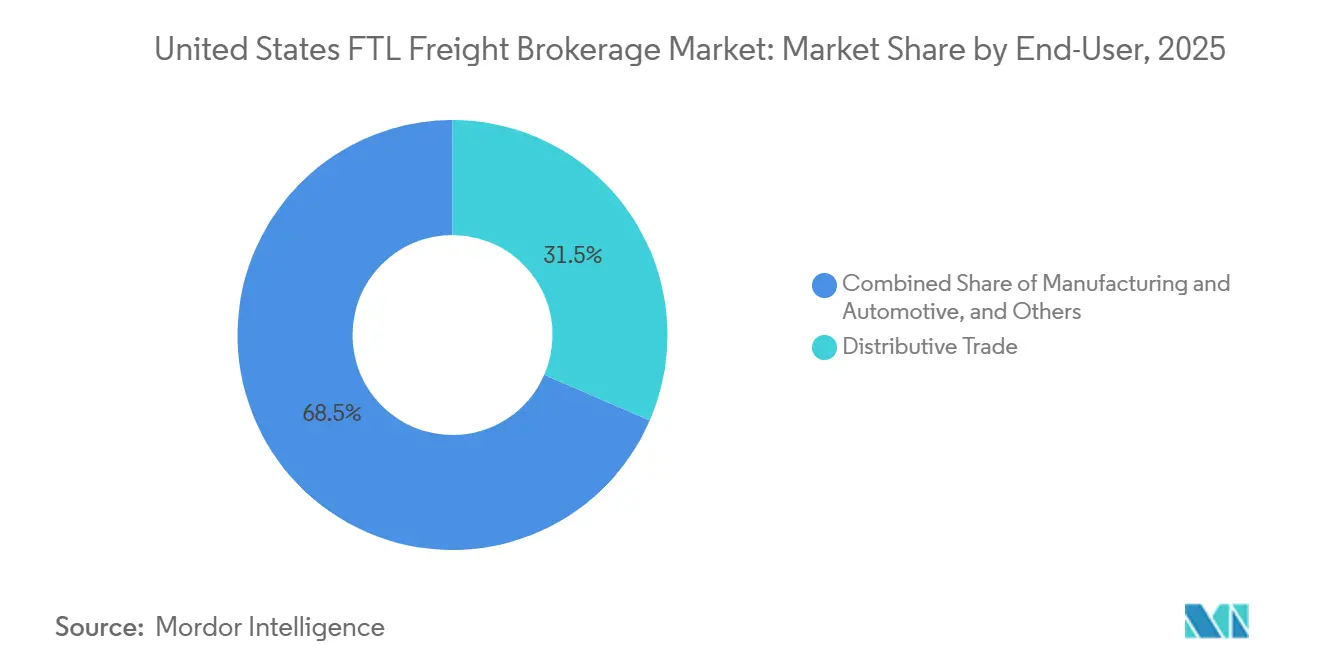
- By end user, distributive trade held 31.51% of the United States FTL freight brokerage market share in 2025, while construction is advancing at a 10.18% CAGR through 2031, the fastest among end users.
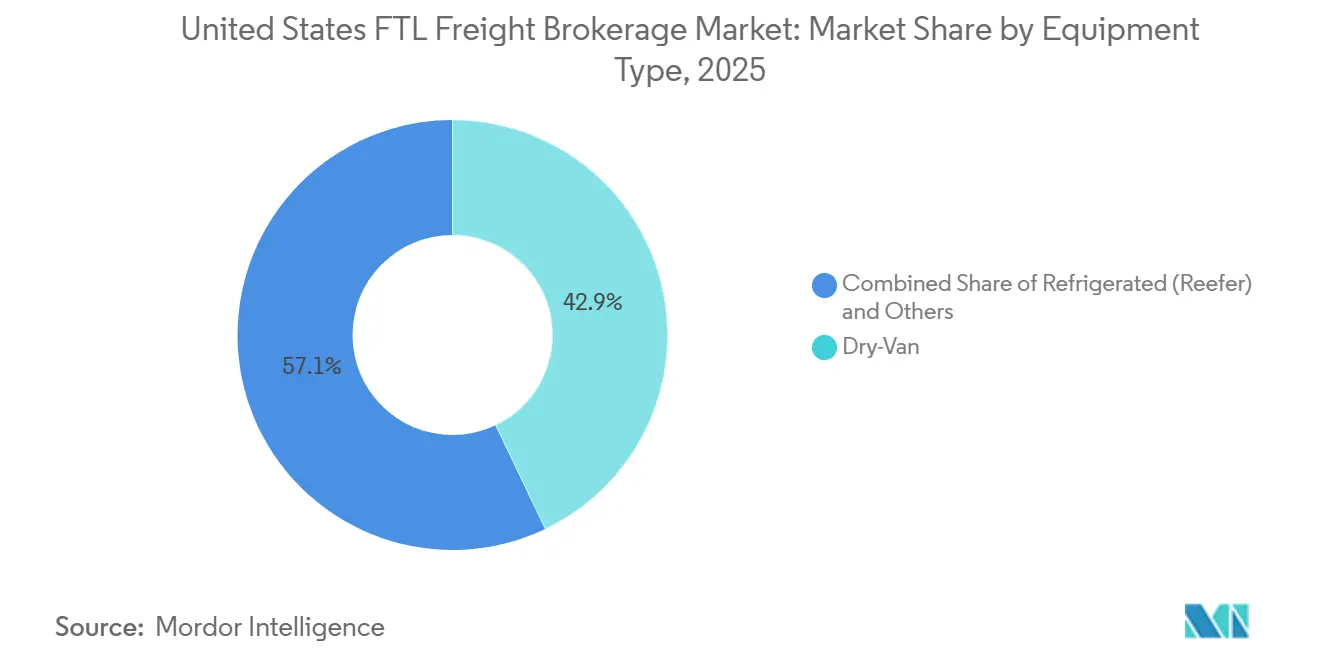
- By equipment, dry-van equipment commanded a 42.89% share of the United States FTL freight brokerage market size in 2025, while flatbed and heavy-haul equipment is projected to expand at a 11.50% CAGR over the forecast horizon.
- By freight, general freight captured 77.80% of the United States FTL freight brokerage market size in 2025; refrigerated freight is growing at a 12.59% CAGR through 2031.
- By region, the South is forecast to register a 10.83% CAGR, outpacing all other United States regions and overtaking the Midwest’s 24.02% 2025 share by the end of the period.
Note: Market size and forecast figures in this report are generated using Mordor Intelligence’s proprietary estimation framework, updated with the latest available data and insights as of 2026.
United States FTL Freight Brokerage Market Trends and Insights
Drivers Impact Analysis*
| Driver | (~) % Impact on CAGR Forecast | Geographic Relevance | Impact Timeline |
|---|---|---|---|
| AI-driven dynamic-pricing tools expanding broker margins | +1.6% | National, tech-forward brokerages | Medium term (2-4 years) |
| CUSMA-fueled United States–Canada cross-border freight growth | +1.3% | Northern border states, Great Lakes corridor | Long term (≥ 4 years) |
| ESG mandates spurring demand for low-carbon truckload services | +1.1% | National, strongest in California and the Northeast | Long term (≥ 4 years) |
| Biologics boom accelerating temperature-controlled TL moves | +1.4% | National, near pharmaceutical hubs | Medium term (2-4 years) |
| Inland port and intermodal ramp build-outs lifting dray-TL volumes | +0.9% | Regional, inland logistics hubs | Long term (≥ 4 years) |
| Cloud-based TMS adoption by SMB shippers is widening broker reach | +1.0% | National, mid-market segments | Short term (≤ 2 years) |
| Source: Mordor Intelligence | |||
AI-Driven Dynamic-Pricing Tools Expanding Broker Margins
Machine-learning engines now recalculate spot rates every 15 minutes after ingesting fuel indexes, weather alerts, and real-time electronic-logging-device feeds. Brokers using these tools can identify capacity tightening 48-72 hours earlier than manual teams, allowing proactive carrier sourcing and bid adjustments that lift net margins while stabilizing on-time performance during volatility. Technology levels the field for mid-scale firms that lack extensive carrier contracts yet excel in data science. As more platforms adopt similar algorithms, transparency in high-volume lanes compresses rate spreads, making service quality and specialized compliance the next frontier of competition. Cybersecurity overlays, including multi-factor authentication and endpoint detection, have become integral to algorithmic platforms because ransomware attacks have disrupted multiple digital brokerages in the past two years.
CUSMA-Fueled United States–Canada Cross-Border Freight Growth
Tariff removal on automotive components and select agricultural goods under CUSMA has intensified shipments through Detroit-Windsor, Buffalo-Niagara, and Pacific Northwest gateways. Automotive plants now routinely shuttle engines, stampings, and trim kits across borders, prompting brokers to sign annual capacity contracts with asset-based carriers to protect just-in-time inventories. Seasonal grain exports moving north into Canadian processors create fourth-quarter demand spikes that fetch premium rates. Because cross-border freight requires advance commercial manifests and electronic customs filings, brokers with in-house customs-brokerage licenses earn 15-20% higher yields than domestic loads. Bottlenecks persist at legacy infrastructure chokepoints, compelling brokers to pre-book return-trip capacity and position drivers at staging yards to meet strict delivery windows[1]Cybersecurity and Infrastructure Security Agency, “Transportation Systems Sector,” cisa.gov .
ESG Mandates Spurring Demand for Low-Carbon Truckload Services
Fortune 500 sustainability targets now encompass Scope 3 emissions, obligating logistics managers to document freight carbon intensity. Brokers able to report gram-per-mile emissions by lane, backed by EPA SmartWay carrier scores, win multi-year contracts despite 2-3% rate premiums. California’s Advanced Clean Trucks rule accelerates electric-truck adoption, and early-compliant brokers are aggregating limited zero-emission capacity in the San Joaquin Valley and Los Angeles basins. Carbon-accounting dashboards embedded in broker portals let shippers simulate modal shifts and offset purchases, cementing brokerage roles as data stewards rather than simple matchmakers. Limited charging infrastructure and a thin electric-truck supply chain temper near-term scale, yet pilot programs around port drayage and short-haul distribution signal future volume shifts.
Biologics Boom Accelerating Temperature-Controlled TL Moves
The FDA requires continuous temperature logs and chain-of-custody proof for cell- and gene-therapy shipments that may travel below -60 °C. Brokers have responded by integrating IoT probes, blockchain ledgers, and 24×7 control-tower monitoring, enabling automatic diversion to contingency cold rooms when excursions threaten product integrity. Reefer carriers equipped with redundant refrigeration units now command 40-60% rate up-charges, a premium that also covers heightened cargo-insurance deductibles. Limited qualified capacity means brokers must reserve equipment weeks in advance and maintain on-call technicians for in-transit validation. Pharmaceutical manufacturers increasingly bundle warehousing and transportation contracts, favoring brokers able to coordinate GMP-certified cross-dock facilities.
Restraints Impact Analysis*
| Restraint | (~) % Impact on CAGR Forecast | Geographic Relevance | Impact Timeline |
|---|---|---|---|
| Surging cargo-insurance premiums eroding broker profitability | -1.2% | National, high-theft corridors | Short term (≤ 2 years) |
| Labor-classification reforms threatening broker–carrier contracts | -1.0% | National, early in California & the Northeast | Medium term (2-4 years) |
| Escalating cyber-risks to digital freight platforms | -0.8% | National, digital-native brokers | Medium term (2-4 years) |
| Highway congestion and aging infrastructure are inflating transit risk | -0.9% | National, urban corridors | Long term (≥ 4 years) |
| Source: Mordor Intelligence | |||
Surging Cargo-Insurance Premiums Eroding Broker Profitability
Organized theft rings targeting electronics and pharmaceuticals have lifted cargo-insurance premiums by 18-22% annually, with underwriters demanding GPS geofencing, secure parking, and driver biometric checks as conditions of coverage. Many small brokers now carry USD 50,000-plus deductibles, exposing them to catastrophic loss on single high-value loads. Shippers unwilling to absorb escalations pivot to asset carriers with embedded security, cutting brokers out of lucrative freight segments. Some brokers experiment with captives and self-insurance pools, but capital requirements limit participation to top-tier firms. Heightened security protocols also extend pickup dwell times, triggering detention that further compresses margins.
Labor-Classification Reforms Threatening Broker–Carrier Contracts
Pending federal proposals mirroring California’s AB5 statute could reclassify independent owner-operators as employees, imposing payroll taxes and benefit obligations on brokers that directly dispatch small fleets. Contingency clauses in legacy contracts rarely anticipate such a shift, leaving brokers exposed to retroactive liabilities. Larger firms are piloting “two-check” models wherein carriers are paid for both equipment lease and labor service, but tax treatment remains uncertain. Carriers unwilling to risk compliance disruptions migrate capacity to asset-based freight networks, tightening supply for brokers during seasonal peaks. Consolidation pressures rise as mid-market brokers seek a sale or partnership to afford legal and HR overhead[2]U.S. Department of Labor, “FLSA Misclassification,” dol.gov .
*Our forecasts treat driver/restraint impacts as directional, not additive. The impact forecasts reflect baseline growth, mix effects, and variable interactions.
Segment Analysis
By End-User: Construction Accelerates While Distributive Trade Anchors Demand
Construction-related freight, projected to grow at a 10.18% CAGR through 2031, is the fastest-expanding segment of the United States full-truck-load market share, while distributive trade retained a dominant 31.51% share of the 2025 FTL freight brokerage market due to omnichannel retail and wholesale flows that generate steady dry-van volumes. The construction surge is fueled by Infrastructure Investment and Jobs Act allocations for bridges, highways, and renewable-energy projects, which require specialized flatbed moves and multi-year procurement of steel beams, concrete panels, and modular housing kits. Brokers capitalize on this by locking in flatbed capacity annually or per project, while tight project timelines make detention penalties steep, prompting the use of on-site coordinators and live-tracking tools to synchronize material delivery with site readiness.
Robust homebuilding in Texas, Florida, and the Carolinas further underpins flatbed demand, while distributive trade remains resilient, with e-commerce fulfillment centers providing baseline volume even during slower consumption periods. Manufacturing and automotive freight benefit from tariff-free cross-border component flows, shortening cycle times and increasing “milk-run” lane density. Agriculture and forestry produce seasonal reefer and bulk moves, with synchronized harvest calendars allowing brokers to cycle equipment from produce regions to grain belts, boosting annual utilization. Energy-sector activity in the Permian and Bakken adds sporadic oversize loads that require high-skilled route engineering, creating a defensive moat for niche brokers against generalized digital platforms.


By Equipment Type: Specialized Haul Outpaces Commodity Dry-Van
Dry-van trailers, which held a 42.89% share of the United States full-truck-load freight brokerage market size in 2025, remain the backbone of consumer-goods, paper-product, and packaged-food transportation, while flatbed and heavy-haul equipment is poised for an 11.50% CAGR driven by infrastructure megaprojects and wind-turbine installations that require open-deck capacity, police escorts, and pilot cars. Brokers specializing in oversize loads leverage proprietary route databases tracking bridge clearances and permit lead times, converting expertise into 25–35% rate premiums and above-average client retention. Refrigerated units are expanding as gene-therapy and fresh-meal-kit shippers demand integrity guarantees, prompting reefer carriers to deploy dual-temp zones and satellite telemetry, further raising barriers to entry.
Tankers and bulk hoppers transport petrochemicals, grain, and cement, though hazmat endorsements and specialized safety training limit the carrier pool. Emerging carbon-capture projects signal future tanker demand for liquid CO₂, creating a niche growth opportunity. Overall, the equipment mix reflects the duality of stable retail volumes and cyclical capital investment, allowing brokers who hedge across both segments to smooth earnings over economic cycles while capturing upside from capex-driven surges[3]U.S. Census Bureau, “Metro-to-Metro Migration,” census.gov .
By Freight Type: Cold Chain Expands as General Freight Stabilizes
General freight, which accounted for 77.80% of the United States full-truck-load freight brokerage market share in 2025, remains the backbone of the market, while refrigerated freight is accelerating at a 12.59% CAGR through 2031. Cold-chain shipments command rate premiums due to liability exposure and compliance requirements, particularly for biologics that require data-logger validation at 15-minute intervals. Meal-kit and online grocery retailers add incremental volume, boosting lane density between produce belts and urban fulfillment centers. Brokers succeeding in this segment deploy integrated continuous-monitoring dashboards that automatically trigger carrier intervention when temperature thresholds are breached, reducing spoilage claims and strengthening long-term contracts.
Ambient general freight continues to provide stability, cushioning brokers during seasonal fluctuations in cold-chain demand. High-mix consumer SKUs benefit from consolidation services, where brokers pool less-than-truckload orders into dedicated full-truck runs, lowering per-unit shipping costs. The combination of stable ambient flows and high-margin cold-chain volumes enables balanced portfolio management, allowing brokers to redeploy capacity seasonally without incurring significant repositioning costs.
Geography Analysis
The South is forecast to post a 10.83% CAGR, set to eclipse the Midwest’s 24.02% 2025 share by 2031 as manufacturers gravitate toward Texas, Tennessee, and the Carolinas for tax incentives and port proximity. Texas, now the fastest-growing origin for outbound truckload tonnage, benefits from petrochemical exports through Houston and accelerating electric-vehicle assembly in Austin. Tennessee’s I-40 corridor hosts new tire, appliance, and battery plants, creating balanced east-west lanes that optimize driver hours. The Carolinas leverage Charleston and Wilmington port expansions, channeling import parts into Raleigh-Durham tech clusters and Greenville auto plants.
The Midwest retains critical mass in automotive and agricultural production. Detroit-Chicago freight triangles sustain high-density lanes ideal for dynamic pricing, despite an aging driver workforce that pressures capacity during harvest peaks. Illinois grain moves south to Gulf terminals and north to Canadian mills, enabling brokers to sync seasonal reefer backhauls with bulk dry-van heads. Chicago’s intermodal ramps still inject dray demand, although rising chassis shortages have elongated turn-times by 12-18 hours in peak season.
On the West Coast, LA-Long Beach congestion and strict emissions mandates raise drayage costs but spur inland routing to Phoenix and Salt Lake City, where fulfillment hubs are less land-constrained. California’s zero-emission drayage targets accelerate electric-truck pilots, but limited charging infrastructure restricts lane length. The Northeast exhibits slower growth, yet its dense consumption base offers consistent high-value electronics and pharmaceutical freight from New Jersey’s life-sciences corridor into Boston labs. Stringent winter weather requires contingency planning, and brokers often embed snow-route premiums into spot quotes to cover storm-related detention.
Competitive Landscape
The United States FTL freight brokerage market hosts thousands of federally licensed intermediaries, yet capital demands for AI platforms, cybersecurity, and ESG compliance are driving consolidation. RXO’s USD 1.025 billion purchase of Coyote Logistics enlarged its carrier universe and embedded real-time pricing engines capable of refreshing 350,000 lane rates each day, compressing response times to under five minutes for contracted shippers. J.B. Hunt’s USD 75 million technology upgrade expanded API endpoints that now push dynamic tenders directly into shipper TMS portals, blurring the line between asset and non-asset offerings. Schneider’s acquisition of Cowan Systems fortified dedicated capacity in the Southeast, strengthening its bid for construction freight tied to Gulf Coast refinery expansions.
Mid-size brokers defend niches in temperature-controlled pharmaceuticals, cross-border compliance, or oversize heavy-haul, where deep carrier vetting and permit expertise deter digital marketplaces that rely on broader density. These specialists deploy blockchain-based chain-of-custody ledgers or in-house permit bureaus to retain premium yields. Start-ups pursuing a pure platform model face margin dilution from double-brokering fraud and escalating cyber-risk insurance, leading some to adopt hybrid staffing that reinstates manual carrier verification. Across the board, market leaders advertise carbon-tracking dashboards and SmartWay scorecards to meet RFP sustainability clauses, illustrating how compliance data has become table stakes rather than a differentiator.
Expect continued M&A as cost inflation in technology, insurance, and legal compliance pushes sub-USD 150 million-revenue brokers to seek scale partners. Private-equity activity remains high because recurring brokerage margins, though volatile, generate strong cash flow when paired with automated payables and receivables cycles shortened by smart contracts. Nonetheless, broker valuations increasingly hinge on proprietary datasets and cybersecurity maturity, not merely gross load counts[4]RXO Investor Relations, “RXO Completes Acquisition of Coyote Logistics,” rxo.com .
United States FTL Freight Brokerage Industry Leaders
C.H. Robinson
J.B. Hunt Transport Services
Total Quality Logistics
Landstar System
WWEX Group (Worldwide Express)
- *Disclaimer: Major Players sorted in no particular order

Recent Industry Developments
- January 2026: Werner completed the acquisition of dedicated trucking provider FirstFleet, Inc. for approximately USD 245 million.
- January 2026: Echo signed a definitive acquisition agreement to buy Reno-based ITS Logistics, a growing 3PL and freight broker, creating a combined platform with approximately USD 5.4 billion pro-forma 2025 revenue. Deal expected to close in H1 2026, subject to regulatory approvals.
- November 2025: Uber Freight expanded its commercial partnership with Better Trucks (last-mile delivery network) to enhance coverage across the United States. population centers and integrate routing/sortation technologies.
- May 2025: C.H. Robinson launched the LoadPay instant access cash advance feature for carriers to improve cash flow and reduce payment delays on the brokerage platform.


United States FTL Freight Brokerage Market Report Scope
| Manufacturing And Automotive |
| Oil And Gas, Mining, And Quarrying |
| Agriculture, Fishing, And Forestry |
| Construction |
| Distributive Trade |
| Other End Users |
| Dry-Van |
| Refrigerated (Reefer) |
| Flatbed / Heavy-haul |
| Tanker / Bulk |
| Specialized / Over-dimension |
| General Freight |
| Refrigerated Freight |
| Northeast |
| Midwest |
| South |
| West |
| By End-User | Manufacturing And Automotive |
| Oil And Gas, Mining, And Quarrying | |
| Agriculture, Fishing, And Forestry | |
| Construction | |
| Distributive Trade | |
| Other End Users | |
| By Equipment Type | Dry-Van |
| Refrigerated (Reefer) | |
| Flatbed / Heavy-haul | |
| Tanker / Bulk | |
| Specialized / Over-dimension | |
| By Freight Type | General Freight |
| Refrigerated Freight | |
| By U.S. Region | Northeast |
| Midwest | |
| South | |
| West |


Key Questions Answered in the Report
How fast is the United States FTL freight brokerage market expected to grow between 2026 and 2031?
The market is forecast to expand at an 8.13% CAGR, climbing from USD 17.65 billion in 2026 to USD 26.10 billion by 2031.
Which end-user segment is projected to record the highest growth through 2031?
Construction loads are set to rise at a 10.18% CAGR, driven by the Infrastructure Investment and Jobs Act funding and related flatbed demand.
Why are refrigerated loads gaining share in United States full-truckload brokerage?
Gene therapy, biologics, and fresh food e-commerce require sub-zero and tightly monitored transport, propelling refrigerated freight at a 12.59% CAGR and commanding rate premiums.
What regional shift is shaping future freight corridors in the United States?
The South is advancing at a 10.83% CAGR as manufacturers relocate to Texas, Tennessee, and the Carolinas, gradually overtaking the Midwest’s 2025 share.
How are AI-driven pricing tools affecting broker margins?
Algorithms that refresh lane rates every 15 minutes let brokers spot capacity shifts up to 72 hours sooner than manual teams, supporting 12-18% margin expansion on select lanes.
Which key risk could squeeze profitability for brokers in the near term?
Cargo-insurance premiums are climbing 18-22% annually due to organized theft, forcing brokers to absorb higher deductibles or pass costs to shippers.
Page last updated on:


