Europe Freight Brokerage Services Market Size and Share
Market Overview
| Study Period | 2020 - 2031 |
|---|---|
| Forecast Data Period | 2026 - 2031 |
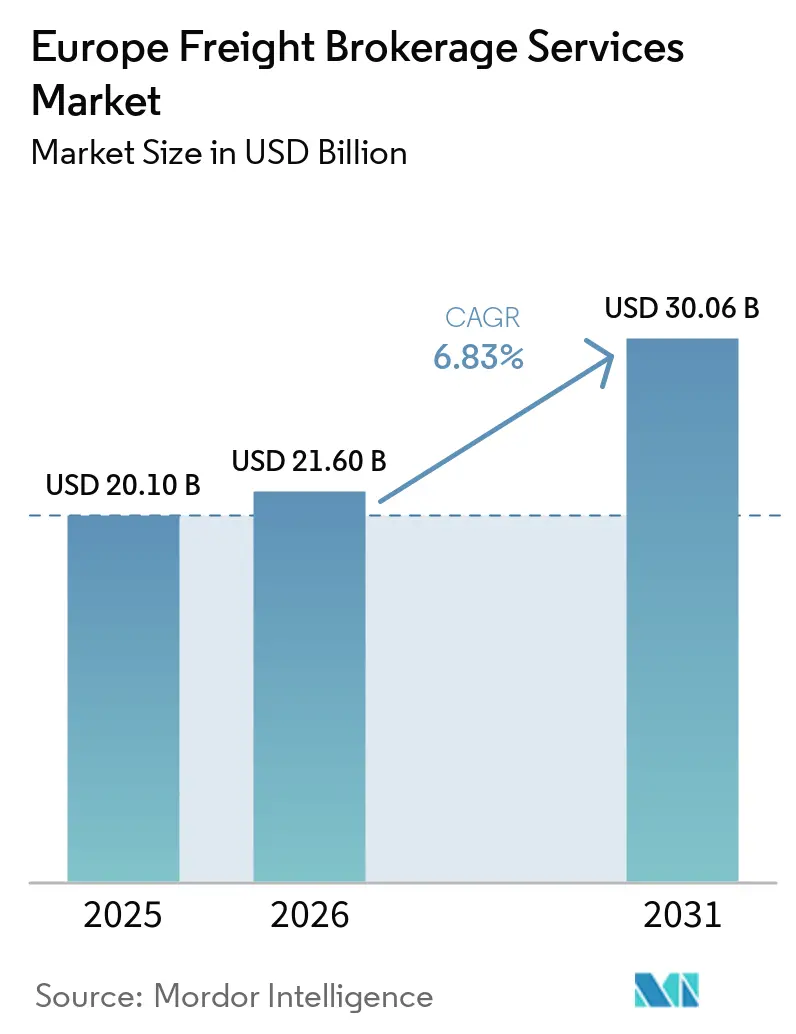
| Base Year Market Size (2025) | USD 20.10 Billion |
| Market Size (2026) | USD 21.60 Billion |
| Market Size (2031) | USD 30.06 Billion |
| Growth Rate (2026 - 2031) | 6.83% CAGR |
| Market Concentration | Medium |
Major Players *Disclaimer: Major Players sorted in no particular order Image © Mordor Intelligence. Reuse requires attribution under CC BY 4.0. | |
Europe Freight Brokerage Services Market Analysis by Mordor Intelligence
The Europe freight brokerage market size is expected to increase from USD 20.10 billion in 2025 to USD 21.60 billion in 2026 and reach USD 30.06 billion by 2031, growing at a 6.83% CAGR over 2026-2031.
Manufacturing reshoring across Central Europe is re-routing freight volumes toward intra-EU lanes, while the EU-wide rollout of electronic consignment notes is accelerating transaction velocity and audit-trail transparency. Venture-capital funding is amplifying platform consolidation, allowing digital brokers to scale faster than traditional relationship-based operators. Demand for temperature-controlled capacity is rising because of biopharmaceutical production clusters, prompting brokers to specialize in GDP-compliant cold-chain services. At the same time, urban congestion charges and low-emission zones are fueling investment in electric vehicles for local deliveries, changing cost structures inside the Europe freight brokerage market.
Key Report Takeaways
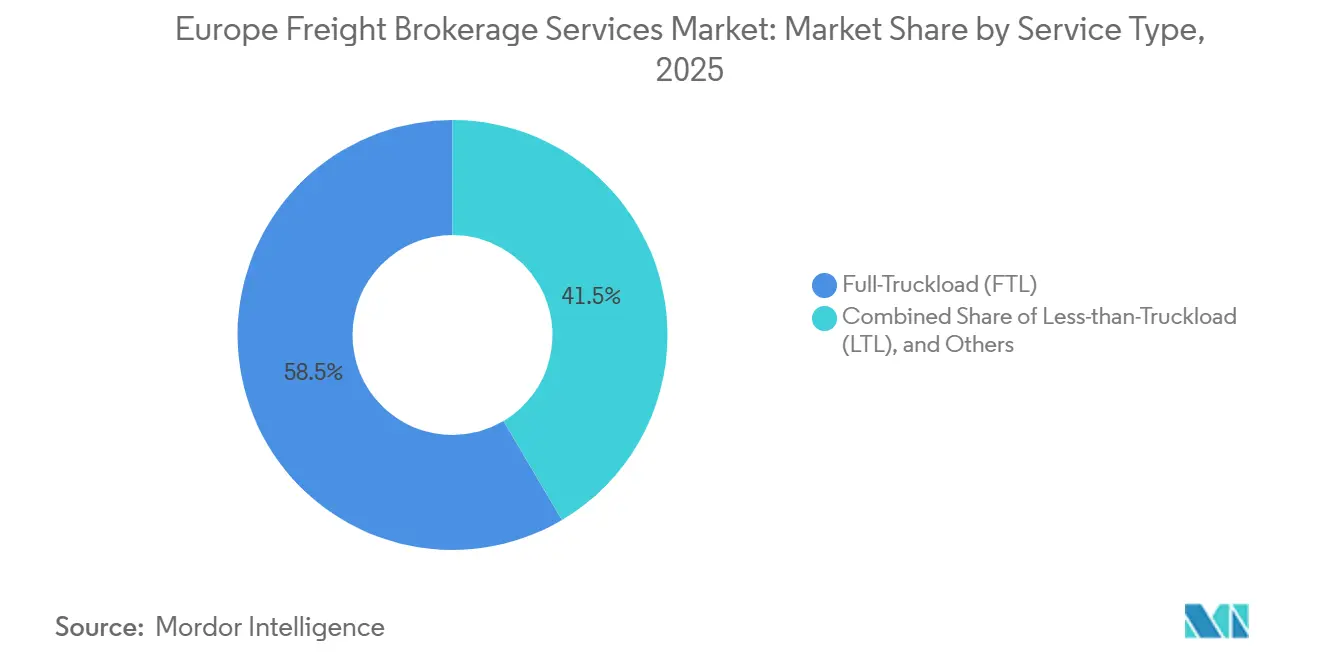
- By service, full-truckload held 58.45% of the Europe freight brokerage market share in 2025, whereas less-than-truckload is advancing at an 8.75% CAGR through 2031.
- By haul length, regional operations accounted for 48.12% of the Europe freight brokerage market size in 2025, and local deliveries under 100 miles are expanding at 9.89% CAGR through 2031.
- By equipment type, refrigerated vans captured 9.57% CAGR between 2026 and 2031, while dry vans retained 41.66% of the Europe freight brokerage market size in 2025.
- By business model, digital platforms posted a 23.64% CAGR, challenging traditional brokers that still controlled 52.71% of the Europe freight brokerage market share in 2025.
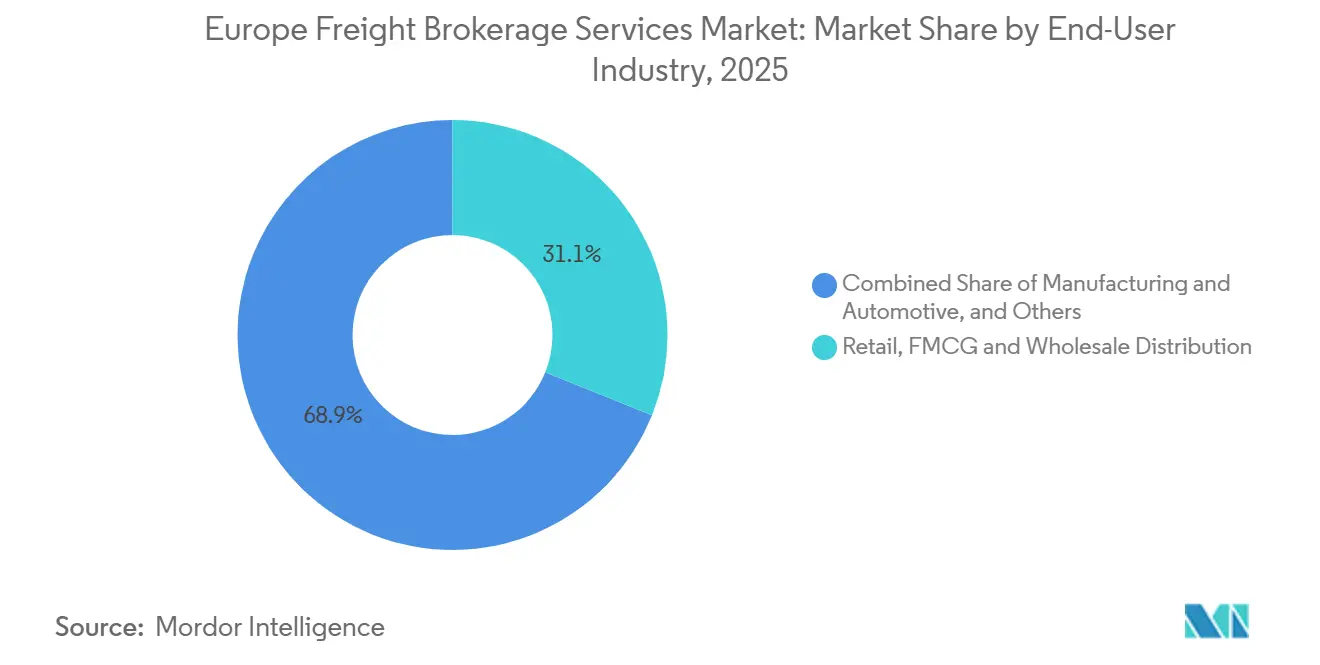
- By end-user industry, retail, FMCG & wholesale distribution accounted for 31.08% of the Europe freight brokerage market size in 2025, and e-commerce & 3PL fulfillment are expanding at a CAGR of 15.68% through 2031.
- By customer size, large enterprises accounted for 57.99% of Europe freight brokerage market share in 2025, and small enterprises are expanding at a CAGR of 11.70% through 2031.
- By country, Germany led with a 12.67% share in 2025, whereas the Netherlands is projected to post a 6.92% CAGR up to 2031.
Note: Market size and forecast figures in this report are generated using Mordor Intelligence’s proprietary estimation framework, updated with the latest available data and insights as of January 2026.
Europe operates as part of an interconnected international environment rather than as a self-contained unit. The freight brokerage services market research by Mordor Intelligence places together all major regional developments across the globe within that wider frame.
Europe Freight Brokerage Services Market Trends and Insights
Drivers Impact Analysis*
| Driver | (~) % Impact on CAGR Forecast | Geographic Relevance | Impact Timeline |
|---|---|---|---|
| Reshoring-driven surge in intra-EU manufacturing | +1.9% | Germany, Poland, the Czech Republic | Medium term (2-4 years) |
| EU-wide rollout of electronic freight documents | +1.4% | EU-27 corridors, strongest in Western Europe | Short term (≤ 2 years) |
| AI-driven dynamic pricing | +1.1% | Netherlands, Nordics, Germany | Short term (≤ 2 years) |
| Cold-chain demand from mRNA and biopharma logistics | +0.8% | Belgium, Netherlands, Switzerland, Ireland | Medium term (2-4 years) |
| Urban micro-fulfillment hubs | +1.2% | London, Paris, Berlin, Amsterdam | Short term (≤ 2 years) |
| Venture-capital-fuelled consolidation | +0.9% | Pan-European tech ecosystems | Medium term (2-4 years) |
| Source: Mordor Intelligence | |||
Reshoring-Driven Surge in Intra-EU Manufacturing Freight
Automotive and electronics producers are relocating capacity from Asia into Poland and Czechia, increasing round-trip hauls on east-west corridors. Waberer’s recorded EUR 757.5 million (USD 892.5 million) revenue in 2024, up 6.5%, after adding rail logistics services that anchor just-in-time parts flows for factories in the Visegrad region. Brokers that can secure predictable capacity across these lanes gain pricing power because plant schedules tolerate minimal variance. However, they must also manage border-crossing rules on cabotage, driver work-hours, and CO₂-based tolls, which differ by country.
EU-Wide Rollout of Electronic Freight Documents (eCMR)
Thirty-four European states now recognize eCMR as legal proof of delivery, trimming paperwork delays at borders and enabling brokers to bill faster. Transporeon embedded eCMR into its Freight Marketplace in April 2025, allowing forwarders to tender spot loads and capture electronic signatures in real time. For LTL brokers that juggle multiple hand-offs per trip, automated document workflows lower administrative costs per pallet and strengthen cash-flow cycles[1]Transporeon, “Marketplace Expansion Press Release,” freightweek.org.
AI-Driven Dynamic Pricing Unlocks Hidden Lane Profitability
Machine-learning engines ingest historical rates, diesel indices, and telematics to suggest premiums for time-sensitive or imbalance lanes. After acquiring C.H. Robinson’s European arm in 2025, Sennder scaled an AI tool across 40,000 trucks, reducing empty kilometers by 12% in pilot corridors[2].Sennder, “Post-Acquisition Integration Brief,” sennder.com Carriers benefit from steadier utilization, while brokers capture margin on backhauls once deemed non-commercial.
Booming Cold-Chain Demand from mRNA and Biopharma Logistics
Belgium and the Netherlands host new mRNA vaccine fill-finish plants that ship APIs at -20 °C, lifting refrigerated van demand. GDP rules require continuous temperature logs, so brokers must integrate IoT sensors that alert shippers to deviations. Compliance investment raises switching costs, letting qualified brokers charge premium fees and secure multi-year contracts with pharmaceutical consignors.
Restraints Impact Analysis*
| Restraint | (~) % Impact on CAGR Forecast | Geographic Relevance | Impact Timeline |
|---|---|---|---|
| Diesel & AdBlue price volatility | -1.1% | Pan-European long-haul operations | Short term (≤ 2 years) |
| EU supply-chain due-diligence law | -0.7% | EU-27, global supply chains | Medium term (2-4 years) |
| Escalating cyber-attacks on digital platforms | -0.5% | High-adoption markets | Short term (≤ 2 years) |
| Persisting cross-border toll heterogeneity | -0.6% | Multi-country routes | Long term (≥ 4 years) |
| Source: Mordor Intelligence | |||
Diesel & AdBlue Price Volatility Compresses Brokerage Spreads
Fuel spikes narrow margins between fixed customer quotes and carrier invoices. Germany’s new CO₂-indexed truck toll compounds cost unpredictability, pushing brokers to introduce floating fuel surcharges that some shippers resist. Smaller intermediaries, unable to hedge exposure, are selling to well-capitalized groups.
EU Supply-Chain Due-Diligence Law Raises Compliance Overhead
The Corporate Sustainability Due Diligence Directive obliges brokers to verify subcontractor labor and emissions standards. Kuehne + Nagel spent CHF 40 million on ESG auditing tools in 2024, signaling the scale of required investment. Compliance complexity favors large players that can amortize legal and tech costs.
*Our forecasts treat driver/restraint impacts as directional, not additive. The impact forecasts reflect baseline growth, mix effects, and variable interactions.
Segment Analysis
By Service: LTL Consolidation Outpaces FTL Dominance
Full-truckload retained 58.45% of the Europe freight brokerage market share in 2025, anchored by predictable factory-to-DC routes and time-critical deliveries. Less-than-truckload, however, is projected to expand at 8.75% CAGR, propelled by e-commerce parcelization and the economics of load pooling that improve trailer fill rates. Digital platforms excel in LTL because algorithms identify consolidation points humans overlook, compressing pickup-to-delivery cycles.
Brokers increasingly run hybrid models, blending contracted FTL for predictable lanes with spot LTL to absorb surplus capacity. Pharmaceutical shippers often allocate ambient FTL but divert temperature-sensitive pallets into certified LTL networks to control cost, reinforcing the strategic need for brokers to manage both service types without breaking chain-of-custody protocols. As APIs proliferate, shippers expect instant access to both FTL and LTL quotes inside the same dashboard, further blurring operational boundaries inside the Europe freight brokerage market.


By Equipment/Trailer Type: Cold-Chain Specialization Commands Premium
Dry vans delivered 41.66% of Europe freight brokerage market size, thanks to versatility and asset availability. Yet refrigerated vans are on a 9.57% CAGR trajectory through 2031 as vaccine, insulin, and fresh-food flows normalize at elevated baselines. The Brokers that validate reefer sensor data and provide exception dashboards earn premium margins because regulatory fines for temperature excursions can wipe out entire shipment profits.
Flatbed and step-deck trailers remain cyclical, tied to construction starts and infrastructure funding. Tanker demand grows modestly with chemicals and edible oils, but high safety training costs act as a barrier to entry. Specialization decisions therefore, hinge on whether brokers seek volume stability or margin premium, a trade-off increasingly visible as the Europe freight brokerage market diversifies cargo profiles.
By Haul Length: Urban Delivery Networks Reshape Route Economics
Regional hauls of 100-500 miles accounted for 48.12% of Europe freight brokerage market size because they align with Europe’s dense city pattern and overnight rest regulations. Local delivery under 100 miles, however, is the fastest-growing slice at 9.89% CAGR. Urban consolidation centers near Paris and Amsterdam dispatch multiple same-day loops that require algorithmic route sequencing and electric van fleets.
Long-haul road over 500 miles faces modal substitution as shippers pivot to rail or short-sea lanes for CO₂ savings. Brokers respond by offering multimodal quotes that mix truck drayage with rail main-legs, securing emission reductions while protecting transit time.
By Business Model: Platform Economics Challenge Relationship Models
Traditional brokerage still held 52.71% of 2025 turnover, proof that human intervention remains vital for complex or high-value cargo. Digital platforms, logging 23.64% CAGR, attract SMEs with instant pricing and paperless booking. The Europe freight brokerage industry is witnessing convergence where legacy houses license SaaS load-matching tools, while pure-play tech firms hire subject-matter experts to handle exception freight.
Asset-based brokers offer guaranteed capacity but carry depreciation risk in downturns, whereas agent models enable geographic reach without fleet ownership. Shippers increasingly ask for carbon dashboards and predictive ETAs, services easier to scale on cloud platforms, tilting share toward digital hybrids that blend carrier contracts with AI insights.
By End-User Industry: Pharmaceutical Logistics Drives Specialized Growth
Retail, FMCG, and wholesale distribution maintained a 31.08% slice in 2025, but e-commerce and 3PL fulfillment spin fastest at 15.68% CAGR as last-mile promises tighten. Healthcare and pharmaceuticals hold a smaller absolute volume yet yield higher revenue-per-mile, because validated temperature control and GDP documentation are mandatory.
Manufacturing demand ebbs and flows with PMI cycles, while agriculture and food shipping spike seasonally, requiring dynamic capacity swaps. Construction cargo relies on flatbed networks sensitive to public-budget timelines, stressing the need for brokers to diversify vertical exposure to stabilize revenue.
By Customer Size: Platform Democratization Accelerates SME Growth
Large enterprises generated 57.99% of market revenue in 2025 thanks to bundled contracts across multiple countries. Digital interfaces now level access, allowing cafés in Barcelona or Etsy sellers in Kraków to book pallets at enterprise-grade rates, driving an 11.70% CAGR among small business shippers. The European freight brokerage market benefits from this democratization because fragmented demand pools consolidate onto fewer, highly automated platforms, augmenting volume without proportional headcount increases.
Mid-market firms remain attractive targets; they ship enough volume to justify contract discussions yet still value personalized account management. Brokers that segment go-to-market strategies by shipper size, offering API integrations to large accounts, account-managed portals to mid-tiers, and self-service apps to micro-shippers, capture the widest customer spectrum.
Geography Analysis
Germany retained 12.67% revenue share in 2025, underpinned by its manufacturing core and intersection of north-south and east-west arteries. However, a tighter labor pool and a new EUR 200 (USD 235)-per-tonne CO₂ toll component elevate operating costs, moderating future expansion to a mid-single-digit pace. Brokers in Germany emphasize network density and rail connectivity to retain competitiveness in the Europe freight brokerage market.
The Netherlands is projected to post the quickest growth at 6.92% CAGR through 2031. Rotterdam’s deep-sea gateway funnels imports to inland waterway terminals, creating high LTL consolidation rates and making the country an early adopter of digital freight exchanges. Dutch policy incentives for zero-emission trucks further strengthen local brokers who pioneer electric fleets and real-time visibility dashboards[3]Cargo-partner, “Netherlands Logistics Innovation Snapshot,” cargo-partner.com .
France, Italy, and Spain form the next revenue tier but suffer idiosyncratic challenges. Carrier insolvencies in France rose 37.8% in 2024, while Italy’s fragmented carrier base inflates empty-run ratios. The Nordics and Belgium punch above their weight in digitalization and sustainability pilots, whereas Poland supplies cost-competitive drivers but now contends with wage pressures after staged minimum-pay hikes. These contrasts oblige pan-EU brokers to balance centralized tech with decentralized compliance know-how.
The freight brokerage services market is assessed by Mordor Intelligence through a multi-layered geographic lens, covering other regions such as North America, along with detailed country-level analysis for Germany, Spain, Spain, Netherlands, Poland, Russia, Canada, and Saudi Arabia.
Competitive Landscape
The Europe freight brokerage market is moderately consolidated and tightening. Sennder’s February 2025 purchase of C.H. Robinson’s European division instantly vaulted the company into the top five by revenue, blending AI pricing tools with legacy carrier contracts. DSV’s pending DB Schenker acquisition, valued at EUR 14.3 billion (USD 16.85 billion), could create the region’s largest surface-transport portfolio once regulators approve[4]Trans.info, “Post-Acquisition Market Rank,” trans.info.
Digital natives differentiate on algorithmic load matching and CO₂ dashboards, while incumbents emphasize integrated sea-air-road offerings and decades-old customer intimacy. Traditional brokers counter platform aggression by investing in proprietary TMS suites and by launching venture arms to funnel innovation into core businesses. Specialized players carve niches in GDP-compliant cold chain, high-security automotive prototypes, or out-of-gauge renewables cargo, arenas where relationship capital and procedural expertise outweigh scale.
Carrier capacity tightness remains the key battleground. Brokers with pre-negotiated long-term commitments enjoy first-call on fleets when spot rates spike. Those alliances, often cemented through fuel-hedge sharing or co-branding of sustainability audits, create soft barriers for new entrants, even as venture funding accelerates platform roll-out across the Europe freight brokerage market.
Europe Freight Brokerage Services Industry Leaders
DHL Group
C.H. Robinson
Kuehne + Nagel
DSV
Sennder
- *Disclaimer: Major Players sorted in no particular order

Recent Industry Developments
- March 2026: Kuhene + Nagel adjusted freight agreements and routing strategies due to disruptions like Red Sea constraints. This led to increased reliance on air freight and flexible contract structures.
- April 2025: CEVA launched a scheduled trans-Pacific air charter program (Wuxi–Chicago) to strengthen controlled freight capacity. This enhances its global forwarding capabilities and supports more reliable brokerage-style services.
- April 2025: CEVA (part of CMA CGM) signed an agreement to acquire Borusan Logistics in Turkey for USD 440 million. This deal significantly expands its European network, nearly doubling warehousing capacity and strengthening road transport links into Europe.
- February 2025: Sennder completed the EUR 1.4 billion (USD 1.65 billion) acquisition of C.H. Robinson’s European Surface Transportation, adding 1,600 staff across 20+ sites.


Europe Freight Brokerage Services Market Report Scope
| Full-Truckload (FTL) |
| Less-than-Truckload (LTL) |
| Others |
| Dry Van |
| Refrigerated Van |
| Flatbed / Step-Deck |
| Tanker (Bulk Liquid and Chemical) |
| Others |
| Long-Haul (More than 500 miles) |
| Regional (100-500 miles) |
| Local (Less than 100 miles) |
| Traditional Freight Brokerage |
| Asset-Based Freight Brokerage |
| Agent Model Freight Brokerage |
| Digital Freight Brokerage |
| Manufacturing and Automotive |
| Construction and Infrastructure Projects |
| Oil, Gas, Mining and Chemicals |
| Agriculture and Food / Beverage |
| Retail, FMCG and Wholesale Distribution |
| Healthcare and Pharmaceuticals |
| E-commerce and 3PL Fulfilment |
| Other End-User Industry |
| Large Enterprise Shippers (More than USD 100 M) |
| Mid-Market Shippers (USD 10-100 M) |
| Small Businesses (Less than USD 10 M) |
| Germany |
| United Kingdom |
| France |
| Italy |
| Spain |
| Netherlands |
| Belgium |
| Nordics (Sweden, Denmark, Norway, Finland) |
| Poland |
| Rest of Europe |
| By Service | Full-Truckload (FTL) |
| Less-than-Truckload (LTL) | |
| Others | |
| By Equipment / Trailer Type | Dry Van |
| Refrigerated Van | |
| Flatbed / Step-Deck | |
| Tanker (Bulk Liquid and Chemical) | |
| Others | |
| By Haul Length | Long-Haul (More than 500 miles) |
| Regional (100-500 miles) | |
| Local (Less than 100 miles) | |
| By Business Model | Traditional Freight Brokerage |
| Asset-Based Freight Brokerage | |
| Agent Model Freight Brokerage | |
| Digital Freight Brokerage | |
| By End-User Industry | Manufacturing and Automotive |
| Construction and Infrastructure Projects | |
| Oil, Gas, Mining and Chemicals | |
| Agriculture and Food / Beverage | |
| Retail, FMCG and Wholesale Distribution | |
| Healthcare and Pharmaceuticals | |
| E-commerce and 3PL Fulfilment | |
| Other End-User Industry | |
| By Customer Size | Large Enterprise Shippers (More than USD 100 M) |
| Mid-Market Shippers (USD 10-100 M) | |
| Small Businesses (Less than USD 10 M) | |
| By Country | Germany |
| United Kingdom | |
| France | |
| Italy | |
| Spain | |
| Netherlands | |
| Belgium | |
| Nordics (Sweden, Denmark, Norway, Finland) | |
| Poland | |
| Rest of Europe |


Key Questions Answered in the Report
How large will shipper spending routed through brokers become by 2031 in Europe?
Shipper spend intermediated by brokers is projected to reach USD 30.06 billion by 2031, growing at a 6.83% CAGR from 2026.
Which European country is forecast to grow fastest for brokerage revenues?
The Netherlands is expected to post the highest growth, advancing at 6.92% CAGR through 2031, thanks to Rotterdam-centric multimodal flows and early digital adoption.
What service segment is expanding the quickest?
Less-than-truckload services lead growth at 8.75% CAGR as e-commerce parcelization rewards consolidation economics.
Why is refrigerated capacity attracting investment?
Biopharmaceutical manufacturing and fresh-food e-commerce amplify cold-chain demand, pushing refrigerated van revenues up a projected 9.57% CAGR.
How are brokers coping with EU sustainability laws?
Larger intermediaries deploy ESG audit platforms and carbon dashboards, while smaller firms often partner with tech vendors or seek acquisition to meet compliance mandates.
What technology offers brokers the biggest margin upside?
AI-driven dynamic pricing increasingly unlocks hidden profitability on backhaul and off-peak lanes by aligning spot quotes with real-time capacity data.
Page last updated on:


