Fortified Dairy Products Market Size and Share
Market Overview
| Study Period | 2020 - 2030 |
|---|---|
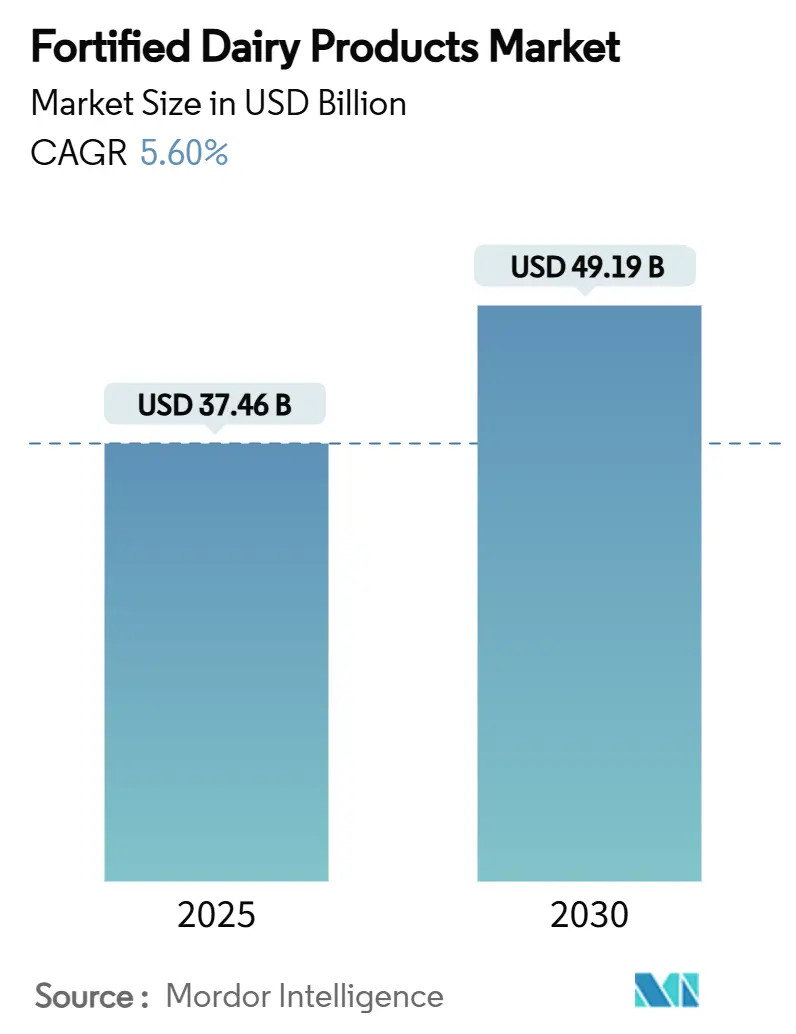
| Market Size (2025) | USD 37.46 Billion |
| Market Size (2030) | USD 49.19 Billion |
| Growth Rate (2025 - 2030) | 5.60% CAGR |
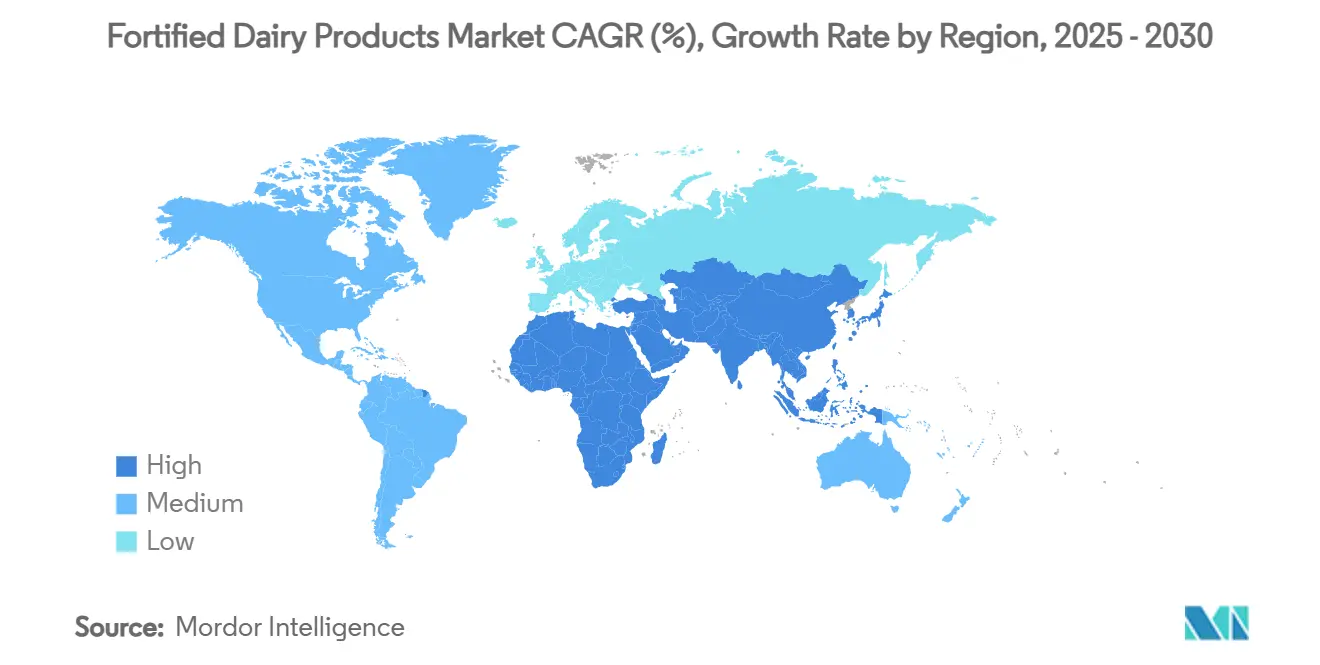
| Fastest Growing Market | Middle East and Africa |
| Largest Market | Asia Pacific |
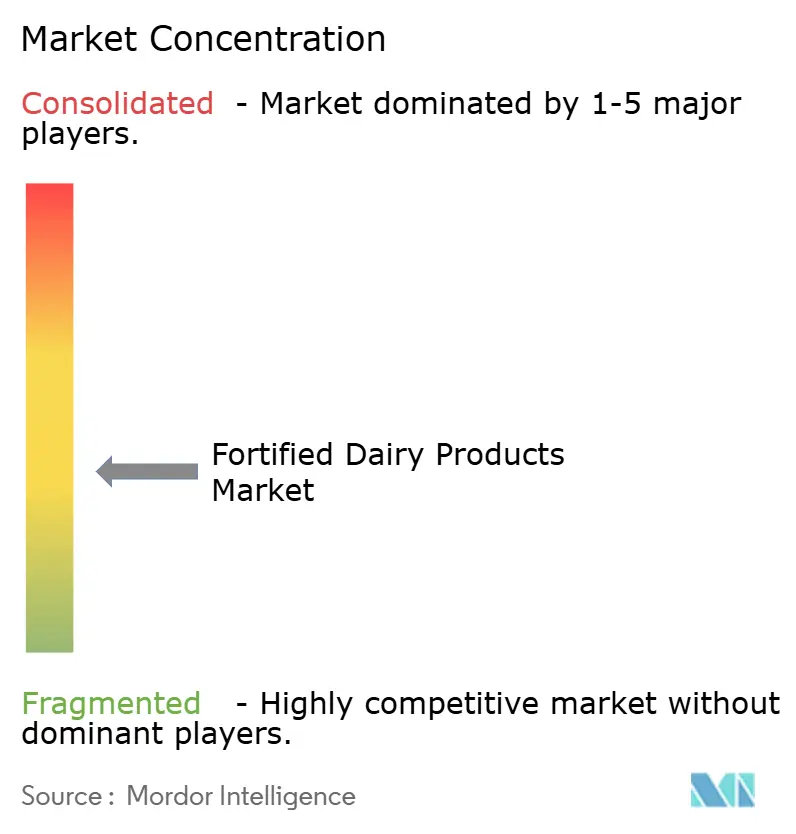
| Market Concentration | Medium |
Major Players
*Disclaimer: Major Players sorted in no particular order Image © Mordor Intelligence. Reuse requires attribution under CC BY 4.0. |
|
Fortified Dairy Products Market Analysis by Mordor Intelligence
The fortified dairy products market size stands at USD 37.46 billion in 2025 and is projected to reach USD 49.19 billion by 2030, translating into a sturdy 5.60% CAGR. Steady gains come from a convergence of rising public awareness of micronutrient deficiencies, firm government fortification mandates, and a consumer preference shift toward functional foods that promise immunity support alongside baseline nutrition[1]World Health Organization. "Micronutrients." Accessed July 17, 2025. https://www.who.int/news-room/fact-sheets/detail/micronutrients.. Precision-fermentation technologies are lowering the cost of adding bioactives, allowing firms such as Perfect Day and Remilk to win regulatory approvals for animal-free dairy proteins that mirror the nutritional profile of conventional milk. Asia-Pacific’s leading role is underpinned by large-scale vitamin A and D programs in India and a growing demand for premium offerings in China, while modern retail expansion in emerging markets removes cold-chain barriers and accelerates product reach. Although premium pricing and “over-processed” perceptions hinder adoption in some consumer segments, regulatory clarity around novel fortificants and steady investments in personalized nutrition platforms continue to broaden the fortified dairy products market opportunity set.
Key Report Takeaways
- By product type, milk captured 55.26% of the fortified dairy products market share in 2024, while yogurt is projected to record a 5.80% CAGR through 2030.
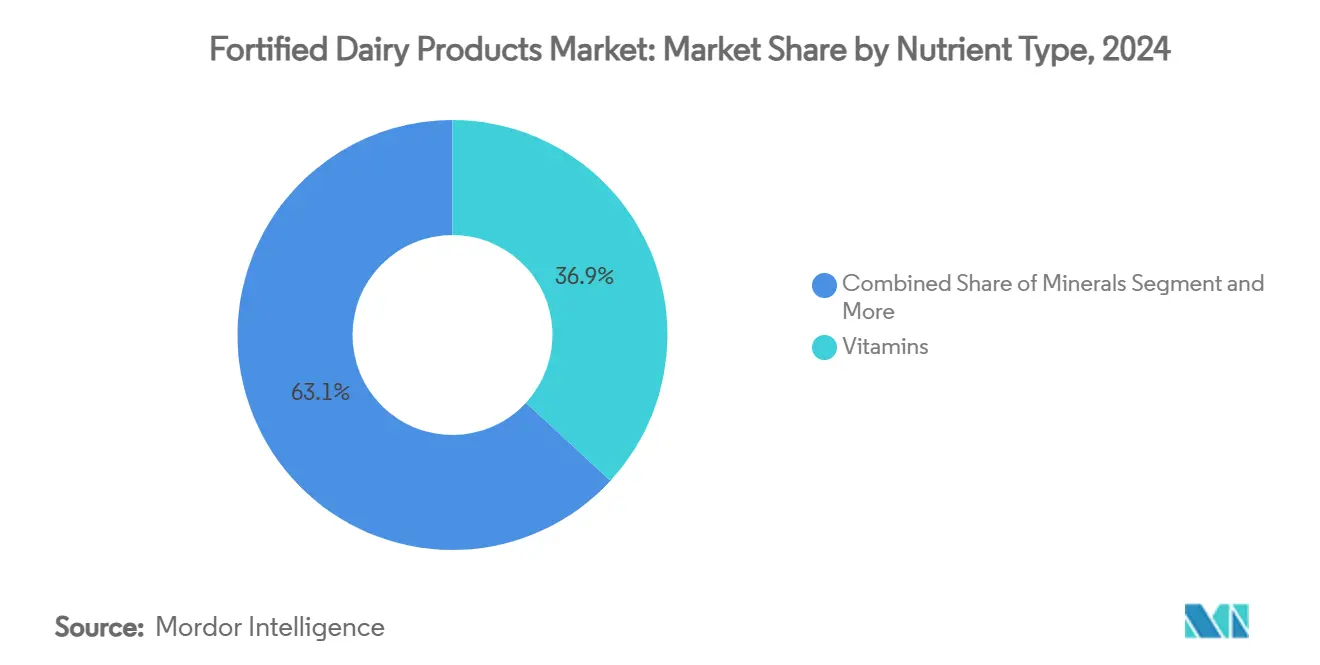
- By nutrient type, vitamins commanded 36.85% share of the fortified dairy products market size in 2024, whereas probiotics are advancing at an 8.46% CAGR to 2030.
- By customer demographics, children accounted for 42.47% share in 2024 and adults are expanding at a 6.80% CAGR through 2030.
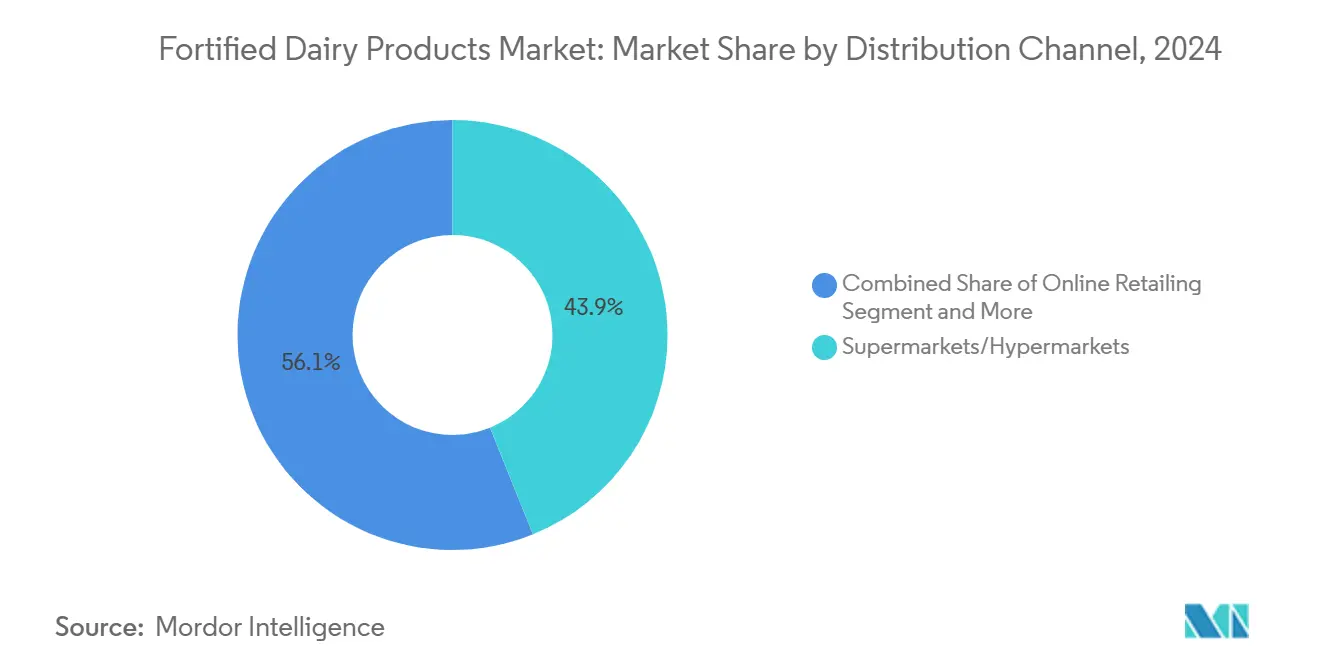
- By distribution channel, supermarkets/hypermarkets retail segment held 56.89% share in 2024 and online retail is set to grow at a 10.75% CAGR to 2030.
- By geography, Asia-Pacific led with 39.37% revenue share in 2024; the Middle East and Africa is forecast to post a 5.26% CAGR through 2030.
Global Fortified Dairy Products Market Trends and Insights
Drivers Impact Analysis*
| Driver | (~) % Impact on CAGR Forecast | Geographic Relevance | Impact Timeline |
|---|---|---|---|
| Rising prevalence of micronutrient deficiencies | +1.2% | Global, strongest in Asia-Pacific and MEA | Medium term (2-4 years) |
| Government-led mandatory fortification programs | +0.8% | Asia-Pacific, MEA, select European markets | Long term (≥ 4 years) |
| Consumer shift toward functional immunity foods | +0.6% | North America, Europe, urban Asia-Pacific | Short term (≤ 2 years) |
| Expansion of modern retail in emerging economies | +0.5% | Asia-Pacific, MEA, South America | Medium term (2-4 years) |
| Personalized nutrition platforms for niche SKUs | +0.4% | North America, Europe, developed Asia-Pacific | Long term (≥ 4 years) |
| Precision fermentation cuts bioactive cost | +0.3% | Global, early uptake in North America and Europe | Long term (≥ 4 years) |
| Source: Mordor Intelligence | |||
Rising Prevalence of Micronutrient Deficiencies
More than 2 billion people are deficient in vitamins and minerals, creating urgent demand for dairy-based fortification solutions. Iron deficiency affects 1.62 billion individuals and vitamin D shortfalls afflict nearly 1 billion, particularly where sun exposure and dietary diversity remain limited. Governments favor dairy carriers because of their widespread consumption and ability to enhance micronutrient bioavailability. The U.S. Centers for Disease Control and Prevention (CDC) and WHO both advocate for food fortification to combat deficiencies, with dairy products commonly chosen for vitamin D and A fortification to aid at-risk populations, including children and pregnant women. Health systems now acknowledge that fortified dairy reduces long-run treatment costs associated with anemia, rickets, and related diseases. As a result, both developed and developing economies treat fortified dairy as a frontline, cost-effective nutrition intervention that will keep the fortified dairy products market expanding across socioeconomic tiers.
Government-Led Mandatory Fortification Programs
India’s Food Safety and Standards Authority has required vitamin A and D fortification in milk since 2024, creating a nationwide baseline for industry participation. In the United States and European Union, regulatory guidelines support voluntary or mandatory fortification of dairy with vitamins and minerals, as recommended by respective food safety agencies (such as the U.S. Food & Drug Administration and European Food Safety Authority). The European Union’s Novel Food Regulation has opened the door for lactoferrin, osteopontin, and other bioactives, while Canada and the United States continue to streamline GRAS reviews for probiotics and peptides. These harmonized frameworks lower compliance uncertainty, unlock capital investment in fortification technology, and ensure that fortified dairy products meet uniform safety and efficacy standards across export markets.
Consumer Shift Toward Functional and Immunity-Boosting Foods
Post-pandemic research shows that 37% of US shoppers look for dairy carrying explicit health claims, especially immunity-related benefits tied to probiotics, vitamins C and D, and zinc.. A willingness to pay premiums has become entrenched, helping producers recover fortification costs. Similar behavior is rising in urban centers of South-east Asia and Latin America as disposable incomes rise[2]Food and Drug Administration. "Generally Recognized as Safe (GRAS) Notification Program." Accessed July 17, 2025. https://www.fda.gov/food/food-additives-petitions/generally-recognized-safe-gras-notification-program.. The U.S. Department of Agriculture (USDA) and the European Commission’s market reports note sharp increases in functional food and beverage consumption, including dairy fortified for immune, bone, and gut health. Brands exploit the trend through product differentiation, illustrated by Chobani’s 2024 Super Milk launch aimed at active lifestyles and immune support. Continued consumer education via digital channels enhances the fortified dairy products market resonance with health-conscious cohorts.
Expansion of Modern Retail in Emerging Economies
Cold-chain investments in India, Indonesia, and Nigeria are rapidly replacing fragmented traditional outlets with organized supermarkets that can store temperature-sensitive fortified milk, yogurts, and cheeses. Modern retail settings provide shelf space for higher-value SKUs and enable branded in-store education kiosks. As accessibility improves, fortified dairy gains visibility among first-time shoppers, creating a cycle in which demand encourages further infrastructure development[3]Ministry of Food Processing Industries, India. "Infrastructure Development." Accessed July 17, 2025. https://www.mofpi.gov.in/. The United Nations Food and Agriculture Organization (FAO) documents this retail transformation, noting it increases opportunities for distribution and marketing of value-added products, including fortified milk and yogurts. International brands also view these retail networks as low-risk entry points, deepening competition within the fortified dairy products market.
Restraints Impact Analysis*
| Restraint | (~) % Impact on CAGR Forecast | Geographic Relevance | Impact Timeline |
|---|---|---|---|
| Higher production costs and premium pricing | -0.7% | Global, highest in price-sensitive emerging markets | Short term (≤ 2 years) |
| Sensory and stability challenges | -0.4% | Global, especially product innovation timelines | Medium term (2-4 years) |
| Regulatory ambiguity for novel bioactives | -0.3% | Europe, North America, developed Asia-Pacific | Long term (≥ 4 years) |
| Consumer skepticism around “over-processed” | -0.2% | North America, Europe, major urban markets worldwide | Medium term (2-4 years) |
| Source: Mordor Intelligence | |||
Higher Production Costs and Premium Pricing
Fortification drives manufacturing expenses up by 15-25%, forcing companies to position products at price points that remain out of reach for lower-income households in South Asia and Sub-Saharan Africa. Bioactives such as lactoferrin push costs even higher because of complex purification steps. Large dairies balance cost and potency by phasing fortification levels or using bundled promotions, yet absorption in price-sensitive segments stays muted. Until economies of scale or subsidy programs offset incremental costs, the fortified dairy products market will see slower uptake among value shoppers. The WHO notes that the cost of fortification, including ingredient and quality control expenses, is often passed on to consumers, presenting a significant challenge to achieving broad-based nutritional impact among the most vulnerable populations.
Sensory and Stability Challenges of Nutrient Addition
Iron fortification can impart metallic off-notes and color changes, while vitamins A and riboflavin degrade under light, heat, and oxygen, necessitating costly research and development for acceptable formulations. These quality issues can result in reduced repeat purchases and food waste, making commercial fortification less attractive for producers aiming to meet both nutritional targets and consumer preferences. Manufacturers employ micro-encapsulation, light-barrier packaging, and optimized processing temperatures to mitigate these issues, but each solution adds complexity and expense. The additional steps lengthen development cycles and may deter smaller producers from entering the fortified dairy products industry. Sensory quality remains a critical hurdle to mass-market credibility.
*Our forecasts treat driver/restraint impacts as directional, not additive. The impact forecasts reflect baseline growth, mix effects, and variable interactions.
Segment Analysis
By Nutrient Type: Vitamins Lead While Probiotics Surge
Vitamins remained the dominant nutrient class with 36.85% share in 2024, sustained by regulatory mandates and long-standing consumer trust in vitamin A, D, and B-complex fortification. Producers benefit from mature supply chains and predictable dosing protocols that facilitate large-scale procurement. Notably, children’s products leverage vitamin blends designed to address growth and cognitive development needs, fortifying the fortified dairy products market size for vitamin-based SKUs at USD 13.81 billion in 2024.
Probiotics, in contrast, command only single-digit share but are advancing at an 8.46% CAGR, making them the growth engine within nutrient types. Accelerating clinical evidence linking gut microbiota to systemic health has shifted probiotics from a niche digestive aid to a mainstream immunity enhancer. Companies such as Caelus have obtained GRAS recognition for strains with cardio-metabolic benefits, widening application scope beyond yogurt into drinkable milks and cheeses. As consumers adopt a preventative health mindset, probiotic-fortified SKUs help brands justify premium pricing and deepen shopper loyalty, amplifying the future revenue potential of the fortified dairy products market.


By Customer Demographics: Children Lead While Adults Accelerate
Children represented the largest demographic block with 42.47% share in 2024, echoing parental concerns surrounding stunting and cognitive development. School milk programs in India, Mexico, and South Africa distribute vitamin-D-enriched packets, providing predictable volume and supporting plant utilization rates. Manufacturers use kid-friendly flavors and cartoon branding, but also reformulate to lower added sugars, aligning products with evolving nutritional guidelines. Sustained government support keeps the fortified dairy products market size for children substantial, even as private-label competition intensifies.
The adult segment is the fastest growing, set to rise at a 6.80% CAGR to 2030, propelled by working professionals who seek convenient immunity protection and energy support. Functional milks boasting omega-3 fatty acids or adaptogens are positioned as breakfast substitutes for time-pressed commuters. Premium pricing is acceptable when clear, science-backed claims are communicated through QR-code-enabled packaging. This shift also induces product design changes such as resealable single-serve bottles that match grab-and-go lifestyles, broadening the fortified dairy products market footprint beyond traditional family consumption occasions.
By Distribution Channel: Supermarkets Dominate While E-Commerce Accelerates
Supermarkets and Hypermarkets, maintaining the share of 43.89% in 2024, underpinned by reliable refrigeration networks and shopper trust in dairy freshness. Retailers like Walmart and Carrefour have invested heavily in energy-efficient cold cabinets that extend shelf life and reduce nutrient degradation. Shelf facings and in-store tasting events assist in educating consumers about the health benefits of fortified dairy, reinforcing off-take volumes. Given their footfall, supermarkets remain the gateway for new fortified SKUs that require mass exposure before e-commerce scaling.
Online retailing, recording a growth of 10.75% CAGR, emerge as the fastest growing segment as consumers embrace home delivery, subscription models, and algorithm-based personalized recommendations. Companies such as Country Delight send fortified milk in reusable bottles while tracking temperature via IoT sensors, ensuring quality on arrival. Marketplaces offer detailed nutrient panels and customer reviews, fostering trust even for premium-priced bioactive formulations. The rising overlap between digital platforms and health-data ecosystems adds a strategic layer to the fortified dairy products industry, allowing brands to refine offerings based on real-time feedback and consumption analytics.
By Product Type: Milk Dominance Drives Fortification Accessibility
Milk held the top spot with 55.26% share of the fortified dairy products market in 2024, benefiting from universal consumption habits and well-established fortification lines that keep incremental costs low. Governments often choose milk as their primary vehicle for vitamin A and D delivery, creating predictable baseline demand and encouraging investment in bigger batch processes that spread fixed costs. The segment also supports specialized SKUs such as high-calcium milk for seniors and protein-enriched variants for sports enthusiasts, underpinning a portfolio approach that buffers producers against demand shocks in any single niche.
Yogurt, while smaller in absolute terms, is on track to post the highest product-level CAGR at 5.80% through 2030, propelled by consumer recognition of live cultures and gut-health benefits. Precision fermentation is enabling the incorporation of next-generation probiotics such as Anaerobutyricum soehngenii, which secured US GRAS status in 2024, expanding formulation options for digestive health and immunity support. Brands like Danone and Chobani funnel significant R&D into synergistic blends of protein, vitamins, and probiotics that can command higher shelf prices and differentiate in crowded supermarket aisles. Together, milk and yogurt account for more than three-quarters of the fortified dairy products market, cementing a balanced mix of volume leadership and innovation-driven upside.
Geography Analysis
Asia-Pacific accounted for 39.37% revenue in 2024, confirming its standing as the pivotal region in the fortified dairy products market. Mandatory vitamin A and D guidelines, rapid urbanization, and the purchasing power growth of China’s middle class have converged to sustain high demand. Local giants Yili and Mengniu adapt nutrient profiles to address lactose intolerance and calcium deficits common in regional diets, reinforcing consumer relevance. Government procurement for school-lunch programs further stabilizes baseline volumes, anchoring long-term market leadership.
The Middle East and Africa, though smaller, is on track to deliver the fastest 5.26% CAGR through 2030, buoyed by nutrition-focused policies that tackle anemia and vitamin-A deficiency in schoolchildren. Multinationals such as Arla Foods and Clover Industries invest in localized production and public-private partnerships to tailor nutrient blends to regional gaps. Young demographics, coupled with rising disposable incomes in Gulf Cooperation Council states, provide fertile ground for premium fortified yogurts and flavored milks positioned as healthy snacks.
North America and Europe together form a mature but innovation-driven cluster within the fortified dairy products market. North American consumers reward scientifically validated claims with price premiums, encouraging heavy R&D spending. Europe pioneers natural fortification practices, emphasizing clean labels and precision-fermented proteins that fulfill sustainability goals. Strong regulatory frameworks and sophisticated logistics make both regions test beds for high-end SKUs that ultimately cascade into global portfolios.

Competitive Landscape
The fortified dairy products market displays moderate concentration with a competitive intensity score of 4 out of 10, signifying room for incumbents and insurgents alike. Global majors Danone, Nestlé, and Arla Foods leverage vast R&D budgets, multi-country plants, and patent portfolios to maintain scale economies and first-mover advantages. Regional leaders, including Yili Group in China and GCMMF (Amul) in India, capitalize on domestic loyalty and government procurement channels, creating formidable in-country moats.
Technology partnerships are reshaping strategic playbooks. Perfect Day and Remilk supply animal-free proteins to branded marketers, allowing heritage dairy names to launch hybrid lines that carry environmental and ethical claims without abandoning traditional product taste. Leprino Foods’ licensing agreement with Fooditive Group to commercialize precision-fermented casein widens ingredient access for global cheese and yogurt producers. Vertical integration into biotech capabilities reduces dependency on third-party suppliers and secures future nutrient pipelines.
Start-ups use direct-to-consumer models to personalize formulations based on biometric feedback, challenging mass-market positioning. Subscription services furnish steady cash flow and granular user data, enabling rapid iteration on flavor, texture, and bioactive dosage. Incumbents respond through acquisition—illustrated by Lactalis’ USD 2.1 billion purchase of General Mills’ US yogurt business—to capture emerging niches and bolster their fortified portfolios. Collectively, these moves keep the fortified dairy products industry dynamic, with sustained innovation pressure across all tiers.
Fortified Dairy Products Industry Leaders
-
Danone SA
-
Nestlé SA
-
Yili Group
-
Arla Foods amba
-
GCMMF (Amul)
- *Disclaimer: Major Players sorted in no particular order

Recent Industry Developments
- April 2025: Chobani broke ground on a USD 1.2 billion processing plant in Rome, New York, dedicated to fortified yogurt and dairy expansion
- March 2025: Mother Dairy unveiled 'Promilk', a protein-rich milk product. This launch specifically targets the protein-deficient populace in the Delhi-NCR region. 'Promilk', derived from cow's milk, boasts 40 grams of protein, 4 per cent fat, and 11.5 per cent solids-not-fat (SNF) per litre. Additionally, it's fortified with vitamins A and D.
- March 2025: Onken has made its foray into the children's yogurt segment, unveiling its latest offering, Kiddos. Crafted from just three natural ingredients, Kiddos is fortified with vitamin D, bolstering children's immune systems. Offered in two enticing flavours – banana and raspberry, and a blend of blueberry, blackberry, and banana – Kiddos caters to the growing demand for simplicity and naturalness in children's nutrition.


Global Fortified Dairy Products Market Report Scope
| Milk |
| Cheese |
| Milk Powder |
| Yogurt |
| Others |
| Vitamin |
| Mineral |
| Protein |
| Probiotics |
| Others |
| Children |
| Pregnant and Lactating women |
| Adults |
| Geriatric |
| Supermarkets/Hypermarkets |
| Convenience/Grocery Stores |
| Specialty/Gourmet Stores |
| Online Retail/E-commerce |
| Others |
| North America | United States |
| Canada | |
| Mexico | |
| Rest of North America | |
| Europe | Germany |
| United Kingdom | |
| Italy | |
| France | |
| Spain | |
| Netherlands | |
| Russia | |
| Belgium | |
| Rest of Europe | |
| Asia-Pacific | China |
| India | |
| Japan | |
| Australia | |
| Indonesia | |
| South Korea | |
| Thailand | |
| Singapore | |
| Rest of Asia-Pacific | |
| South America | Brazil |
| Argentina | |
| Chile | |
| Peru | |
| Rest of South America | |
| Middle East and Africa | South Africa |
| Saudi Arabia | |
| United Arab Emirates | |
| Nigeria | |
| Egypt | |
| Rest of Middle East and Africa |
| By Product Type | Milk | |
| Cheese | ||
| Milk Powder | ||
| Yogurt | ||
| Others | ||
| By Nutrient Type | Vitamin | |
| Mineral | ||
| Protein | ||
| Probiotics | ||
| Others | ||
| By Customer Demographic | Children | |
| Pregnant and Lactating women | ||
| Adults | ||
| Geriatric | ||
| By Distribution Channel | Supermarkets/Hypermarkets | |
| Convenience/Grocery Stores | ||
| Specialty/Gourmet Stores | ||
| Online Retail/E-commerce | ||
| Others | ||
| Geography | North America | United States |
| Canada | ||
| Mexico | ||
| Rest of North America | ||
| Europe | Germany | |
| United Kingdom | ||
| Italy | ||
| France | ||
| Spain | ||
| Netherlands | ||
| Russia | ||
| Belgium | ||
| Rest of Europe | ||
| Asia-Pacific | China | |
| India | ||
| Japan | ||
| Australia | ||
| Indonesia | ||
| South Korea | ||
| Thailand | ||
| Singapore | ||
| Rest of Asia-Pacific | ||
| South America | Brazil | |
| Argentina | ||
| Chile | ||
| Peru | ||
| Rest of South America | ||
| Middle East and Africa | South Africa | |
| Saudi Arabia | ||
| United Arab Emirates | ||
| Nigeria | ||
| Egypt | ||
| Rest of Middle East and Africa | ||


Key Questions Answered in the Report
What is the current value of the fortified dairy products market?
The fortified dairy products market size is USD 37.46 billion in 2025 and is projected to reach USD 49.19 billion by 2030.
Which product type leads the market and why?
Milk dominates with 55.26% share because mandatory vitamin A and D programs make it the preferred vehicle for large-scale fortification.
What nutrient category is growing the fastest?
Probiotics show the highest growth, expanding at an 8.46% CAGR as consumers link gut health to stronger immunity.
Which region is expected to record the fastest growth?
The Middle East and Africa is forecast to grow at a 5.26% CAGR, driven by government nutrition programs and rising disposable incomes.
Page last updated on:


