Europe Non-Dairy Milk Market Size and Share
Market Overview
| Study Period | 2021 - 2031 |
|---|---|
| Forecast Data Period | 2026 - 2031 |
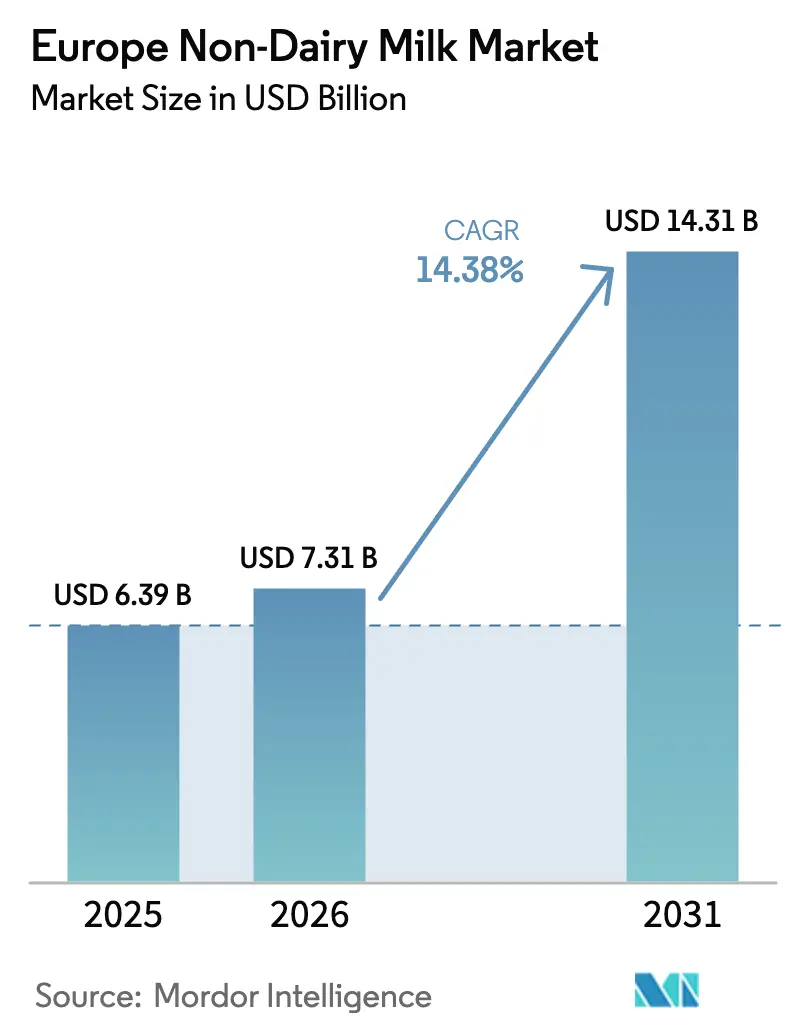
| Base Year Market Size (2025) | USD 6.39 Billion |
| Market Size (2026) | USD 7.31 Billion |
| Market Size (2031) | USD 14.31 Billion |
| Growth Rate (2026 - 2031) | 14.38% CAGR |
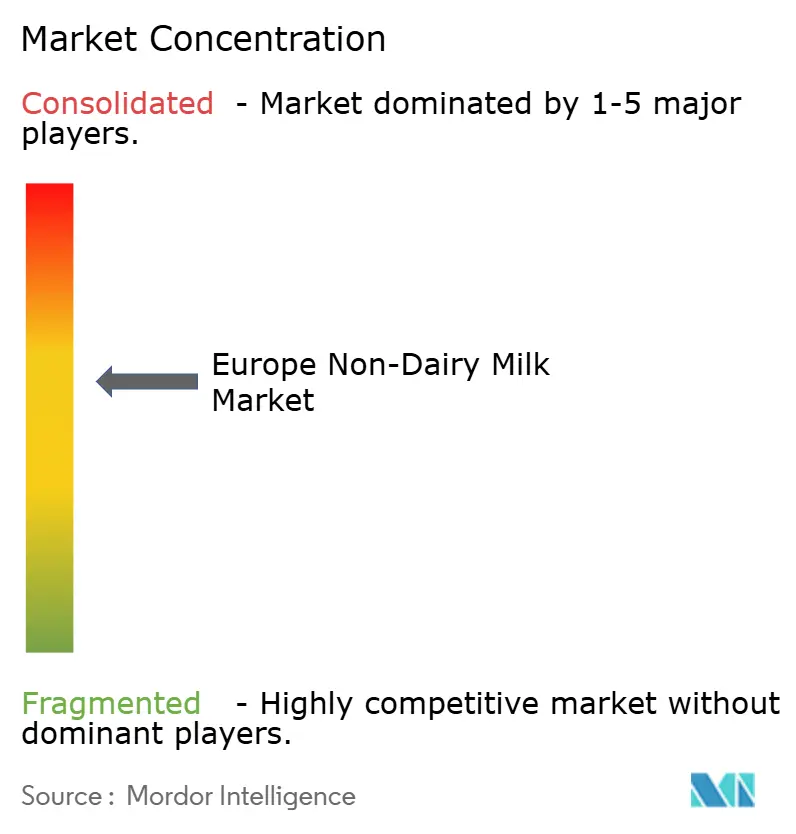
| Market Concentration | Medium |
Major Players
*Disclaimer: Major Players sorted in no particular order Image © Mordor Intelligence. Reuse requires attribution under CC BY 4.0. |
|
Europe Non-Dairy Milk Market Analysis by Mordor Intelligence
The European non-dairy milk market size in 2026 is estimated at USD 7.31 billion, growing from 2025 value of USD 6.39 billion with 2031 projections showing USD 14.31 billion, growing at 14.38% CAGR over 2026-2031. This growth is driven by EU protein crop incentives that reduce raw material costs. Retail private-label expansions are increasing shelf space, while innovations are introducing barista-grade functionalities in soy, oat, and emerging hemp products. The growing base of vegan, vegetarian, and flexitarian consumers, particularly in the UK, Germany, and France, is fueling demand for non-dairy beverages. On the supply side, circular-economy packaging mandates are promoting shelf-stable formats. Simultaneously, demand is rising as flexitarian and lactose-sensitive consumers seek sustainably sourced proteins. Improved product availability in supermarkets, hypermarkets, health stores, and online platforms is enhancing accessibility, particularly in urban and secondary regions. Advances in processing and formulation have improved taste, creaminess, and versatility for applications in coffee, cereals, and cooking, strengthening consumer retention. As dairy multinationals acquire niche innovators to protect their market share, specialized start-ups are capturing premium lifestyle segments through direct-to-consumer models. Regulatory clarity on Novel Food approvals and ingredient labeling is expanding the scope for innovation, though achieving price parity with traditional dairy products remains a medium-term challenge.
Key Report Takeaways
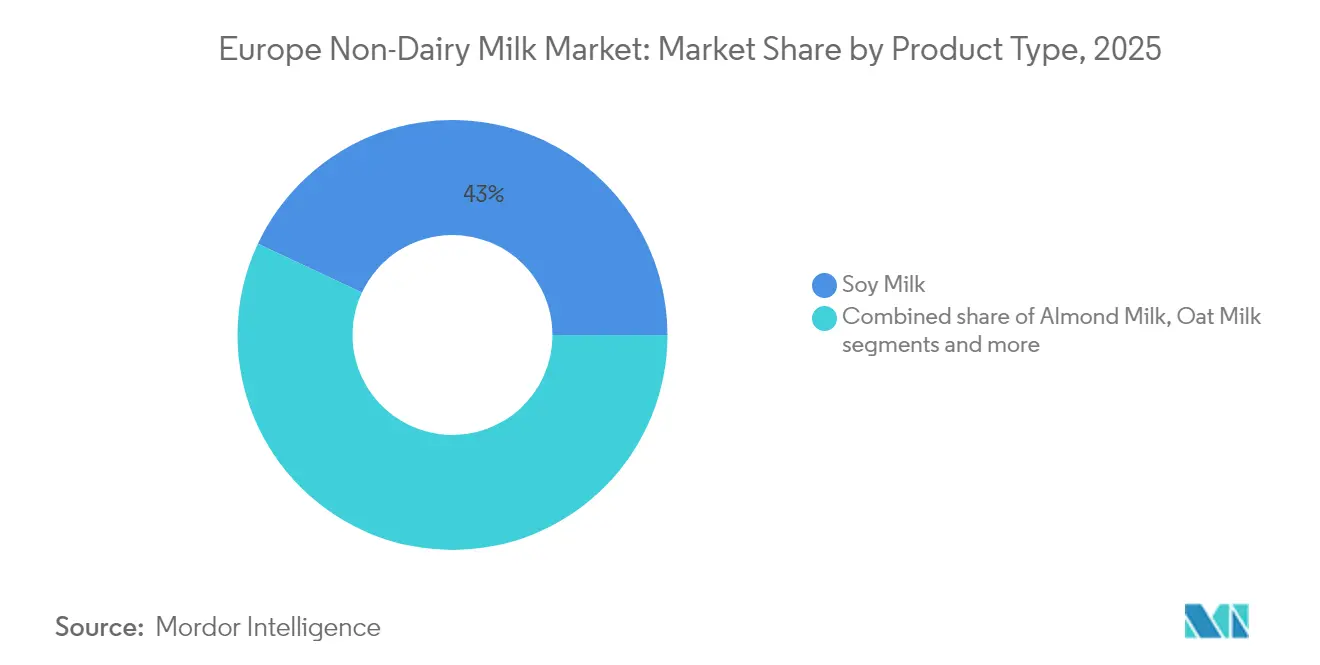
- By product type, soy milk led with 43.02% of the plant-based milk market share in 2025, while hemp milk is projected to expand at a 15.88% CAGR through 2031.
- By flavor, unflavored variants captured 66.88% revenue in 2025; flavored alternatives are forecast to register a 15.22% CAGR to 2031.
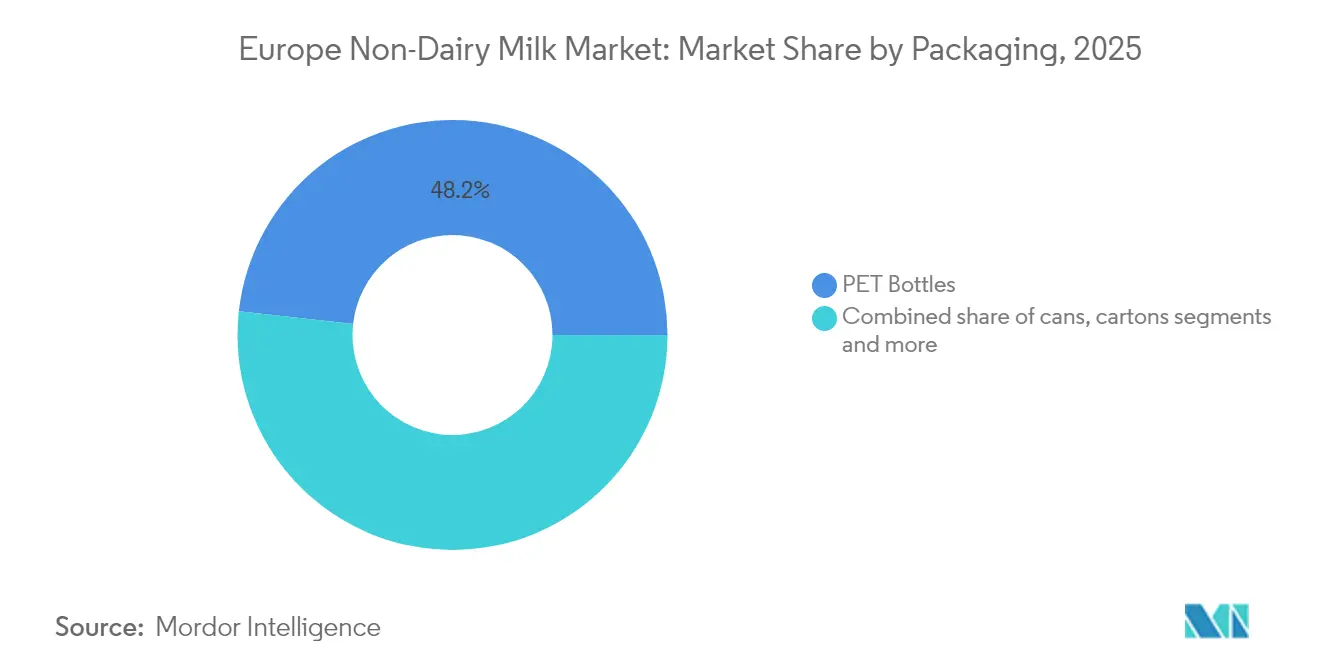
- By packaging, PET bottles held 48.23% share of the plant-based milk market size in 2025, yet cans post the fastest trajectory at 14.62% CAGR to 2031.
- By distribution channel, off-trade outlets commanded 77.55% value share in 2025, whereas on-trade channels will grow at a 15.41% CAGR through 2031.
- By geography, Germany accounted for 23.76% revenue in 2025; Russia records the highest projected CAGR at 14.92% to 2031.
Note: Market size and forecast figures in this report are generated using Mordor Intelligence’s proprietary estimation framework, updated with the latest available data and insights as of 2026.
Europe Non-Dairy Milk Market Trends and Insights
Drivers Impact Analysis*
| Driver | (~) % Impact on CAGR Forecast | Geographic Relevance | Impact Timeline |
|---|---|---|---|
| Rising plant-based lifestyle trends | +3.2% | Germany, Netherlands, Sweden | Medium term (2-4 years) |
| Influence of food movements and social media | +2.1% | Western Europe, spill-over to Eastern Europe | Short term (≤ 2 years) |
| Rising lactose-intolerance and dairy-allergy prevalence | +2.8% | United Kingdom, Germany, France | Long term (≥ 4 years) |
| Rapid product innovation and barista functionality | +2.4% | EU core, Russia, Poland | Medium term (2-4 years) |
| Retail private-label expansion | +1.9% | Germany, United Kingdom, Netherlands, Belgium | Short term (≤ 2 years) |
| EU protein-crop incentives | +1.8% | EU-27, led by France, Germany, Netherlands | Long term (≥ 4 years) |
| Source: Mordor Intelligence | |||


Rising Plant-Based Lifestyle Trends
European consumers increasingly view plant-based milk as a gateway product for broader dietary transitions, with adoption rates accelerating beyond traditional vegan demographics into flexitarian and health-conscious segments. 38% of Europeans are following a flexitarian, pescatarian, vegan, or vegetarian diet in 2024, according to the Proveg International Organization[1]Source: Proveg International Organization, "From meat to legumes", proveg.org. The Netherlands Health Council, in its 2024 recommendations, has officially recognized plant-based alternatives as nutritionally adequate substitutes for dairy products. This endorsement from a regulatory body provides significant reassurance to consumers, helping to overcome hesitations about nutritional adequacy. At the same time, Germany is experiencing consistent growth in plant-based food sales, showcasing a sustained upward trajectory that extends beyond the temporary surge in demand observed during the pandemic. Additionally, social sustainability requirements are playing a pivotal role in shaping procurement strategies among European foodservice operators. These requirements are driving institutional demand for certified sustainable plant-based products, enabling premium pricing for such offerings. The geographic concentration of this trend in Northern and Western Europe is largely due to higher disposable incomes and the presence of well-established organic food distribution networks. These factors create a favorable environment for premium plant-based brands to enter and thrive in the market, further reinforcing the region's leadership in the plant-based food sector.
Influence of Food Movements and Social Media
Digital platforms amplify plant-based adoption through influencer-driven content that positions dairy alternatives as lifestyle choices rather than dietary restrictions, fundamentally reshaping market messaging strategies. Rising smartphone use and the influence of food movements and social media are accelerating the adoption of plant-based milk in Europe. Share of smartphone users in the United Kingdom (UK) was 93% in 2024, according to Ofcom[2]Source: Ofcom, "Adults' Media Literacy Tracker 2024", ofcom.org.uk. This shift in messaging is reinforced by the European Food Safety Authority's guidelines on micronutrient requirements for plant-based products. These guidelines allow brands to make stronger health claims on social media, supporting premium positioning strategies. Moreover, combining environmental messaging with personal health benefits creates compelling value propositions that particularly attract urban millennials, a key demographic driving early adoption. Social media's role goes beyond consumer education by enhancing supply chain transparency. Brands leverage these platforms to highlight sourcing practices and ingredient traceability, addressing concerns about ultra-processing. This digital-first strategy enables smaller European plant-based companies to compete with established dairy players by building direct consumer relationships and bypassing traditional retail channels.
Rising lactose intolerance and dairy allergy prevalence
European health authorities have expanded their understanding of lactose intolerance. This shift highlights the growing recognition of varying degrees of lactose sensitivity beyond traditional diagnostic criteria. The European Commission's 2025 Vision for Agriculture emphasizes the critical role of protein diversification in ensuring food security, indirectly promoting plant-based alternatives as viable solutions for individuals with dairy sensitivities. Increasing clinical evidence linking dairy consumption to inflammatory responses has led healthcare providers to recommend plant-based alternatives over lactose-reduced dairy products. This shift in medical guidance not only drives sustainable demand for plant-based milk but also elevates its status from being a lifestyle choice to a form of therapeutic nutrition. Furthermore, geographic differences in lactose tolerance across Europe present unique market opportunities. For instance, Nordic countries exhibit higher lactose tolerance rates, whereas Mediterranean regions demonstrate significantly greater sensitivity, creating a need for targeted product offerings in these areas.
Rapid product innovation and barista functionality
Advancements in protein extraction and emulsification technologies have enabled plant-based milks to achieve functional equivalence with dairy milk in professional coffee applications. This development has effectively removed a significant barrier to their adoption in the foodservice industry. Califia Farms' planned 2024 launch of specialized barista blends across the UK and EU markets highlights the industry's growing emphasis on professional coffee channels. These blends are specifically designed to deliver superior performance in steaming and frothing, meeting the demands of baristas and coffee professionals. Precision fermentation technology has further revolutionized the market by allowing manufacturers to incorporate dairy-identical proteins without relying on animal inputs. This innovation has led to the creation of hybrid products that not only meet functional requirements but also align with ethical and sustainability preferences. Additionally, the use of microalgal biomass as a protein source has expanded the nutritional profiles of plant-based products, surpassing the limitations of traditional plant proteins. The European Food Safety Authority (EFSA) has facilitated the approval of novel ingredients, enabling manufacturers to position their products in the premium segment. Furthermore, the competitive landscape and improvements in ingredient supply chains have significantly accelerated product development cycles in European markets, reducing the timeline from 18-24 months to just 6-12 months.
Restraints Impact Analysis*
| Restraint | (~) % Impact on CAGR Forecast | Geographic Relevance | Impact Timeline |
|---|---|---|---|
| Premium pricing gap | -2.1% | Highest in Eastern Europe | Medium term (2-4 years) |
| Stringent EU “milk” labeling restrictions | -1.4% | EU-27, variable by Member State | Long term (≥ 4 years) |
| Almond water-footprint and supply volatility | -1.8% | Spain, Italy | Short term (≤ 2 years) |
| Ultra-processing perception and additive backlash | -1.6% | Germany, Netherlands, Nordics | Medium term (2-4 years) |
| Source: Mordor Intelligence | |||
Premium pricing gap hamper the market
Across six major European markets, plant-based milk alternatives maintain a significant price premium of 35-58% over conventional dairy products. While production economies have improved, this pricing strategy continues to hinder broader market adoption. Soy-based products, which offer more favorable macronutrient profiles compared to dairy milk, underscore a critical issue: the higher prices of plant-based alternatives often fail to deliver proportional nutritional benefits. In February 2025, European raw milk prices experienced a notable 16% year-over-year increase, reaching 53.84 euro cents per kilogram, according to the European Commission[3]Source: European Commission, "EU and World monthly raw milk prices", europa.eu. However, plant-based alternatives were unable to capitalize on this cost inflation due to their own rising ingredient costs. This persistent pricing gap is particularly evident in Eastern European markets, where lower disposable income levels restrict the ability of consumers to purchase premium food products. This dynamic creates a clear geographic segmentation, limiting the potential for market expansion in these regions. Furthermore, manufacturing scale economies remain insufficient to close the price gap with dairy products. The structural cost disadvantages stem from the complexity of plant-based ingredients and the specialized processing methods required, which continue to prevent the achievement of price parity with conventional dairy.
Ultra-processing perception and additive backlash
In Europe, a growing number of consumers are actively avoiding plant-based milk alternatives, driven by the desire to reduce their consumption of ultra-processed foods. This behavior is influenced by the EU's Novel Food classification of plant-based milks, which, despite many formulations containing simple ingredients, inadvertently reinforces the perception of these products as heavily processed. To address these concerns, brands are increasingly adopting clean-label strategies that focus on reducing the number of ingredients and providing greater transparency about processing methods. However, educating consumers remains a significant challenge due to the diverse food cultures across European markets, which shape varying perceptions and expectations. Additionally, there is an inherent conflict between the need to fortify plant-based milk alternatives for nutritional adequacy and the clean-label messaging that emphasizes simplicity. The inclusion of essential micronutrients, while necessary for nutritional balance, is often perceived negatively as these additions appear as additives on ingredient lists. This perception issue is particularly pronounced in the premium market segments, where consumers demand both nutritional completeness and ingredient simplicity. These conflicting demands create significant formulation challenges, limiting the flexibility of product development and innovation in this category.
*Our forecasts treat driver/restraint impacts as directional, not additive. The impact forecasts reflect baseline growth, mix effects, and variable interactions.
Segment Analysis
By Product Type: Soy Maintains Lead Despite Hemp Innovation
Soy milk accounts for 43.02% of the market share in 2025, highlighting its established consumer base and protein content that closely resembles dairy milk. Medical professionals recommend soy milk for its benefits in managing cholesterol and supporting menopausal health, enhancing its popularity, particularly among older consumers. Hemp milk is the fastest-growing segment, with a projected CAGR of 15.88% through 2031. Its growth is driven by its complete amino acid profile and regulatory clarity provided by the EFSA's guidance on hemp-derived food ingredients. Oat milk continues to grow, particularly in barista channels, while coconut milk maintains stable retail performance despite concerns about its water footprint. Cashew milk is positioning itself as a premium option due to its creamy texture, and hazelnut milk is gaining traction in confectionery and dessert applications.
The development of these segments is fueled by advancements in protein extraction techniques and the incorporation of functional ingredients. Manufacturers are increasingly adopting hybrid formulations that combine multiple plant sources to improve nutritional profiles. However, almond milk faces challenges in its supply chain due to Mediterranean droughts and strict water-footprint regulations. Meanwhile, the European Commission's protein diversification strategy, supported by CAP incentives, promotes legume cultivation, particularly favoring soy and pea-based alternatives over water-intensive nut varieties. Additionally, the segment is expanding with the introduction of novel protein sources such as microalgal biomass and precision fermentation-derived ingredients. The EFSA's Novel Food pathways are facilitating commercial approvals, enabling these innovative formulations to move beyond traditional plant-based categories.


By Flavor: Unflavored Dominance Challenged by Innovation
Unflavored variants maintain 66.88% market share in 2025, reflecting consumer preference for versatile products suitable for both beverage and cooking applications. European consumers are increasingly prioritizing “natural,” “unsweetened,” and “low-sugar” claims, particularly within plant-based categories. Flavored segments grow at 15.22% CAGR through 2031, driven by ready-to-drink innovations and convenience-focused consumption occasions that target on-the-go demographics. Vanilla remains the dominant flavored variant, while chocolate and strawberry options expand through retail partnerships with major European grocery chains. Seasonal and limited-edition flavors create premium positioning opportunities, with manufacturers leveraging social media marketing to drive trial and repeat purchase behavior.
Product development cycles have accelerated to capture emerging flavor trends, with manufacturers pursuing collaborations with European confectionery brands to create co-branded variants that leverage established taste preferences. The flavored segment's growth reflects broader beverage industry trends toward functional ingredients and adaptogenic compounds that position plant-based milk as wellness products rather than dairy substitutes. Regulatory frameworks under EU food additive regulations require careful formulation management for flavored variants, particularly regarding natural versus artificial flavor classifications that affect clean-label positioning strategies. Sugar reduction initiatives across European markets drive innovation in natural sweetening systems, with manufacturers exploring fruit-based and plant-derived sweeteners that maintain taste appeal while supporting health-conscious messaging.
By Packaging: PET Bottles Lead While Cans Gain Traction
PET bottles hold a 48.23% market share in 2025, leveraging consumer familiarity and retail display benefits that drive impulse purchases. PET's oxygen and moisture resistance preserves the flavor and nutrients of non-dairy milk, ensuring an extended shelf life in both refrigerated and ambient conditions. Cans, with their shelf-stable properties and reduced cold-chain requirements, achieve a 14.62% CAGR growth through 2031, cutting distribution costs across European markets. Cartons continue to perform steadily in family-size formats, while innovative designs like flat-pack packaging lower transportation costs and reduce environmental impact. Moreover, portion-controlled packaging formats are increasingly popular for single-serve consumption, particularly in foodservice and workplace vending applications.
Sustainability is playing a growing role in packaging decisions, with the European Commission's circular economy initiatives promoting recyclable materials and reduced packaging waste across food categories. Demonstrating the industry's focus on packaging innovation, Veganz Group raised EUR 10 million in funding in 2024 to expand its 2D-printed packaging technology for oat milk products. The packaging segment aligns with broader European regulatory trends, such as extended producer responsibility and deposit return systems, which influence material selection and design optimization. Advances in barrier technology now allow products previously requiring refrigeration to be stored ambiently, expanding their distribution into convenience retail channels that lack cold storage facilities.
By Distribution Channel: Off-Trade Dominance with On-Trade Growth
Off-trade channels hold a significant 77.55% market share in 2025, highlighting a strong consumer preference for home consumption and the ability to compare prices across various retail formats. On the other hand, on-trade segments are experiencing robust growth, with a 15.41% CAGR projected through 2031. This growth is primarily driven by foodservice operators integrating plant-based milk into their offerings and coffee shops expanding their menus, which is helping to normalize plant-based milk consumption. Supermarkets and hypermarkets continue to dominate as key retail channels. However, online retail is gaining traction, fueled by subscription services and direct-to-consumer brands that bypass traditional distribution intermediaries. Convenience stores, particularly in urban areas with high foot traffic and limited refrigeration, effectively cater to impulse purchases.
This shift in channels reflects evolving consumer shopping behaviors and the foodservice industry's efforts to adapt to diverse dietary preferences. Oatly's expanding partnership with McDonald's in the Netherlands exemplifies the development of on-trade channels. Major foodservice chains are increasingly incorporating plant-based alternatives into their standard menus, moving away from treating them as specialty items. Specialist retailers remain crucial for premium and organic segments, offering opportunities for product education and brand discovery, which support market growth beyond mainstream channels. However, the European Commission's proposals to strengthen farmers' positions in food supply chains could impact distribution channel margins and contractual agreements. This is particularly relevant for smaller plant-based brands, which often face challenges in negotiating with large retail chains.
Geography Analysis
Germany holds a 23.76% market share in 2025, driven by its advanced organic retail infrastructure and consumers' willingness to pay a premium for sustainable food. Major discount retailers in Germany are mainstreaming these sustainable products through competitive pricing strategies. The country's plant-based food market has exhibited steady growth, indicating momentum that surpasses pandemic-driven buying patterns and is expected to continue expanding through 2031. German consumers show a strong preference for oat-based alternatives, supported by the nation's agricultural production and well-established cereal processing capabilities, which reduce supply chain risks. Additionally, the growth of private-label products across German retail chains is increasing accessibility. Retailers achieve this while maintaining quality standards through direct supplier relationships and vertical integration strategies.
France and Italy, both established markets in Western Europe, are projected to grow from 2026 to 2031. This growth will be driven by foodservice integration and the premium positioning of products, leveraging Mediterranean dietary traditions. Danone's EUR 43 million investment in converting a facility in France to expand oat milk production highlights this trend. In Italy, consumers are increasingly adopting plant-based substitutes, particularly in traditional dairy applications. Coffee preparation is a key area where improvements in barista functionality enable a seamless transition to these alternatives. Both France and Italy benefit from EU agricultural policies that support protein crop cultivation and the development of processing infrastructures. These policies not only reduce reliance on imported ingredients but also strengthen supply chain resilience.
Russia is experiencing remarkable 14.92% CAGR growth, a trend expected to persist through 2031. This growth is primarily driven by rapid urbanization and rising disposable incomes, which are fueling the expansion of premium food categories, even in markets traditionally dominated by Europe. This growth is occurring despite geopolitical tensions that have impacted the presence of international brands. Domestic manufacturers are capitalizing on this opportunity by utilizing local production and distribution strategies. Meanwhile, Eastern European countries, including Poland and the Netherlands, are seeing accelerated adoption of premium food categories. This shift is largely attributed to economic growth that improves consumer access and increasing health awareness among urban populations. For European manufacturers, these emerging markets offer significant opportunities for geographic diversification beyond the saturated Western European markets. However, success will depend on navigating regulatory requirements and building robust distribution infrastructures.
Competitive Landscape
The European plant-based milk market is moderately fragmented, with established dairy giants utilizing distribution advantages, while specialized plant-based companies target premium segments through innovation-driven differentiation strategies. Diverse consumer preferences across product types and geographic markets limit market concentration, creating opportunities for both large-scale manufacturers and niche players to coexist with distinct positioning. Leading players such as Danone and Nestlé are actively pursuing acquisitions to expand their plant-based portfolios. For instance, Danone's acquisition of Kate Farms highlights its focus on specialized nutrition segments that command premium pricing. Technology adoption is centered on integrating functional ingredients and optimizing processing. Innovations in precision fermentation and protein extraction are improving product performance, particularly in professional applications.
Prominent companies in the market include Calidad Pascual SAU, Danone SA, Oatly Group AB, Blue Diamond Growers, and Nestlé SA. These companies are making significant investments in research and development to develop innovative plant-based dairy products, with a focus on enhancing taste, nutrition, and flavor variety. Many players are demonstrating operational agility by quickly adapting to shifting consumer preferences, expanding production capacities, and modernizing facilities to meet increasing demand. Strategic initiatives include partnerships with retailers and foodservice operators to strengthen distribution networks, as well as pursuing geographical expansion through organic growth and acquisitions. Sustainability remains a priority, with companies emphasizing eco-friendly packaging, responsible sourcing, and supply chain optimization.
Strategic opportunities exist in hybrid dairy-plant formulations and novel protein sources that address nutritional gaps while maintaining clean-label preferences. The European Investment Bank's EUR 100 million investment in Mueller Group reflects institutional support for capacity expansion and technological advancements within the plant-based value chain. Emerging disruptors are leveraging direct-to-consumer channels and subscription models to bypass traditional retail gatekeepers. Meanwhile, established companies face challenges with channel conflicts between their plant-based and dairy product lines. Regulatory compliance with EU Novel Food pathways creates entry barriers for smaller firms lacking expertise, while enabling ingredient innovation for resource-rich companies, supporting their differentiation strategies.
Europe Non-Dairy Milk Industry Leaders
-
Calidad Pascual SAU
-
Danone SA
-
Oatly Group AB
-
Blue Diamond Growers
-
Nestle SA
- *Disclaimer: Major Players sorted in no particular order

Recent Industry Developments
- July 2025: Califia Farms, a US-based brand, has introduced two nut-flavored blends—pistachio and hazelnut—to its oat barista drink range in the UK. These plant-based blends address the increasing demand for flavored coffee, providing consumers with a cost-effective alternative to sugary coffee syrups.
- July 2025: Danone-owned Alpro, a leader in plant-based dairy, has unveiled a new kids' range in the UK. This range introduces low-sugar milk and yogurt alternatives, including chocolate oat milk, strawberry soy milk, and vanilla and strawberry soy yogurts, all containing 30% less sugar.
- May 2025: Califia Farms leveraged global flavor trends to introduce its next-gen barista blends. These new products, launched at the 2025 London Coffee Festival, highlight how plant-based milk brands are revitalizing the category through flavor innovation.
- June 2024: Danone invested EUR 43 million to convert a French dairy facility into a dedicated oat milk production site. This marks the largest single investment in plant-based capacity in Europe and emphasizes Danone's commitment to enhancing the domestic supply chain.


Europe Non-Dairy Milk Market Report Scope
Almond Milk, Cashew Milk, Coconut Milk, Hazelnut Milk, Hemp Milk, Oat Milk, Soy Milk are covered as segments by Product Type. Off-Trade, On-Trade are covered as segments by Distribution Channel. Belgium, France, Germany, Italy, Netherlands, Russia, Spain, Turkey, United Kingdom are covered as segments by Country.| Almond Milk |
| Cashew Milk |
| Coconut Milk |
| Hazelnut Milk |
| Hemp Milk |
| Oat Milk |
| Soy Milk |
| Others |
| Flavored |
| Unflavored |
| PET Bottles |
| Cans |
| Cartons |
| Others |
| Off-Trade | Supermarkets/ Hypermarkets |
| Convenience Stores | |
| Online Retail | |
| Specialist Retailers | |
| Other Distribution Channels | |
| On-Trade (HoReCa) |
| United Kingdom |
| Germany |
| France |
| Italy |
| Spain |
| Russia |
| Sweden |
| Belgium |
| Poland |
| Netherlands |
| Rest of Europe |
| By Product Type | Almond Milk | |
| Cashew Milk | ||
| Coconut Milk | ||
| Hazelnut Milk | ||
| Hemp Milk | ||
| Oat Milk | ||
| Soy Milk | ||
| Others | ||
| By Flavor | Flavored | |
| Unflavored | ||
| By Packaging | PET Bottles | |
| Cans | ||
| Cartons | ||
| Others | ||
| By Distribution Channel | Off-Trade | Supermarkets/ Hypermarkets |
| Convenience Stores | ||
| Online Retail | ||
| Specialist Retailers | ||
| Other Distribution Channels | ||
| On-Trade (HoReCa) | ||
| By Country | United Kingdom | |
| Germany | ||
| France | ||
| Italy | ||
| Spain | ||
| Russia | ||
| Sweden | ||
| Belgium | ||
| Poland | ||
| Netherlands | ||
| Rest of Europe | ||


Market Definition
- Dairy Alternatives - Dairy alternatives are foods that are made from plant-based milk/oils instead of their usual animal products, such as cheese, butter, milk, ice cream, yogurt, etc. Plant-based or non-dairy milk alternative is the fast-growing segment in the newer food product development category of functional and specialty beverage across the globe.
- Non-Dairy Butter - Non dairy butter is a vegan butter alternative that is made from a mixture of plant oils. With an increase in alternative diets like vegetarianism, veganism, and gluten intolerance, plant butter is a healthy non-dairy substitute for normal butter.
- Non-Dairy Ice Cream - Plant based ice cream is a growing category. Non-dairy ice cream is a type of dessert made without any animal ingredients. This is typically considered a substitute for regular ice cream for those who cannot or do not eat animal or animal-derived products, including eggs, milk, cream, or honey.
- Plant-Based Milk - Plant based milks are milk substitutes that are made from nuts (e.g., hazelnuts, hemp seeds), seeds (e.g., sesame, walnuts, coconuts, cashews, almonds, rice, oats, etc.) or legumes (e.g., soy). Plant-based milk such as soy milk and almond milk have been popular in East Asia and the Middle East for centuries.
| Keyword | Definition |
|---|---|
| Cultured Butter | Cultured butter is prepared by having the raw butter go through chemical processing and has been added with certain emulsifiers and foreign ingredients. |
| Uncultured Butter | This type of butter is one which has not been processed in any way |
| Natural Cheese | The type of cheese in its most natural form. It is made from natural and simple products and ingredients, including fresh and natural salts, natural colors, enzymes, and high-quality milk. |
| Processed Cheese | Processed cheese undergoes the same processes as natural cheese; however, it requires more steps and many different forms of ingredients. Making processed cheese involves melting natural cheese, emulsifying it, and adding preservatives and other artificial ingredients or colorings. |
| Single Cream | Single cream contains around 18% fat. It’s a single layer of cream that appears over boiled milk. |
| Double Cream | Double cream contains 48% fat, more than double the amount of fat of single cream. It’s heavier and thicker than single cream |
| Whipping Cream | This has a much higher fat percentage than single cream (36%). Used to top cakes, pies, and puddings and as a thickener for sauces, soups, and fillings. |
| Frozen Desserts | Desserts that are meant to be eaten in frozen condition. E.g., sherbets, sorbets, frozen yogurts |
| UHT Milk (Ultra-high temperature milk) | Milk heated at a very high temperature. Ultra-high-temperature processing (UHT) of milk involves heating for 1–8 sec at 135–154°C. which kills the spore-forming pathogenic microorganism, resulting in a product with a shelf-life of several months. |
| Non-dairy butter/Plant-based butter | Butter made from plant-derived oil such as coconut, palm, etc. |
| Non-dairy Yogurt | Yogurt made from typically made from nuts, like almonds, cashews, coconuts, and even other foods like soybeans, plantains, oats, and peas |
| On-trade | It refers to restaurants, QSRs, and bars. |
| Off-trade | It refers to supermarkets, hypermarkets, on-line channels, etc. |
| Neufchatel cheese | One of the oldest kinds of cheese in France. It is a soft, slightly crumbly, mold-ripened, bloomy-rind cheese made in the Neufchâtel-en-Bray region of Normandy. |
| Flexitarian | It refers to a consumer preferring a semi-vegetarian diet, that is centered on plant foods with limited or occasional inclusion of meat. |
| Lactose Intolerance | Lactose intolerance is a reaction in digestive system to lactose, the sugar in milk. It causes uncomfortable symptoms in response to the consumption of dairy products. |
| Cream Cheese | Cream cheese is a soft and creamy fresh cheese with a tangy taste made from milk and cream. |
| Sorbets | Sorbet is a frozen dessert made using ice combined with fruit juice, fruit purée, or other ingredients, such as wine, liqueur, or honey. |
| Sherbet | Sherbet is a sweetened frozen dessert made with fruit and some sort of dairy product such as milk or cream. |
| Shelf stable | Foods that can be safely stored at room temperature, or "on the shelf," for at least one year and do not have to be cooked or refrigerated to eat safely. |
| DSD | Direct Store Delivery is the process in supply chain management wherein the product is delivered from manufacturing plant directly to the retailer. |
| OU Kosher | Orthodox Union Kosher is a kosher certification agency based in New York City. |
| Gelato | Gelato is a frozen creamy dessert made with milk, heavy cream and sugar. |
| Grass-fed Cows | Grass-fed cows are allowed to graze in pastures, where they eat a variety of grasses and clover. |


Research Methodology
Mordor Intelligence follows a four-step methodology in all our reports.
- Step-1: Identify Key Variables: In order to build a robust forecasting methodology, the variables and factors identified in Step 1 are tested against available historical market numbers. Through an iterative process, the variables required for market forecast are set, and the model is built on the basis of these variables.
- Step-2: Build a Market Model: Market-size estimations for the forecast years are in nominal terms. Inflation is not a part of the pricing, and the average selling price (ASP) is kept constant throughout the forecast period for each country.
- Step-3: Validate and Finalize: In this important step, all market numbers, variables, and analyst calls are validated through an extensive network of primary research experts from the market studied. The respondents are selected across levels and functions to generate a holistic picture of the market studied.
- Step-4: Research Outputs: Syndicated Reports, Custom Consulting Assignments, Databases & Subscription Platforms


