
Soy Milk Market Size and Share
Market Overview
| Study Period | 2021 - 2031 |
|---|---|
| Market Size (2026) | USD 12.28 Billion |
| Market Size (2031) | USD 17.07 Billion |
| Growth Rate (2026 - 2031) | 6.80 % |
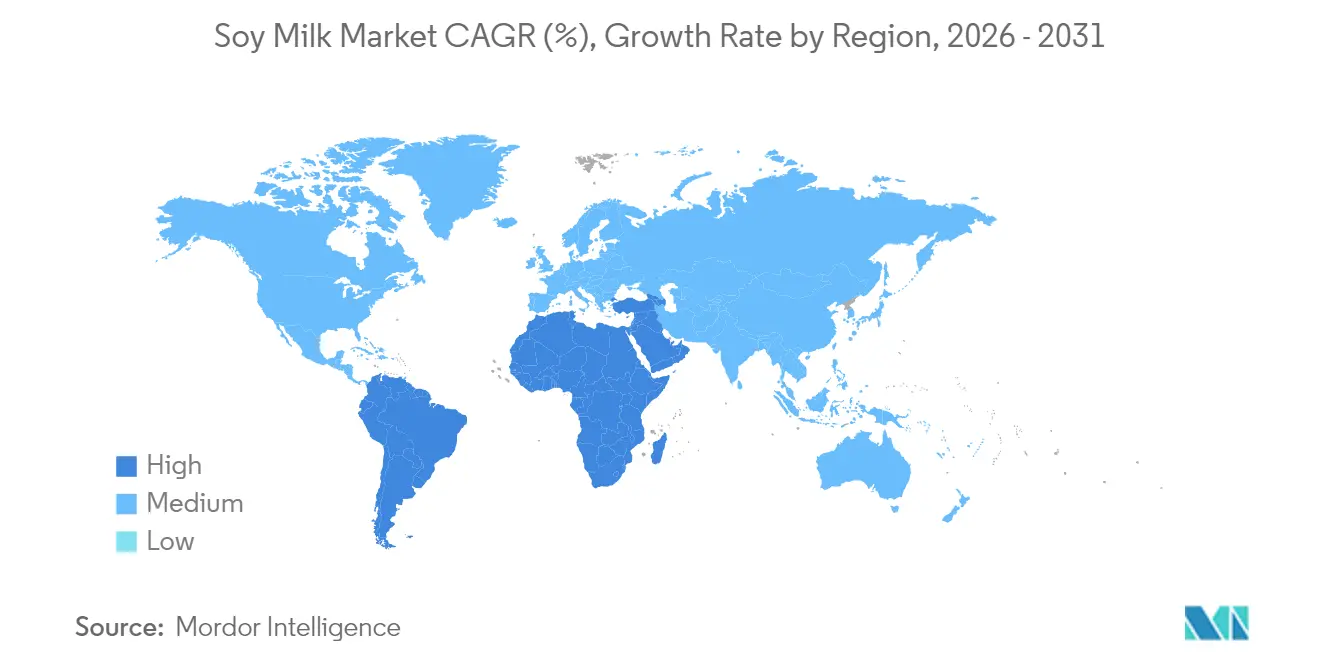
| Fastest Growing Market | Middle East and Africa |
| Largest Market | Asia Pacific |
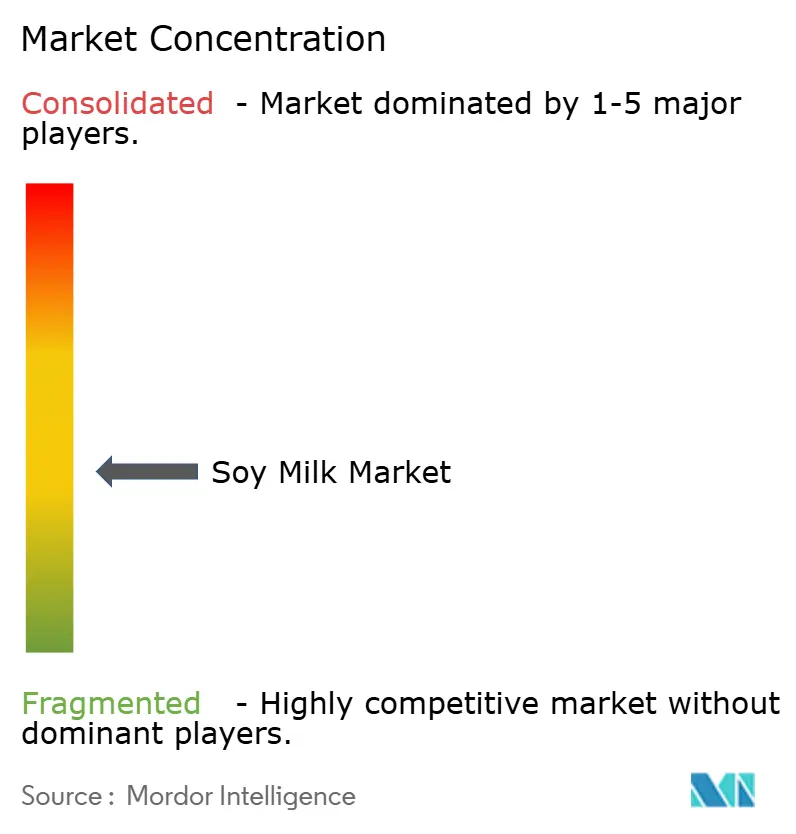
| Market Concentration | Medium |
Major Players
*Disclaimer: Major Players sorted in no particular order Image © Mordor Intelligence. Reuse requires attribution under CC BY 4.0. |
|
Soy Milk Market Analysis by Mordor Intelligence
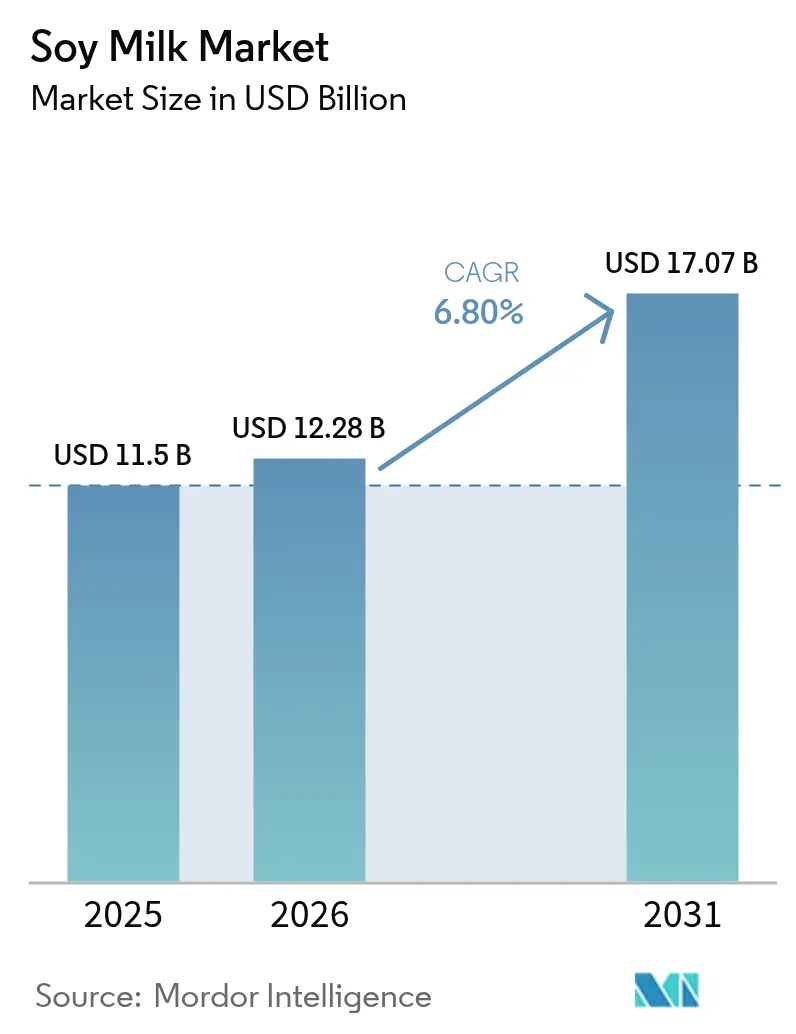
The soymilk market size in 2026 is estimated at USD 12.28 billion, growing from 2025 value of USD 11.50 billion with 2031 projections showing USD 17.07 billion, growing at 6.8% CAGR over 2026-2031. Several factors contribute to this growth, including increased health awareness and growing concerns about sustainability among consumers. The rising cases of lactose intolerance and milk allergies worldwide have driven consumers toward soymilk, a naturally lactose-free and hypoallergenic alternative. The adoption of vegan and flexitarian diets, particularly among younger and urban populations, has accelerated the transition from traditional dairy products. Soymilk's nutritional composition, which includes high-quality protein, essential amino acids, vitamins, and minerals, appeals to health-conscious consumers seeking nutritious beverages. Improvements in food processing technology have enhanced soymilk's taste, texture, and shelf life, addressing previous consumer concerns. The increased availability of soymilk through supermarkets, convenience stores, and online platforms, supported by marketing campaigns and celebrity endorsements, has improved product accessibility. Additionally, government policies and regulations supporting plant-based diets for environmental and health benefits have contributed to market growth.
Key Report Takeaways
- By product type, unflavored soy milk lines captured 77.68% of the soy milk market share in 2025, while flavored variants are forecast to expand at a 7.01% CAGR to 2031.
- By form, ready-to-drink (RTD) formats controlled 73.75% share of the soy milk market size in 2025; powder formats are projected to grow at a 12.57% CAGR through 2031.
- By packaging type, aseptic cartons led with 46.78% revenue share in 2025, whereas flexible pouches are set to post a 12.18% CAGR to 2031.
- By distribution channel, supermarkets/hypermarkets held 54.02% of 2025 sales, while online channels recorded the fastest growth at 13.34% CAGR.
- By geography, Asia-Pacific captured 66.88% of 2025 revenue; the Middle East and Africa are expected to register the highest regional CAGR of 11.34% through 2031.
Note: Market size and forecast figures in this report are generated using Mordor Intelligence’s proprietary estimation framework, updated with the latest available data and insights as of 2026.
Market Trends and Insights
Drivers Impact Analysis of Soy Milk Market*
| Driver | (~) % Impact on CAGR Forecast | Geographic Relevance | Impact Timeline |
|---|---|---|---|
| Adoption of soy milk in foodservice channels | +1.2% | Global, with strongest gains in North America and Europe | Medium term (2-4 years) |
| Increasing adoption of vegan and vegetarian diets | +1.8% | Global, led by Europe and North America, expanding to Asia-Pacific | Long term (≥ 4 years) |
| Product innovations and diverse flavors expand market reach | +0.9% | Global, with premium positioning in developed markets | Short term (≤ 2 years) |
| Nutritional benefits propel market growth | +1.4% | Global, particularly strong in health-conscious demographics | Long term (≥ 4 years) |
| EU carbon-footprint labelling favouring soy beverages | +0.7% | Europe, with spillover effects to other regulated markets | Medium term (2-4 years) |
| E-commerce milk-subscription boom | +0.8% | Global, led by urban markets in developed economies | Short term (≤ 2 years) |
| Source: Mordor Intelligence | |||
Adoption of Soy Milk in Foodservice Channels
The foodservice industry's adoption of soy milk is driving market growth, as institutional buyers select plant-based alternatives to meet dietary requirements and manage costs. Foodservice operators choose soy milk for its high protein content and operational efficiency in large-scale food preparation. Among plant-based alternatives, soy milk's protein composition is most similar to dairy milk, making it suitable for institutional nutrition programs. The demand for specialized barista formulations is increasing, particularly from coffee chains and restaurants that require products that maintain foam stability and prevent curdling in hot beverages. The removal of additional charges for non-dairy milk options by Starbucks in October 2024 demonstrates the growing institutional acceptance and demand for plant-based alternatives, including soy milk. The foodservice sector values soy milk's consistent supply and standardized nutritional content over alternatives like almond or oat milk, which face greater raw material price and availability fluctuations. This widespread adoption in foodservice establishments supports sustained market growth beyond retail consumer trends, establishing soy milk as an essential component of the food industry.
Increasing Adoption of Vegan and Vegetarian Diets
The global soy milk market is experiencing substantial growth due to the increasing adoption of vegan and vegetarian diets, primarily driven by health consciousness, environmental sustainability concerns, ethical considerations, and economic factors. Consumer preferences are shifting towards plant-based alternatives due to rising awareness of lactose intolerance, concerns about cholesterol levels, and the environmental impact of traditional dairy farming. The market growth is further propelled by technological advancements in processing methods, enhanced product formulations, and significant investments in research and development. According to World Population Review, India and Mexico's vegan population reached 9% in 2025, particularly supported by the rapid expansion of modern retail formats, increasing urbanization, rising disposable incomes, and growing awareness of plant-based nutrition benefits [1]Source: World Population Review, "Veganism by Country 2025", worldpopulationreview.com . This shift is further accelerated by the expansion of retail distribution networks, product innovations in taste and nutritional content, and increasing investments in plant-based protein technologies across the food and beverage industry.
Product Innovations and Diverse Flavors Expand Market Reach
Product innovation and flavor diversification are driving the expansion of the global soy milk market through strategic responses to consumer demands for health benefits and taste preferences. The market growth is primarily influenced by increasing health consciousness, rising lactose intolerance cases, and the growing adoption of plant-based diets. Manufacturers are responding to these trends by developing enhanced soy milk products beyond traditional plain varieties, utilizing advanced processing technologies and ingredient formulations. Companies have systematically expanded their product portfolios to include vanilla, chocolate, and functional variants fortified with calcium, vitamin D, and omega-3s, addressing specific nutritional requirements. This trend is exemplified by Lactasoy's March 2023 launch of a chocolate-flavored soy milk with 26% reduced sugar content, directly addressing the growing consumer demand for healthier alternatives in the flavored beverage segment. The product contains nine amino acids and omega-3, 6, and 9, strategically targeting the expanding demographic of consumers seeking chocolate flavor with additional protein benefits. These systematic innovations particularly resonate with younger consumers and flexitarians who demonstrate a consistent preference for products that balance taste and nutritional value in their beverage choices.
Nutritional Benefits Propels Market Growth
The global soy milk market growth is driven by its nutritional benefits, as consumers seek healthier beverage alternatives. Soy milk contains all nine essential amino acids and offers protein quality and digestibility comparable to cow's milk. Its cholesterol-free composition and low saturated fat content appeal to consumers focused on heart health management. Commercial soy milk products are typically fortified with calcium, vitamin D, and vitamin A at levels equivalent to dairy milk, addressing nutritional requirements for consumers who reduce dairy intake. The beverage also contains potassium and unsaturated fatty acids, with studies indicating potential anti-inflammatory effects and reduced risks of cardiovascular disease, certain cancers, and menopausal symptoms. These health benefits influence product development in the market. For instance, in December 2024, Tofusan launched a sugar-free soy milk in Thailand, combining soybeans and black sesame seeds to provide 29 grams of protein. The product features sesamin, an antioxidant with anti-aging properties, and is lactose-free.
Restraints Impact Analysis of Soy Milk Market*
| Restraint | (~) % Impact on CAGR Forecast | Geographic Relevance | Impact Timeline |
|---|---|---|---|
| Allergen-labelling tightening for soy milk | -0.4% | Global, with strictest enforcement in North America and Europe | Short term (≤ 2 years) |
| Soybean price volatility hinders market growth | -0.8% | Global, with highest impact in price-sensitive markets | Medium term (2-4 years) |
| Shelf-life limitations in rural or underdeveloped areas | -0.3% | Emerging markets, particularly rural areas in Asia-Pacific and Africa | Long term (≥ 4 years) |
| Competition from other plant-based milks | -1.1% | Global, with intense competition in developed markets | Medium term (2-4 years) |
| Source: Mordor Intelligence | |||
Allergen-Labelling Tightening for Soy Milk
The implementation of increasingly stringent allergen-labeling regulations for soy milk represents a substantial market restraint, as regulatory authorities worldwide strengthen their oversight measures to protect consumers with food allergies. The Food and Drug Administration (FDA) categorizes soybeans as one of the nine major food allergens, along with milk, eggs, fish, crustacean shellfish, tree nuts, peanuts, wheat, and sesame, necessitating a comprehensive declaration on all packaged food labels. In January 2025, the Food and Drug Administration (FDA) issued revised guidance emphasizing explicit allergen labeling, mandating manufacturers to specify soy and other major allergens in both the ingredient list and a contains statement. These regulatory requirements, while fundamental for consumer safety and transparency, impose substantial compliance burdens on soy milk producers, particularly in critical areas of ingredient sourcing documentation, manufacturing process validation, and cross-contamination prevention protocols.
Soybean Price Volatility Hinders Market Growth
Soybean price volatility significantly constrains the global soy milk market by affecting production costs and supply chain operations. Since soybeans are the key ingredient in soy milk production, price fluctuations caused by weather conditions, geopolitical issues, and agricultural output variations affect manufacturers' pricing decisions, margins, and production volumes. The increase in global soybean prices has raised manufacturing costs, making it difficult for producers to maintain competitive retail prices while preserving profitability. In Japan, this impact is evident through data from the Japan Soy Milk Association, which reported that soy milk product shipping volume decreased to 394.62 thousand kiloliters in 2023, continuing the decline from previous years [2]Source: Japan Soy Milk Association, " Soy Milk Production Volume Survey, January-march 2025", tounyu.jp . This reduction correlates with increased input costs and market inflation from higher raw material prices. As a result, the persistent volatility in soybean prices poses a substantial challenge to market growth, affecting both manufacturers' operational strategies and market expansion potential.
*Our forecasts treat driver/restraint impacts as directional, not additive. The impact forecasts reflect baseline growth, mix effects, and variable interactions.
Soy Milk Market Segment Analysis
By Packaging Type:
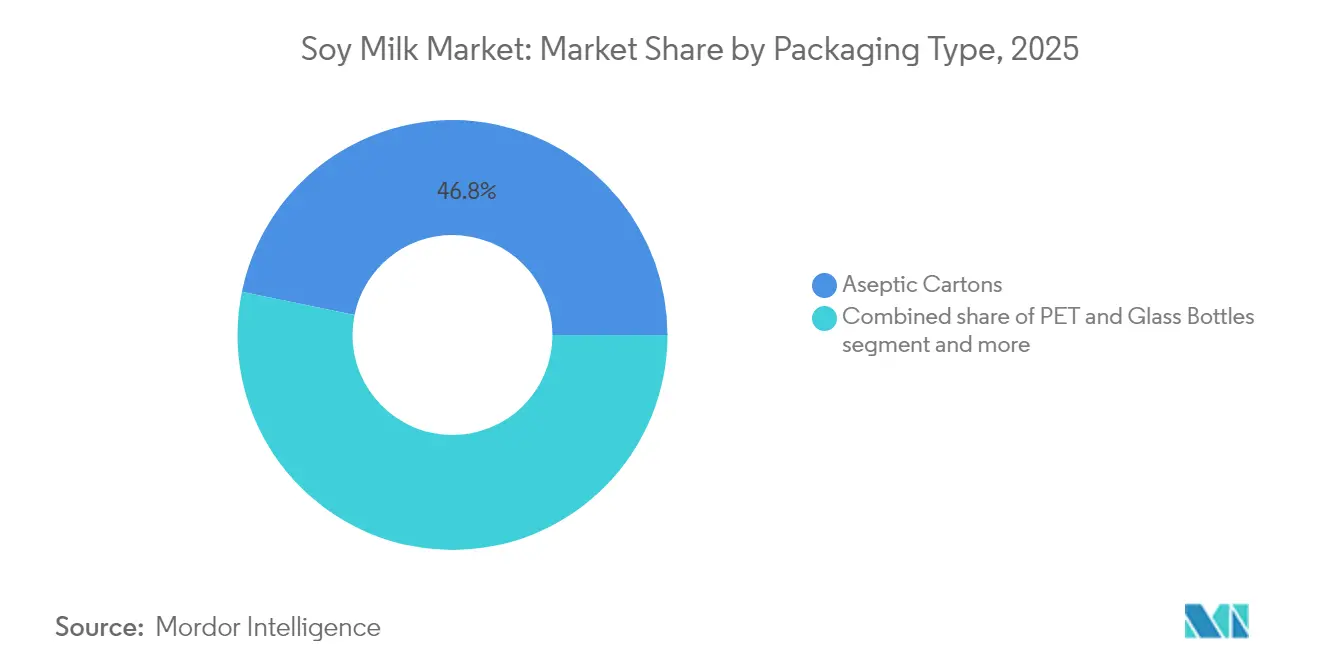
Sustainable Innovation Drives Flexible Packaging GrowthAseptic cartons maintain market leadership in the soy milk packaging segment, commanding a 46.78% share in 2025. This market position is attributed to their demonstrated capabilities in product preservation, ambient temperature shelf life extension, and stringent safety standards maintenance. The format has established substantial market penetration and consumer acceptance across international markets, positioning it as the primary packaging solution for residential consumption and portable applications. Aseptic cartons demonstrate full compliance with the European Union's Packaging and Packaging Waste Regulation, which mandates comprehensive packaging recyclability and establishes a 5% reduction target in packaging waste. This regulatory adherence enhances their environmental sustainability credentials and compels industry stakeholders to implement this packaging format to address regulatory requirements and evolving consumer environmental preferences.
Flexible pouches demonstrate significant market momentum as the fastest-expanding packaging segment, exhibiting a compound annual growth rate of 12.18% through 2031. This growth trajectory is attributed to their material efficiency, optimized logistics costs, and reduced storage requirements, complemented by a compact structural design that resonates with environmentally conscious consumer segments. The format delivers operational advantages through integrated resealable mechanisms and enhanced portability characteristics, particularly resonating with younger demographic segments and household consumers. Moreover, PET and glass bottles maintain a consistent market presence in premium product categories, where packaging aesthetics and perceived quality metrics significantly influence consumer purchasing behavior. Other packaging formats, including bag-in-box and bulk containers, serve specialized applications in foodservice and industrial markets.



By Product Type:
Unflavored Dominance Faces Flavor Innovation ChallengeUnflavored soy milk maintains a substantial 77.68% market share in 2025, primarily attributed to its extensive utilization in traditional consumption patterns and institutional applications requiring neutral taste profiles. The segment's market dominance is reinforced by its fundamental role in food preparation processes and significant acceptance across multiple cultural demographics, particularly in Asian markets where consumer preferences align with neutral plant-based beverages. The production methodology of unflavored variants demonstrates operational efficiency through streamlined manufacturing processes and reduced ingredient requirements, facilitating competitive price points that drive market expansion in price-sensitive regions.
The flavored soy milk segment demonstrates robust growth prospects with a projected 7.01% CAGR through 2031, attributed to increasing consumer demand for enhanced taste profiles and strategic market expansion initiatives by manufacturers. Within this category, vanilla and chocolate variants maintain prominent positions, with vanilla products serving dual purposes in direct consumption and culinary applications, while chocolate variants specifically target youth demographics and dessert substitute markets. The segment encompasses additional flavor variations, including seasonal and regional formulations, which present opportunities for premium market positioning, although these subcategories currently maintain limited distribution networks and market penetration.
By Distribution Channel:
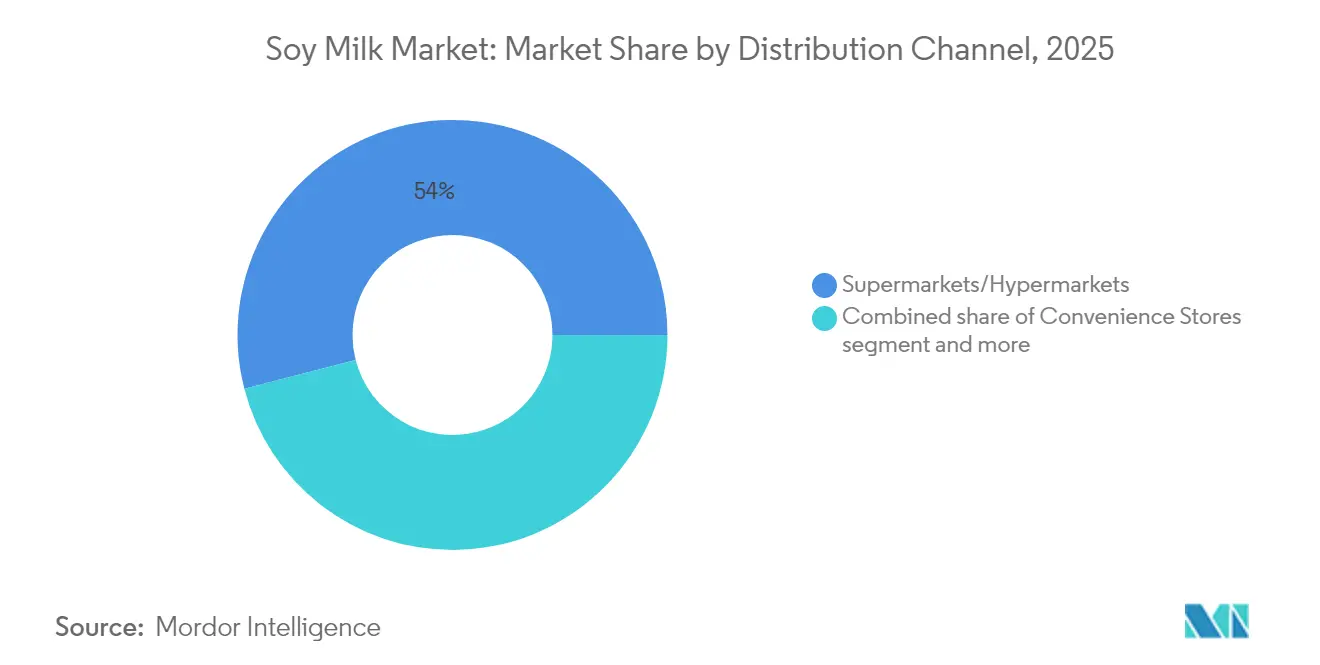
Digital Transformation Accelerates Online GrowthSupermarkets/hypermarkets maintain a dominant 54.02% distribution share in the soy milk market as of 2025. These large-format retail establishments facilitate comprehensive product visibility through strategically positioned plant-based sections and optimal shelf placement. Their extensive product portfolio encompasses fortified formulations, flavor variants, and multiple packaging configurations. The substantial consumer traffic and established shopping patterns enable systematic product comparison and access to structured promotional programs. These retail establishments maintain consistent product availability and market-competitive pricing through sophisticated supply chain networks and established manufacturer partnerships.
Online retail distribution demonstrates significant market momentum, achieving a 13.34% CAGR through 2031. This growth trajectory is attributed to structured subscription models, strategic direct-to-consumer implementations, and evolving consumer purchasing patterns. The online distribution channel has established specialized infrastructure for perishable and semi-perishable product management. Subscription-based distribution systems generate consistent revenue streams and enhance customer retention metrics, while direct-to-consumer frameworks enable manufacturers to optimize margins and establish direct customer relationships. Convenience retail establishments serve as strategic secondary distribution points, particularly for individual unit sales. On-trade channels, encompassing restaurants, cafes, and institutional foodservice, represent growing opportunities for volume expansion and brand building.
By Form:
Ready-to-Drink Leadership Challenged by Powder Segment GrowthReady-to-drink formats maintain a commanding 73.75% market share in 2025, attributed to their strategic positioning in convenience and well-established distribution infrastructure across retail and foodservice channels. The segment's market leadership is fundamentally driven by increasing consumer requirements for immediate consumption solutions and advanced packaging innovations that deliver superior portability and shelf stability characteristics. The implementation of aseptic processing technologies enables Ready-to-Drink (RTD) products to achieve extended shelf stability without refrigeration requirements, thereby optimizing distribution efficiency and minimizing supply chain operational costs.
The powder segment projects a 12.57% CAGR through 2031, supported by cost efficiency, longer shelf life, and increasing adoption in emerging markets with limited cold chain infrastructure. This format appeals to institutional buyers and price-sensitive consumers, creating a distinct market segment with specific competitive dynamics. Growth is significant in markets where consumers accept reconstitution processes and prioritize cost savings. The segment's expansion also comes from foodservice applications that value bulk preparation and storage efficiency. Improvements in powder processing technology enhance solubility and taste, reducing traditional barriers to adoption and expanding the consumer base.
Geography Analysis
APAC Soy Milk Market
Asia-Pacific holds 66.88% market share in 2025, driven by the deep cultural integration of soy-based beverages and robust manufacturing infrastructure in China, Japan, and South Korea. The region's growth is supported by expanding middle-class populations, rising health consciousness, and government policies promoting plant-based protein for food security. China's regulatory changes requiring sterilized milk production from raw milk create market opportunities for plant-based alternatives. The region's manufacturing capabilities and supply chain networks serve both domestic consumption and global export markets.
MEA Soy Milk Market
The Middle East and Africa region projects 11.34% CAGR through 2031, supported by increasing disposable incomes, health awareness, and government food security initiatives. The United Arab Emirates (UAE) position as a regional food distribution hub facilitates market entry for international brands. In 2023, the United States' exports of agricultural and related products to the United Arab Emirates reached USD 1.33 billion, with consumer-oriented goods accounting for over 75% of the increase . Moreover, the Food Innovation Laboratory at the University of the Free State (UFS) in South Africa launched affordable, protein-rich soy-based dairy alternatives in June 2024, addressing regional nutritional needs and food security concerns.
The Americas and Europe Soy Milk Market
North America and Europe maintain steady market growth through health awareness, environmental concerns, and supportive regulations for sustainable food systems. European markets benefit from carbon footprint labeling requirements and sustainability directives that advantage soy milk over dairy alternatives. North American manufacturers focus on processing capacity expansion and product development to meet consumer demand. South America leverages its soybean production advantage for cost-effective manufacturing, though market growth faces distribution and consumer awareness challenges.

Regulatory Landscape
Soy milk is covered under broader food safety and labeling regimes for packaged beverages, with soy recognized as a major allergen in key markets. In the United States, the FDA continues to shape category practices through its plant-based milk guidance process, with the draft guidance comment window closing on May 7, 2025, and it reiterates expectations around clear naming and consumer-facing labeling conventions for plant-based milk alternatives.
Regulatory scrutiny also centers on ingredient compliance and quality benchmarks. In the European Union, GMO soybean inputs used across soy beverage supply chains are governed through product-specific market authorizations, including Implementing Decision (EU) 2026/517 (March 2026) and Implementing Decision (EU) 2026/1185 (June 2026). In China, standards updates differentiate soy milk and soy milk powder requirements, including GB/T 18738-2025 for soy milk powder (published December 2025, implemented July 1, 2026) and revisions under GB/T 22106-2025 for non-fermented soy products. Localized standard setting also continued with T/XYDN 001-2026 for Xiangyang soy milk (issued January 2026, implemented February 2026).
Value Chain Analysis
The soy milk value chain starts with soybean cultivation and origination, where supply concentration in major producing countries (notably Brazil, the United States, and Argentina) links beverage manufacturers to global commodity and logistics cycles. Procurement then moves through aggregation, crushing, and ingredient processing (beans, protein fractions, oils), followed by beverage manufacturing steps such as heating, grinding, separation, formulation (including fortification), and thermal processing for shelf-stable formats. Packaging (aseptic cartons, bottles, pouches) and quality assurance complete the production stage.
Downstream, distribution covers modern trade, convenience, foodservice, and direct-to-consumer and online retail. Shelf-stable RTD products benefit from wider ambient logistics reach versus refrigerated lines. Key pinch points include soybean price volatility, the need for consistent protein and sensory performance in barista and institutional applications, and rising sustainability due diligence demands for import-dependent markets. For Europe-facing supply chains, the EU Deforestation Regulation (EUDR), scheduled to apply due diligence for medium and large operators from December 30, 2026, adds traceability and documentation requirements that influence sourcing strategies, supplier selection, and segregation for non-GMO and certified supply streams.
Competitive Landscape
The soy milk market exhibits moderate fragmentation, with established companies maintaining significant market shares through their vertical integration strategies, brand recognition, and distribution capabilities. Major players, including Danone S.A., Vitasoy International Holdings Ltd, The Hain Celestial Group Inc., and Kikkoman Corporation, employ distinct competitive strategies. Danone prioritizes brand portfolio optimization and sustainability positioning, while Vitasoy focuses on regional market leadership and product innovation.
The competitive landscape continues to transform as traditional dairy companies enter the plant-based segments, while specialized plant-based manufacturers expand their portfolios and geographic presence. Companies with strong supply chain integration hold an advantage, as soybean price fluctuations and processing efficiency directly influence profitability. Smaller companies are also gaining market presence, as demonstrated by Zambian manufacturer 260 Brands, which launched the country's first plant-based milk factory in Lusaka in October 2023. The company markets its plant-based milk under the Nutramilk brand.
Moreover, technology adoption creates competitive advantages, with leading manufacturers investing in advanced processing equipment, packaging innovations, and quality control systems to achieve premium positioning and operational efficiency. Patent activities in processing technologies, flavor systems, and nutritional enhancement highlight ongoing innovation competition. Companies aim to establish proprietary advantages in taste, nutrition, and manufacturing efficiency. The competitive landscape reflects shifting consumer preferences, with successful companies adapting their product portfolios and marketing strategies while maintaining operational efficiency and profitability in increasingly competitive markets.
Soy Milk Industry Leaders
-
Danone S.A.
-
Vitasoy International Holdings Ltd
-
The Hain Celestial Group Inc.
-
Campbell Soup Company
-
Kikkoman Corporation
- *Disclaimer: Major Players sorted in no particular order
Soy Milk Market Companies Covered in this Report
- Danone S.A.
- Vitasoy International Holdings Ltd
- The Hain Celestial Group Inc.
- Campbell Soup Company
- Kikkoman Corporation
- SunOpta Inc. (West Life)
- Eden Foods Inc.
- Fraser and Neave, Limited (F&N NutriSoy)
- The Hershey Company (Sofit)
- Samyuk Foods
- Earth's Own Food Company Inc.
- Dr. Chung's Food Co. Ltd.
- Granarolo S.p.A.
- Maeil Dairy Ind. Co. Ltd.
- Yeo Hiap Seng Ltd
- Yili Group
- Alt Co.
- Green Spot Co. Ltd
- Sanitarium Health and Wellbeing Company
- VV Food & Beverage Co. Ltd.

Market Opportunities and Future Outlook
Capacity build-out and localization of soy processing are creating openings in shelf-stable and powder formats, particularly where cold-chain constraints or import dependence raise costs. A specific signal comes from the February 2026 Eastern Ontario Development Fund grant (CAD 1.5 million) awarded to Alinova Canada Inc. to support development of Canada's first non-GMO soymilk powder processing facility in Morrisburg, using Ontario-grown soybeans. The grant points to investment momentum in onshored, identity-preserved supply for powder and industrial customers.
Competition is also pushing product and process differentiation toward higher-protein positioning and improved sensory performance, while scaled incumbents focus on efficiency gains. In May 2026, Oatside introduced its Nobo Soy range in Singapore and Malaysia using double-extraction technology and Canadian non-GMO soybeans (4.2 g protein per 100 ml), illustrating demand for technology-led taste and nutrition upgrades in urban retail markets. On the supply side, producers are tightening asset utilization and upstream programs: Vitasoy reported consolidation actions at its Dongguan factory in FY2025/2026, and Vinasoy highlighted export growth and piloted sustainable crop rotation models in Vietnam's key agricultural regions. Together, these moves support opportunities around vertically aligned sourcing, export-oriented portfolio planning, and cost stabilization.
Recent Industry Developments in Soy Milk Market
- June 2026: Vitasoy International Holdings Ltd released its FY2025/2026 results and highlighted progress on consolidating production at its Dongguan factory. The update reflects a focus on improving asset utilization and operating efficiency, which can support more competitive pricing and steadier supply for core soymilk lines across channels.
- November 2025: Danone expanded its US Silk portfolio with high-protein soy milk positioned at 13 g of plant protein per serving. The move underscores premiumization in soy-based beverages and raises the bar for protein-forward formulations as brands compete for space in plant-based dairy sets.
- July 2024: Sanitarium Health Food Company launched its PLANTWELL range, including a high-protein soy milk formulated with seaweed-derived calcium and prebiotic fibers. This product direction strengthens the functional nutrition segment in soy milk, pushing fortification and clinically supported ingredients as points of differentiation.


Soy Milk Market Report Scope and Research Methodology
Market Definition and Coverage
We define the soy milk market as the value of packaged soy-based milk beverages sold for household and foodservice consumption, counted at the point of sale by brands through retail and similar channels across major regions.
Scope exclusions: We exclude other plant-based milks, soy yogurt drinks, soy creamers, and bulk soy ingredients used mainly for industrial food manufacturing.
Segments Covered in This Report
-
By Product Type
- Unflavored Soy Milk
-
Flavored Soy Milk
- Vanilla
- Chocolate
- Others
-
By Form
- Ready-to-Drink (RTD)
- Powder
-
By Packaging Type
- Aseptic Cartons
- PET and Glass Bottles
- Flexible Pouches
- Others
-
By Distribution Channel
- On-Trade
-
Off-Trade
- Supermarkets/Hypermarkets
- Convenience Stores
- Online Retailers
- Other Off-Trade Channels
-
By Geography
-
North America
- United States
- Canada
- Mexico
- Rest of North America
-
Europe
- Germany
- United Kingdom
- Italy
- France
- Spain
- Netherlands
- Poland
- Belgium
- Sweden
- Rest of Europe
-
Asia-Pacific
- China
- India
- Japan
- Australia
- Indonesia
- South Korea
- Thailand
- Singapore
- Rest of Asia-Pacific
-
South America
- Brazil
- Argentina
- Colombia
- Chile
- Peru
- Rest of South America
-
Middle East and Africa
- South Africa
- Saudi Arabia
- United Arab Emirates
- Nigeria
- Egypt
- Morocco
- Turkey
- Rest of Middle East and Africa
-
North America
Data Sources, Market Sizing, and Validation
Desk Research
Desk research was used to set market boundaries, align unit economics, and build the starting demand picture across regions. We relied on public data and reference points such as USDA and other national agriculture agencies for soy supply signals, FAO food balance and commodity context, UN Comtrade trade flows for soy-based products where relevant, and World Bank macro indicators that help normalize per-capita consumption and price differences.
To connect supply indicators with retail demand, we also reviewed sources such as national food standards and labeling guidance (for what can be called soy milk), peer-reviewed nutrition journals on consumer shifts toward lactose-free and plant-based diets, and investor presentations and annual reports for pricing and portfolio direction. A paid subscription database was used selectively to cross-check company financials, patents activity, and shipment-level trade lines when public tables were not granular enough. These sources are illustrative only, and many other public and subscription references were used to validate data points and clarify assumptions.
Primary Interviews and Surveys
Primary work focused on confirming what portion of plant-based milk demand is truly soy, and how pricing moves by pack size, formulation, and channel in each region. We spoke with manufacturers, distributors, retailers, and category specialists across APAC, EMEA, and the Americas, so key gaps from desk research could be filled and the final assumptions stress-tested before results were locked.
Distribution of primary research fieldwork respondents
| Company type | Respondent position | Region |
|---|---|---|
| Top tier: 35% | CXOs: 12% | APAC: 48% |
| Mid tier: 43% | Functional/Unit leaders: 30% | EMEA: 30% |
| Smaller Players: 22% | Managers: 58% | Americas: 22% |
Market-Sizing & Forecasting
Market size was built using a top-down and bottom-up mix, where the top-down view starts from plant-based milk consumption and retail sales signals, then gets filtered to the soy share by region and channel. To keep the numbers realistic, we reconstructed the demand pool using repeatable drivers such as soy milk penetration within plant-based milk, average pack sizes, channel mix (modern retail versus convenience and online), and observed price bands by country.
We then corroborated results with selective bottom-up checks, including sampled brand-and-channel price tracking using ASP logic, sanity checks using trade and production direction, and supplier or distributor roll-ups in markets where market structure is concentrated. For forecasting, we used scenario analysis so the model can reflect different outcomes for household adoption, price inflation or deflation in soy inputs, and new product launches that shift premium mix. Where local data was thin, gaps were handled by using proxy markets with similar income levels and plant-based adoption, followed by expert rechecks so the proxy did not overstate demand.
Data Validation & Update Cycle
Validation was done through step-by-step variance checks across regions, comparing modeled volumes and implied prices against independent signals such as retail pricing ranges, trade direction, and publicly visible portfolio shifts. Any outliers were reviewed again, and when needed, we re-contacted interviewees to confirm whether the change came from mix shifts, currency movement, or one-off channel disruptions.
Before sign-off, the model and written outputs go through more than one analyst review so assumptions and calculations stay consistent. The report is refreshed annually, and interim updates are made when material events occur, such as sharp commodity price swings or a regulatory or labeling change. Right before delivery, a final pass is done so clients receive the latest updated view rather than an older snapshot.
Mordor Intelligence's Soy Milk Market Sizing Compared With Other Published Estimates
Published soy milk market values often differ because the timing of currency conversion, the way average selling prices are trended, and how quickly new price points are validated can materially shift the final number. Another common reason is boundary choices, where some studies fold soy beverages or other soy-based drinks into the same pool.
In this study, the refresh cycle keeps exchange rates and regional ASP bands aligned to the same reference period, and anomalies are rechecked against channel prices before locking totals. This is the main reason the value can diverge from older snapshots reported elsewhere, a modeling choice applied by Mordor Intelligence.
Benchmark comparison
| Source | Market Size | Gaps in Research Methodology |
|---|---|---|
| Mordor Intelligence | USD 12.28 B (2026) | |
| Trade Journal A | USD 11.71 B (2025) | Uses a different base year and appears to rely on a single baseline scenario, with less transparent handling of currency timing and near-term price resets that can shift the implied 2026 value. |
| Industry Portal B | USD 6.00 B (2025) | The figure is materially lower and likely reflects a narrower counted scope (for example, specific formats or channels), and may not fully capture regional retail penetration or premium mix that lifts value in mature markets. |
The table shows that most spread is explained by scope boundaries, year alignment, and how ASP progression is handled when inflation and mix changes happen at different speeds across regions. By keeping assumptions traceable to channel price checks and a clear demand pool, the final estimate stays easier to replicate and interpret for planning.


Key Questions Answered in the Report
What is the current size of the soy milk market?
The soy milk market is valued at USD 12.28 billion in 2026 and is forecast to climb to USD 17.07 billion by 2031.
Which region leads global consumption?
Asia-Pacific accounts for 66.88% of worldwide sales, supported by cultural familiarity and strong manufacturing infrastructure.
What segment is growing the fastest?
Powder formats are advancing at a 12.57% CAGR to 2031 as they offer cost and shelf-life advantages in emerging markets.
How are online channels influencing the market?
E-commerce subscription models are expanding at 13.34% annually, providing predictable revenue and direct consumer engagement.
Page last updated on:


 Your data is secure and never sold or shared.


