Force Sensors Market Size and Share
Market Overview
| Study Period | 2020 - 2031 |
|---|---|
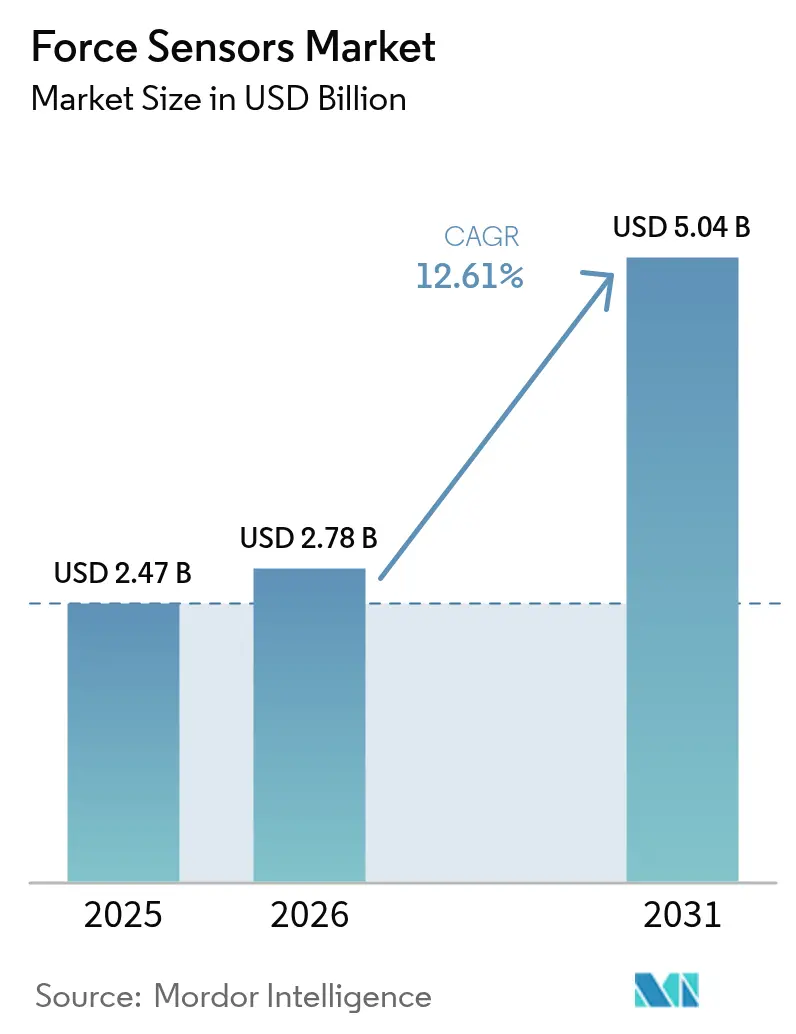
| Market Size (2026) | USD 2.78 Billion |
| Market Size (2031) | USD 5.04 Billion |
| Growth Rate (2026 - 2031) | 12.61% CAGR |
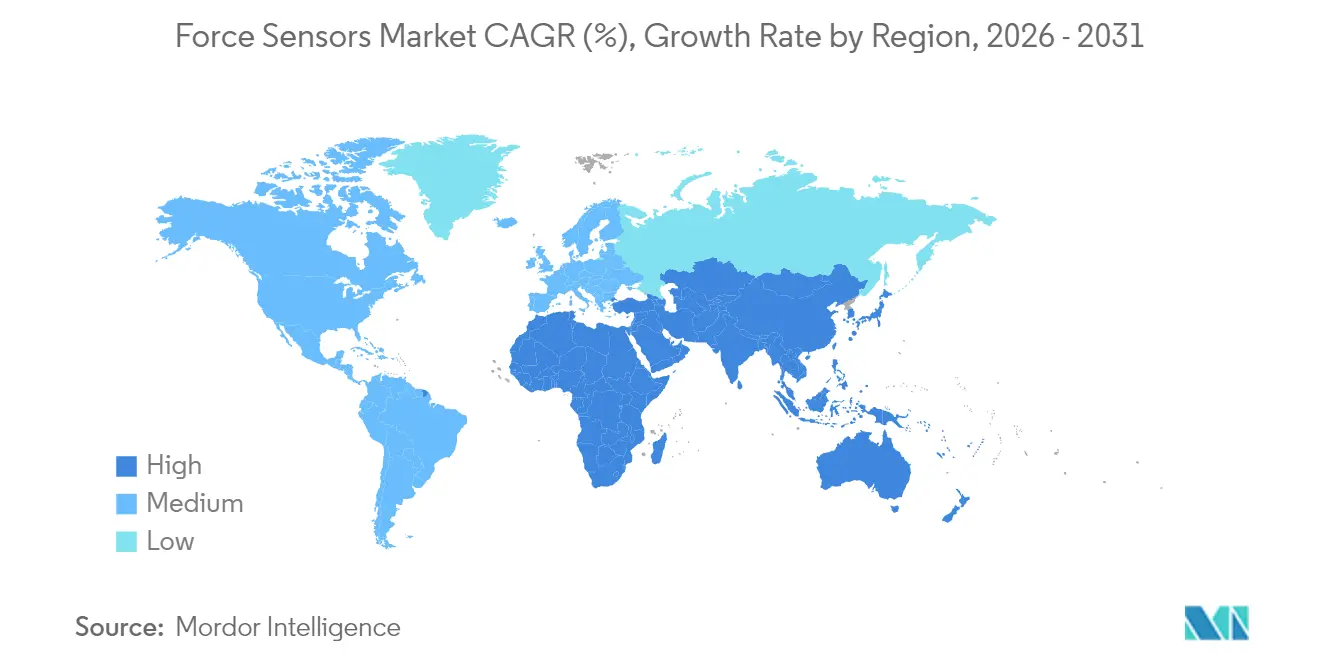
| Fastest Growing Market | Middle East |
| Largest Market | Asia Pacific |
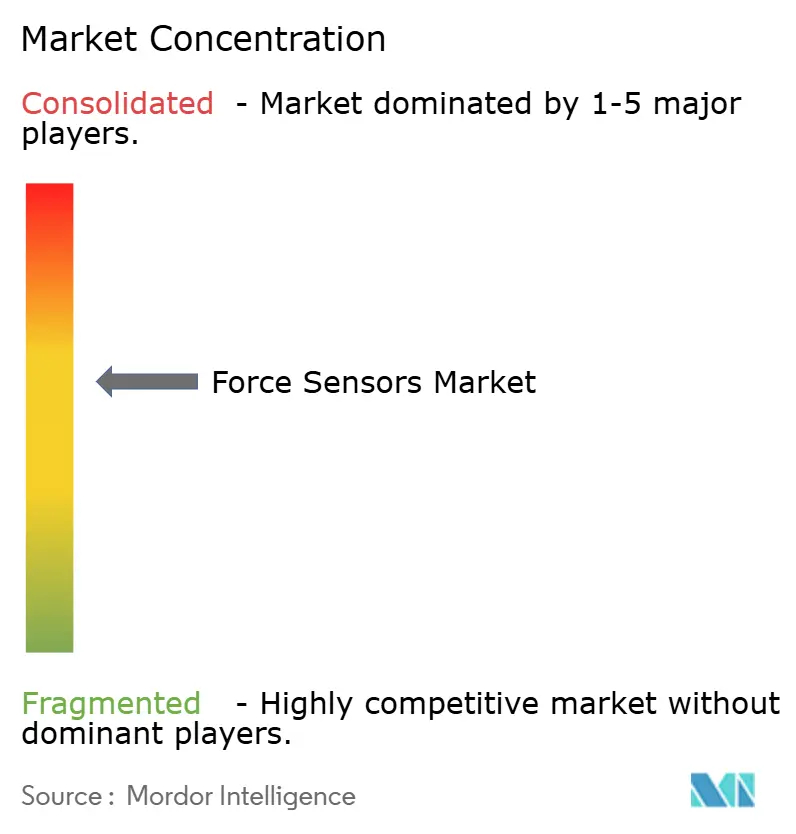
| Market Concentration | Medium |
Major Players *Disclaimer: Major Players sorted in no particular order Image © Mordor Intelligence. Reuse requires attribution under CC BY 4.0. | |
Force Sensors Market Analysis by Mordor Intelligence
The force sensors market size was valued at USD 2.47 billion in 2025 and estimated to grow from USD 2.78 billion in 2026 to reach USD 5.04 billion by 2031, at a CAGR of 12.61% during the forecast period (2026-2031). Demand is climbing as battery assembly lines require micro-newton accuracy, collaborative robots depend on real-time load feedback, and surgical systems add tactile intelligence. Automotive electrification drives volume for multi-axis sensors that interpret driver inputs, while industrial robotics upgrades shift force measurement from periodic audits to continuous monitoring. Consumer electronics makers are embedding sub-millimeter force arrays under displays and hinges, spurring miniaturization investments. Meanwhile, self-powered wireless devices are opening measurement opportunities in rotating machinery and underground mining where batteries are impractical.
Key Report Takeaways
- By type, tension-and-compression sensors held 44.78% of the force sensor market share in 2025 and are also expected to advance at a 6.62% CAGR through 2031.
- By technology, strain-gauge designs captured 39.92% of the revenue in 2025, while piezoelectric sensors represented the fastest-growing segment at a 7.71% CAGR to 2031.
- By end-user, automotive applications led with 28.55% revenue in 2025; healthcare devices are expected to exhibit the highest 8.33% CAGR from 2025 to 2031.
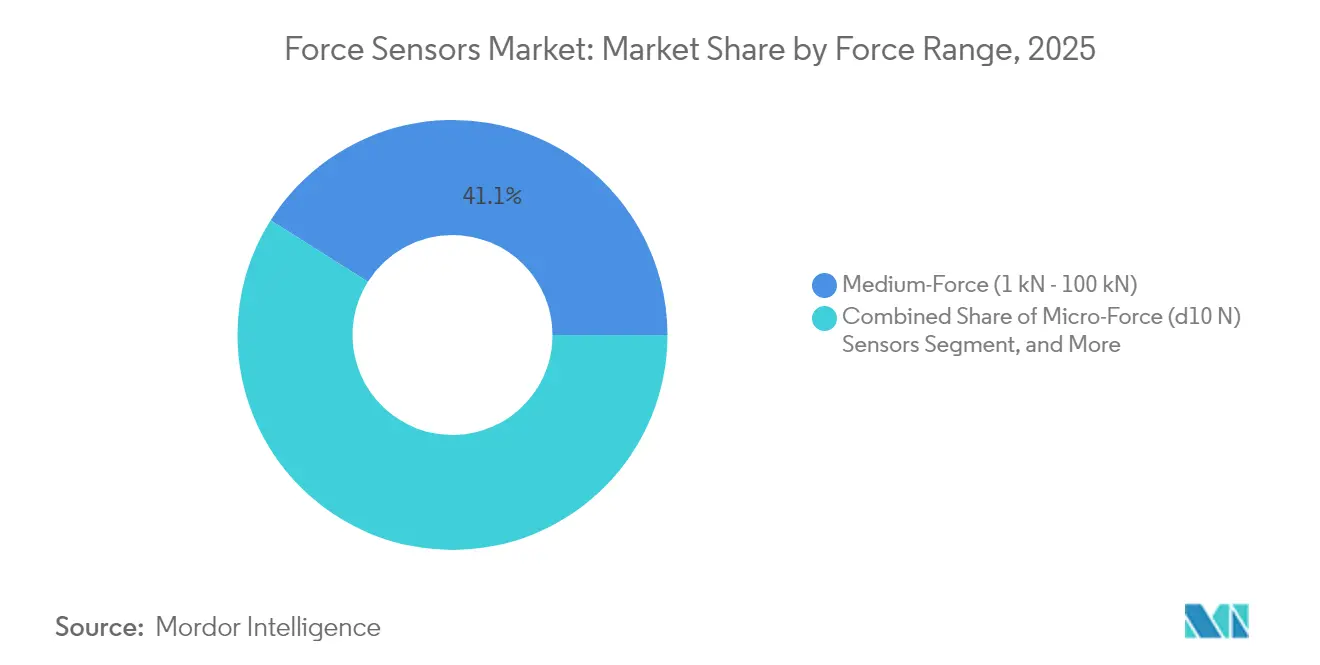
- By force range, medium-force units, which span 1 kN to 100 kN, accounted for 41.05% of the revenue in 2025; micro-force sensors, operating below 10 N, are expected to expand at a 9.02% CAGR.
- By application, process monitoring commanded a 55.40% demand share in 2025; robotics and automation deployments are expected to accelerate at a 12.98% CAGR through 2031.
- By geography, Asia Pacific dominated with 35.22% revenue in 2025, while the Middle East is the fastest riser at 7.29% CAGR.
Note: Market size and forecast figures in this report are generated using Mordor Intelligence’s proprietary estimation framework, updated with the latest available data and insights as of 2026.
Global Force Sensors Market Trends and Insights
Drivers Impact Analysis*
| Driver | (~) % Impact on CAGR Forecast | Geographic Relevance | Impact Timeline |
|---|---|---|---|
| Innovation and Development in the Consumer Electronics Sector | +2.1% | Global, with concentration in Asia Pacific (China, South Korea, Vietnam) and secondary gains in North America | Medium term (2-4 years) |
| Growing Automotive Electrification and ADAS Integration | +3.4% | Global, led by Europe and China; North America transitioning from ICE platforms | Long term (≥ 4 years) |
| Expansion of Industrial Robotics and Automation | +2.8% | Asia Pacific core (China, Japan, South Korea), spill-over to Europe and North America | Medium term (2-4 years) |
| Rising Adoption of Smart Medical Devices and Wearables | +1.7% | North America and Europe early adopters; Asia Pacific scaling in India, China | Medium term (2-4 years) |
| Emergence of High-Force Six-Axis Sensors for Humanoid Robots | +1.2% | North America (Tesla, Figure AI), China (Unitree, Xiaomi), Japan (Honda, Toyota) | Long term (≥ 4 years) |
| Development of Self-Powered Wireless Force Sensors for IIoT Edge Nodes | +1.0% | Global, with early industrial deployments in Germany, United States, Japan | Long term (≥ 4 years) |
| Source: Mordor Intelligence | |||
Innovation in Consumer Electronics
Smartphones and wearables now hide micro-force layers beneath displays and hinges, replacing mechanical buttons and enabling contextual gestures. Foldable handsets employ hinge-mounted arrays that report fold angle and structural stress to design teams, improving warranty analytics. Gaming consoles integrate piezoelectric triggers so users feel variable resistance aligned with game actions. Fitness trackers measure ground reaction forces from wrist or chest, bringing laboratory-grade gait analytics to consumer devices. These requirements are pushing suppliers to roll-to-roll print capacitive arrays under one millimeter thick, demanding investments in precision laser patterning lines.
Growing Automotive Electrification and ADAS Integration
Electric-vehicle battery lines mount force sensors at every workstation to avoid cell deformation that can shorten cycle life. Automated guided vehicles now keep tray-handling forces under 5 N to prevent micro-cracks in casings. Steering-column and brake-pedal load cells interpret driver intent, enabling smoother handoffs between humans and advanced driver-assistance systems monitored by safety agencies. High-speed crash labs record impact dynamics at 10 kHz, feeding sub-millisecond data into finite-element validation. Seat-occupancy mats distinguish child seats from cargo, optimizing airbag deployment force. Meanwhile, battery thermal plates rely on compressive monitoring to ensure uniform cooling across cell arrays.
Expansion of Industrial Robotics and Automation
Collaborative robots detect contact forces as low as 1 N, granting them the dexterity to insert connectors on circuit boards or polish curved components. A leading supplier reported that force-sensor packages climbed from 12% of cobot sales in 2023 to 18% in 2024 as clients automated delicate processes. Closed-loop grippers now adjust pressure based on compliance sensed via embedded arrays, enabling mixed-product batches without manual changeovers. Welding cells retrofit electrode-wear detection to cut scrap, while global robot installations reached 553,000 units in 2024 with force options specified in nearly one quarter of orders.[1]International Federation of Robotics, “World Robotics 2024,” ifr.org Energy harvesting within joints powers wireless sensors that eliminate failure-prone cables in rotating axes.
Development of Self-Powered Wireless Force Sensors for IIoT Edge Nodes
New devices harvest mechanical strain or thermal gradients to energize radio modules, making them viable in rotating machinery, underground mining, and remote pipelines where batteries are impractical. Designs integrate low-power microcontrollers that compress data and broadcast at intervals matched to maintenance schedules. Early pilots in German and Japanese plants cut wiring costs by 60% and reduced unplanned downtime by delivering predictive alerts from equipment once considered unreachable. Suppliers now bundle calibration services that pair the harvested-energy nodes with reference loads to maintain accuracy despite temperature swings.
Restraints Impact Analysis*
| Restraint | (~) % Impact on CAGR Forecast | Geographic Relevance | Impact Timeline |
|---|---|---|---|
| Volatility in Key Raw Material Prices | -1.8% | Global, with acute exposure in Asia Pacific (China, Japan) due to rare-earth dependencies | Short term (≤ 2 years) |
| Calibration and Long-Term Drift Challenges in Harsh Environments | -1.3% | Middle East and Africa (oil and gas), Asia Pacific (heavy manufacturing), North America (aerospace testing) | Medium term (2-4 years) |
| Intellectual Property Constraints Hindering Open-Source Sensor Modules | -0.7% | Global, with friction points in North America and Europe where patent enforcement is stringent | Medium term (2-4 years) |
| Limited Recycling Pathways for Miniaturized Multi-Material Sensors | -0.5% | Europe (WEEE Directive compliance), North America (state-level e-waste mandates), Asia Pacific (emerging regulations) | |
| Source: Mordor Intelligence | |||
Volatility in Key Raw Material Prices
Lead zirconate titanate ceramics used in piezoelectric sensors swung 18% in 2024 after export quotas on rare-earth oxides, while nickel-chromium alloy moved 14% amid Indonesian bottlenecks. Fixed-price automotive and aerospace contracts left suppliers absorbing margin shocks or forcing mid-cycle renegotiations that delayed new qualifications. Smaller producers without hedging programs were hit hardest, risking quarterly losses that jeopardized R&D funding. The EU drive toward lead-free ceramics adds uncertainty by requiring alternative materials that deliver lower piezo coefficients, forcing larger sensor footprints that clash with consumer miniaturization goals.
Calibration and Long-Term Drift Challenges in Harsh Environments
Sensors in oil extraction, forging, and jet-engine test cells are exposed to 150 °C heat, intense vibration, and corrosive atmospheres. Field data show drift beyond ISO 376’s 0.5% limit within six months, versus 24 months in labs.[2]International Organization for Standardization, “ISO 376 Standard,” iso.org Removing a sensor for recalibration can idle equipment for weeks and cost up to USD 2,000 per unit, including logistics and other associated expenses. Wireless models add RF-induced thermal effects that complicate drift correction. Research prototypes with on-sensor reference loads and machine-learning compensation show promise but need multi-year validation before broad deployment.
*Our forecasts treat driver/restraint impacts as directional, not additive. The impact forecasts reflect baseline growth, mix effects, and variable interactions.
Segment Analysis
By Type: Dual-Mode Sensors Dominate Versatile Applications
The tension-and-compression category held 44.78% revenue in 2025 and will grow at 6.62% CAGR as manufacturers retrofit hydraulic stands with digital load cells, confirming its commanding slice of the force sensors market size. Dual-mode versatility shortens maintenance training and reduces inventory, driving adoption in crash barriers, structural monitoring, and universal testing machines. Suppliers are rolling out modular platforms that swap mounting kits instead of entire elements, lowering total cost of ownership.
Calibration services now include bidirectional standards up to 500 kN, reflecting demand for single-sensor validation across tension and compression. Digital twins also raise the need for high-fidelity data under both load directions, boosting shipments of smart dual-mode units with on-board diagnostics. Inventory simplification is especially valuable for contract manufacturers with frequent product changeovers.


By Technology: Strain Gauges Lead, Piezoelectrics Gain in Dynamic Tests
Strain-gauge sensors controlled 39.92% revenue in 2025 because decades of refinement drove cost below USD 50 for low-capacity models, yielding a durable pillar of the force sensors market. Piezoelectric designs rise fastest at 7.71% CAGR thanks to 10 kHz bandwidth that captures millisecond impact events demanded by aerospace and crash labs. Capacitive arrays serve ultra-thin touch interfaces, while hybrid packages combine static preload and high-frequency data in a single device.
Makers of strain-gauge load cells are embedding EtherCAT and Wi-Fi modules to transform passive elements into smart nodes that alert users before drift exceeds limits. Piezo vendors expand cleanrooms for micro-force chips used in semiconductor handling where sub-newton resolution and contamination control are critical. Hybrid concepts target turbine-blade monitoring by merging static and dynamic sensing within one housing.
By End-User Industry: Automotive Leads, Healthcare Accelerates
Automotive lines generated 28.55% revenue in 2025, placing them atop the force sensors market, yet healthcare grows at an 8.33% CAGR as surgical robots depend on haptic feedback to protect tissue. Battery assembly, brake-by-wire, and seat-occupancy systems sustain automotive volume, while catheter-tip and endoscope tools crave micro-newton arrays.
Medical device manufacturers demand ISO 13485 compliance and biocompatible coatings, encouraging sensor companies to establish new sterile production facilities. In vehicles, load cells migrate from clutch pedals to battery and charging applications. Aerospace maintains steady high-reliability orders, while consumer electronics drive shipments of tiny capacitive units that detect pressure gestures on foldable phones.
By Force Range: Medium-Force Remains Core, Micro-Force Surges
Units rated 1 kN to 100 kN took 41.05% revenue in 2025, underscoring their central role across crash rigs and industrial presses. Micro-force devices under 10 N advance at 9.02% CAGR, making them the fastest slice of the force sensors market size for precision assembly and minimally invasive tools. Low-force models serve robotic grippers, while high-force variants beyond 100 kN support civil engineering and propulsion tests.
Miniaturization breakthroughs delivered a 5 N sensor with 0.001 N resolution and a 5 × 5 mm footprint, expanding possibilities in surgical robotics. Medium-force devices now feature digital interfaces that plug directly into Industry 4.0 PLCs, easing deployment in retrofit presses. High-capacity sensors add wireless bridges to slash cable runs across bridges and dams, where installation costs once outweighed sensor prices.
By Application: Monitoring Dominates, Robotics Accelerates
Process monitoring accounted for 55.40% demand in 2025, highlighting its status as the largest revenue generator inside the force sensors market share. Robotics and automation grow at 12.98% CAGR to 2031 as manufacturers aim for lights-out cells that detect misalignment and tool wear without humans. Test laboratories integrate environmental chambers for turnkey certification setups, and structural health monitoring gains from vibration-powered wireless nodes.
Collaborative robots now ship with multi-axis torque packages that enable tasks like surface polishing and connector insertion. Predictive analytics ingest live force signatures to find drift before defects reach customers, cutting scrap and boosting yields. Structural monitoring benefits from energy harvesting that ends battery swaps on bridges, broadening network deployments.
Geography Analysis
Asia Pacific generated 35.22% revenue in 2025, supported by China’s electronics output, Japan’s precision machinery exports, and South Korea’s battery fabrication lines. Chinese robot installations hit 276,000 units with force options on 24% of deliveries, reflecting local investment in flexible automation. Japanese suppliers repurpose automotive strain-gauge know-how to craft ultrathin arrays for foldable phones and wearable health devices. South Korean battery plants integrate micro-force arrays at every insertion step to protect lithium-ion cells. India’s production-linked incentives spur orders for press monitoring and tablet compression sensors.
The Middle East advances at 7.29% CAGR as Saudi industrial diversification and UAE aerospace hubs adopt high-capacity load cells for quality assurance. Saudi Arabia earmarked USD 6.4 billion for vehicle and defense projects that rely on structural testing sensors, while Abu Dhabi’s aerospace center needs wing-load and engine-thrust rigs. Turkey’s export plants embed load cells in brake validation to meet EU norms, and early African deployments appear in South African mines and Kenyan agriculture.
North America holds 28.85% share, anchored by aerospace, automotive, and medical device sectors that require traceability to national standards bodies. The FDA’s 510(k) regime favors suppliers with accredited labs. Europe represents 23.76%, buoyed by EV charging connectors that include misalignment detection per revised Machinery Directive requirements. Germany’s Fraunhofer Institute demonstrated self-calibrating cobot sensors that cut drift error 40% within 12 months, indicating research momentum toward maintenance-free operation. South American makers slowly integrate load cells into planters and harvesters as precision agriculture gains ground in Brazil and Argentina.

Regulatory Landscape
Force sensor suppliers selling into regulated automation and safety-critical machinery need to keep designs and documentation aligned with evolving machinery and human-robot interaction requirements. In the European Union, Regulation (EU) 2023/1230 on machinery applies from 20 January 2027 and replaces Directive 2006/42/EC. It adds explicit considerations around AI-related functions, cybersecurity, and substantial modifications that can change conformity assessment packages for sensor-integrated machines and robots.
Standards and metrology requirements also influence qualification and tender readiness. ISO/IEC 17025:2017 remains a benchmark for competent calibration and test laboratories, while ISO 376 is widely used for force-proving and calibration performance limits in industrial environments. For collaborative robots, ISO/PAS 5672:2023 provides standardized test methods for measuring force and pressure during human-robot contact, and China's GB/T 38559-2020 specifies industrial-robot force control parameters such as response periods and force control accuracy, which raises demand for traceable calibration and validated dynamic performance across regions.
Value Chain Analysis
The force sensor value chain starts with specialty materials and components such as 7075-T6 aluminum and 17-4 PH stainless steel for elastic elements, lead zirconate titanate ceramics for piezoelectric stacks, and semiconductor-grade wafers for MEMS and thin-film sensing structures. It then moves through precision machining, bonding and packaging, and electronics integration, including signal conditioning, temperature compensation, and connectivity modules. A key value-add and throughput constraint sits in calibration and verification, where traceability requirements and ISO 376 style performance checks make multi-axis and high-accuracy devices labor intensive. This elevates the role of accredited calibration labs and in-house metrology capabilities as part of the manufacturing chain, rather than a post-sale service.
Downstream, OEM direct sourcing is rising in automotive and industrial automation as buyers seek frame contracts, tighter change control, and standardized digital interfaces. This reduces the leverage of traditional distributor roles for higher-spec load cells and force-torque sensors. Integrators, robotics OEMs, and test-system builders increasingly purchase the transducer alongside mounting kits, firmware, and calibration certificates as a bundled measurement chain. Limited standardization across robot platforms still drives customization work, including mechanical interfaces, communication stacks, and safety validation, which slows scaling for six-axis and cobot-oriented offerings.
Competitive Landscape
The top five vendors captured about 38% of 2024 revenue, reflecting moderate concentration inside the force sensors market. TE Connectivity and Honeywell employ vertical integration into signal conditioning and wireless modules, allowing turnkey systems that shorten OEM design cycles. Kistler, ATI Industrial Automation, and Hottinger Brüel & Kjær compete on high-bandwidth multi-axis performance that commands premium service contracts.
Strategic moves focus on capacity expansion, temperature ruggedization, and digital connectivity. TE Connectivity bought a German strain-gauge plant in October 2024 to secure high-temperature capability for aero engines. Honeywell unveiled a 5G-enabled self-powered platform for remote oil sites, delivering data every second for a decade without batteries. Patent filings show intense work on multi-material stacks that capture both static preload and dynamic vibration, highlighted by a Vishay prototype for turbine blades.
Niche entrants such as NextInput and Sensel apply MEMS and printed-electronics techniques to furnish paper-thin arrays for consumer devices. White-space opportunities persist for energy-harvesting nodes in inaccessible assets, and suppliers with accredited ISO 376 labs preserve a qualification moat for aerospace and automotive bids.
Force Sensors Industry Leaders
TE Connectivity Ltd.
Honeywell International Inc.
Hottinger Brüel and Kjær GmbH
Futek Advanced Sensor Technology Inc.
ATI Industrial Automation Inc.
- *Disclaimer: Major Players sorted in no particular order

Market Opportunities and Future Outlook
A major opportunity is the shift from standalone transducers to intelligent force-sensing nodes that combine signal conditioning, temperature compensation, and digital interfaces such as IO-Link, EtherCAT, and CAN. This reduces commissioning time and improves traceability for process monitoring, robotics, and test systems. The transition is supported by metrology and industry roadmaps, including EURAMET's revised 2026 roadmap for force and torque, which emphasizes traceable measurement capability and performance improvements across force and torque instrumentation.
White space also remains where measurement access and maintenance costs limit deployment, especially in rotating machinery, remote assets, and harsh industrial environments where drift and recalibration burdens persist. Self-powered or vibration-powered sensing concepts, already commercialized for remote equipment in the market, can align with predictive analytics. Research progress in 2026 contact-rich manipulation and control frameworks that integrate tactile and force constraints into advanced policies also points to continued pull for higher-bandwidth, better-characterized force feedback in industrial tasks such as finishing, deburring, and precision assembly. Separately, thin-film and tactile array manufacturing is moving toward more automated assembly and in-line test methods in flexible electronics, supporting miniaturized force sensing adoption in medical devices and compact consumer form factors without relying on mechanical buttons.
Recent Industry Developments
- May 2026: Hottinger Brueel and Kjaer launched its Fusion RX road-load data acquisition platform to streamline capture and transition of road-load data into durability analysis and simulation workflows. The platform focus aligns force and load measurement with digital validation cycles used by vehicle OEMs and test houses, supporting higher sensor content in durability and performance programs.
- September 2025: Honeywell introduced its 13MM Pressure Sensor aimed at high-purity semiconductor manufacturing processes and noted compliance with SEMI F20 requirements. The release broadens Honeywell's addressable footprint in fab tool and fluid handling environments where sensor cleanliness, stability, and qualification documentation drive supplier selection.
- September 2024: TE Connectivity completed the acquisition of Sense Eletronica Ltda in Brazil, expanding its industrial automation sensor capabilities and local presence in Latin America. The deal strengthens TE's ability to supply regionally supported sensor portfolios for automation OEMs that prefer local engineering, qualification support, and shorter logistics cycles.


Research Methodology Framework and Report Scope
Market Definition and Coverage
This market covers force sensors that measure mechanical load (tension, compression, or combined force) and convert it into an electrical signal for monitoring and control in end-use equipment.
Scope exclusions: We exclude broader sensor categories that do not primarily measure mechanical force, along with unrelated accessories and services that are not part of force sensor revenue.
Segmentation Overview
- By Type
- Tension Force Sensors
- Compression Force Sensors
- Tension And Compression Force Sensors
- By Technology
- Strain Gauge Force Sensors
- Load Cell Force Sensors
- Piezoelectric Force Sensors
- Capacitive Force Sensors
- By End-User Industry
- Healthcare
- Industrial Manufacturing
- Automotive
- Aerospace And Defense
- Consumer Electronics
- Other End-User Industries
- By Force Range
- Micro-Force (≤10 N) Sensors
- Low-Force (10 N–1 kN) Sensors
- Medium-Force (1 kN–100 kN) Sensors
- High-Force (≥100 kN) Sensors
- By Application
- Process Monitoring
- Test And Measurement
- Robotics And Automation
- Structural Health Monitoring
- By Geography
- North America
- United States
- Canada
- Mexico
- South America
- Brazil
- Argentina
- Rest of South America
- Europe
- United Kingdom
- Germany
- France
- Spain
- Italy
- Rest of Europe
- Asia Pacific
- China
- India
- Japan
- Australia
- South Korea
- Rest of Asia Pacific
- Middle East and Africa
- Middle East
- Saudi Arabia
- United Arab Emirates
- Turkey
- Rest of Middle East
- Africa
- South Africa
- Kenya
- Rest of Africa
- Middle East
- North America
Data Sources, Market Sizing, and Validation
Desk Research
Desk research was used to set the market boundaries, build the demand context, and collect consistent inputs that can be checked across regions. We referenced public sources such as the U.S. Census Bureau and Eurostat trade and production tables, International Trade Administration materials, OECD macro indicators, and standards information published by groups such as ISO and IEC. For technology grounding, we also used patent databases and peer-reviewed engineering journals that discuss force measurement, load cell designs, and strain gauge and piezoelectric sensing behavior.
On the commercial side, filings and investor presentations helped us interpret product mix and end-market exposure for listed suppliers. Reputable press and association websites were used to validate adoption signals in automation, medical devices, and automotive electronics. Where needed, a paid subscription covering company financials and a separate paid news and financials feed were used to speed up fact checks and timeline validation, especially around capacity changes and product launches. The sources listed here are illustrative only, and many other public and paid references were also used for data collection, validation, and clarification.
Primary Interviews and Surveys
Primary work was used to translate the desk inputs into realistic assumptions on pricing, shipments, and adoption rates, and then to sanity-check the outputs. We spoke with force sensor value chain participants such as component suppliers, system integrators, and procurement or engineering users in industries like industrial automation, healthcare devices, and automotive.
Because this is a global market, our fieldwork was balanced across APAC, EMEA, and the Americas so regional pricing and application mix differences could be captured before finalizing the model.
Distribution of primary research fieldwork respondents
| Company type | Respondent position | Region |
|---|---|---|
| Top tier: 37% | CXOs: 16% | APAC: 52% |
| Mid tier: 46% | Functional/Unit leaders: 41% | EMEA: 30% |
| Smaller Players: 17% | Managers: 43% | Americas: 18% |
Market-Sizing & Forecasting
Sizing starts with a top-down reconstruction of the addressable demand pool by linking end-use production activity to typical sensor content, then applying penetration by application where force sensing is functionally required. Those totals are corroborated with selective bottom-up approximations, where sampled supplier revenues, channel checks, and an ASP x volume build are used to verify direction and adjust totals when mismatches appear.
Key inputs tracked in the model include industrial automation investments, robotics and motion-control shipment trends, automotive electronics intensity (including safety and control features), medical device production signals, and the mix shift between load cells, strain gauge sensors, piezoelectric sensors, and other force sensing technologies. Pricing assumptions were built around force range, accuracy class, and packaging type, then normalized across regions using consistent currency timing. When gaps appear in bottom-up views, we use conservative interpolation based on adjacent application adoption and confirmed price bands, and then re-check the impact on the total.
For forecasting, scenario analysis was used so the outlook can reflect different automation and EV adoption paths while staying tied to practical drivers that interviewees agreed were measurable. Final growth paths were kept consistent with capacity expansion signals, lead time feedback, and observed replacement cycles in key industrial and lab equipment.
Data Validation & Update Cycle
Validation is done through multiple checks that compare the modeled total with independent signals, and then push back into the assumptions if the direction does not make sense. We run variance checks by region and by major application so outliers, unrealistic ASP jumps, or sudden share shifts get flagged, followed by a second analyst review before sign-off.
The study is refreshed on an annual cycle, and interim updates are triggered when material events happen, such as sudden demand shocks, major regulatory shifts affecting safety or testing requirements, or large production expansions. Before delivery, a final pass is completed to confirm that the latest public indicators and primary feedback are reflected in the published numbers.
Mordor Intelligence's Force Sensors Market Estimate Compared With Other Published Estimates
It is normal to see different market sizes for force sensors because publishers do not always count the same products, time the currency conversion the same way, or use the same end-use mapping when they build demand. Even when the headline category looks identical, the included technologies, covered applications, and base year choice can shift the final number.
By tracking force-range specific ASP bands and then refreshing currency timing assumptions, Mordor Intelligence keeps the force sensor total limited to true force measurement devices and avoids spillover from adjacent sensor classes that are sometimes bundled into broader sensing revenue.
Benchmark comparison
| Source | Market Size | Gaps in Research Methodology |
|---|---|---|
| Mordor Intelligence | USD 2.78 B (2026) | |
| Global Consultancy A | USD 2.91 B (2024) | Uses an earlier base year and tends to bundle a wider set of force-related transducers by technology, which can lift the total when scope is not restricted by end-use application fit. |
| Industry Research Group B | USD 2.47 B (2023) | Anchors the model on an older demand cycle and applies a smoother growth path, which can understate recent mix shifts toward higher value force sensing in automation and vehicle electronics. |
Taken together, the spread is mainly explained by base-year timing and how strictly the category boundary is drawn around force measurement devices. When scope, ASP logic, and end-use mapping are made explicit and cross-checked, the result becomes easier to replicate and more usable for planning.


Key Questions Answered in the Report
What is the current value of the force sensors market?
The force sensors market size is USD 2.78 billion in 2026 and is projected to reach USD 5.04 billion by 2031.
Which segment accounts for the highest share by technology?
Strain-gauge designs controlled 39.92% of 2025 revenue, the largest share among technologies.
Which end-user segment is growing fastest?
Healthcare devices show the highest 8.33% CAGR to 2031 as surgical robots adopt haptic feedback.
Why are micro-force sensors gaining traction?
Demand for sub-10 N resolution in microelectronics and minimally invasive medical tools is driving a 9.02% CAGR for micro-force devices.
Which region dominates global demand?
Asia Pacific leads with 35.22% of 2025 revenue owing to electronics manufacturing and battery production.
What is a key restraint facing suppliers?
Volatility in piezoelectric ceramic and nickel-alloy prices cuts margins and complicates long-term contracts.
Page last updated on:


