Level Sensor Market Size and Share
Market Overview
| Study Period | 2020 - 2031 |
|---|---|
| Market Size (2026) | USD 6.48 Billion |
| Market Size (2031) | USD 8.68 Billion |
| Growth Rate (2026 - 2031) | 6.04% CAGR |
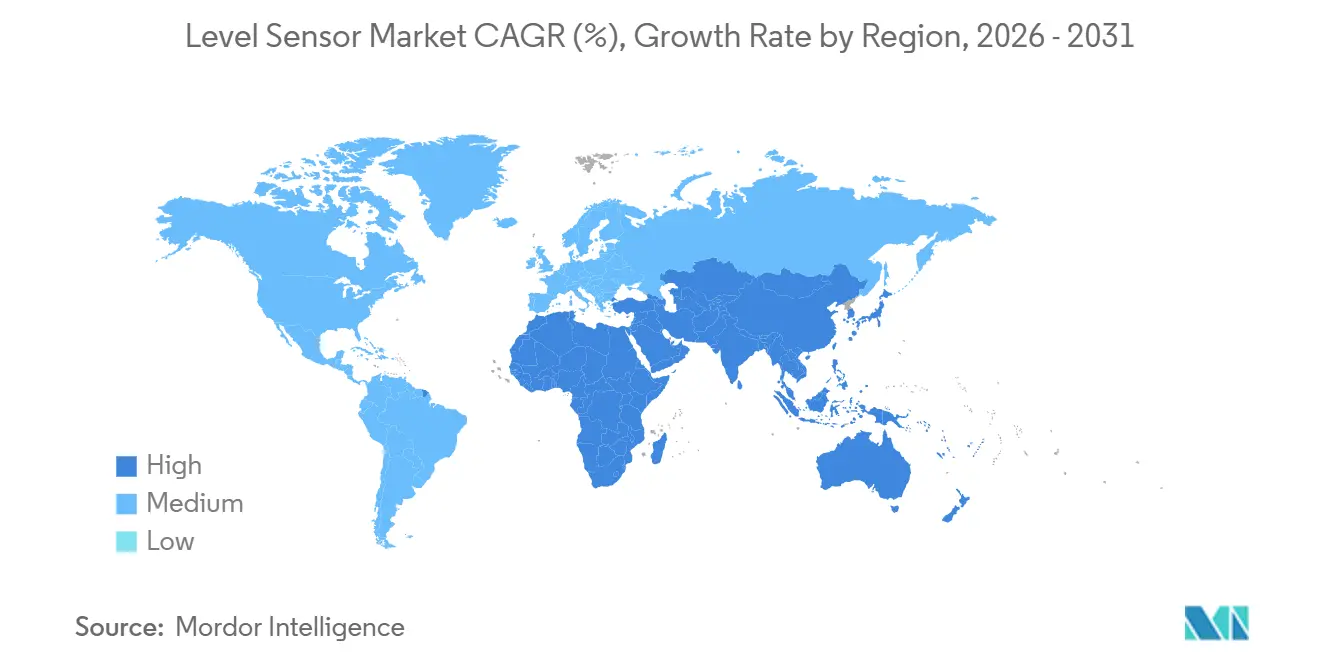
| Fastest Growing Market | Middle East |
| Largest Market | Asia Pacific |
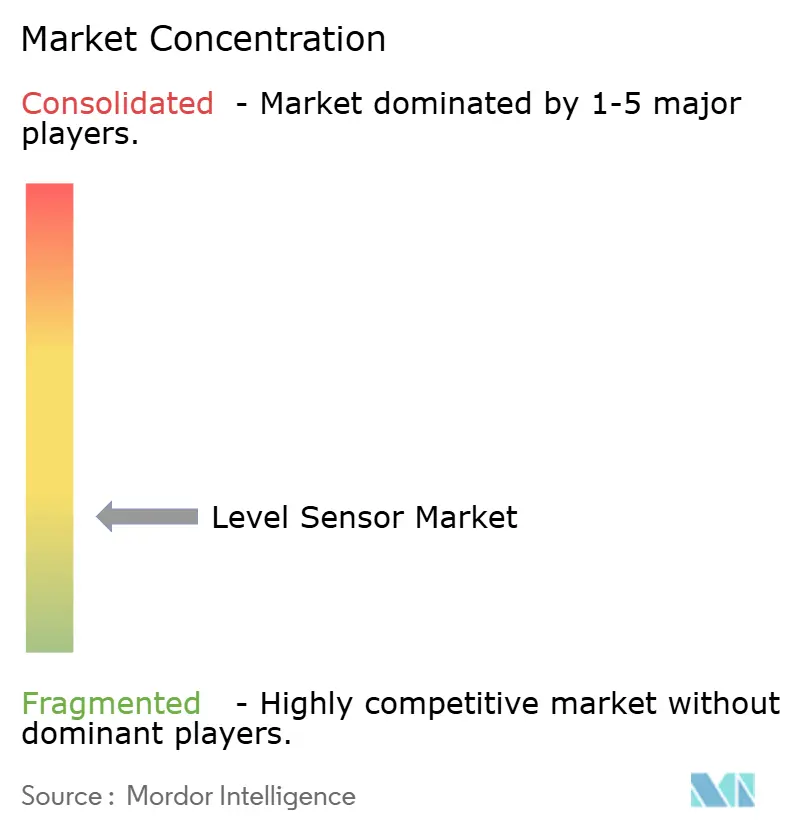
| Market Concentration | Low |
Major Players *Disclaimer: Major Players sorted in no particular order Image © Mordor Intelligence. Reuse requires attribution under CC BY 4.0. | |

Level Sensor Market Analysis by Mordor Intelligence
The level sensors market size stands at USD 6.48 billion in 2026 and is forecast to reach USD 8.68 billion by 2031, advancing at a 6.04% CAGR. Secular demand stems from tank-farm digitization programs, stricter custody-transfer rules that tighten measurement uncertainty to ±0.5 millimeters, and desalination megaprojects that specify corrosion-resistant transmitters. Radar and ultrasonic platforms displace mechanical floats because they operate without process seals, embed self-diagnostics, and integrate wireless protocols that cut installation labor. Competitive advantage accrues to vendors with 80 gigahertz intellectual property, gallium-arsenide wafer supply agreements, and Safety Integrity Level 3 certificates, allowing premium pricing in hazardous and custody-transfer duties. Meanwhile, electromagnetic interference in steel mills and a shortage of 8-inch gallium-arsenide capacity temper near-term uptake of high-frequency radar.
Key Report Takeaways
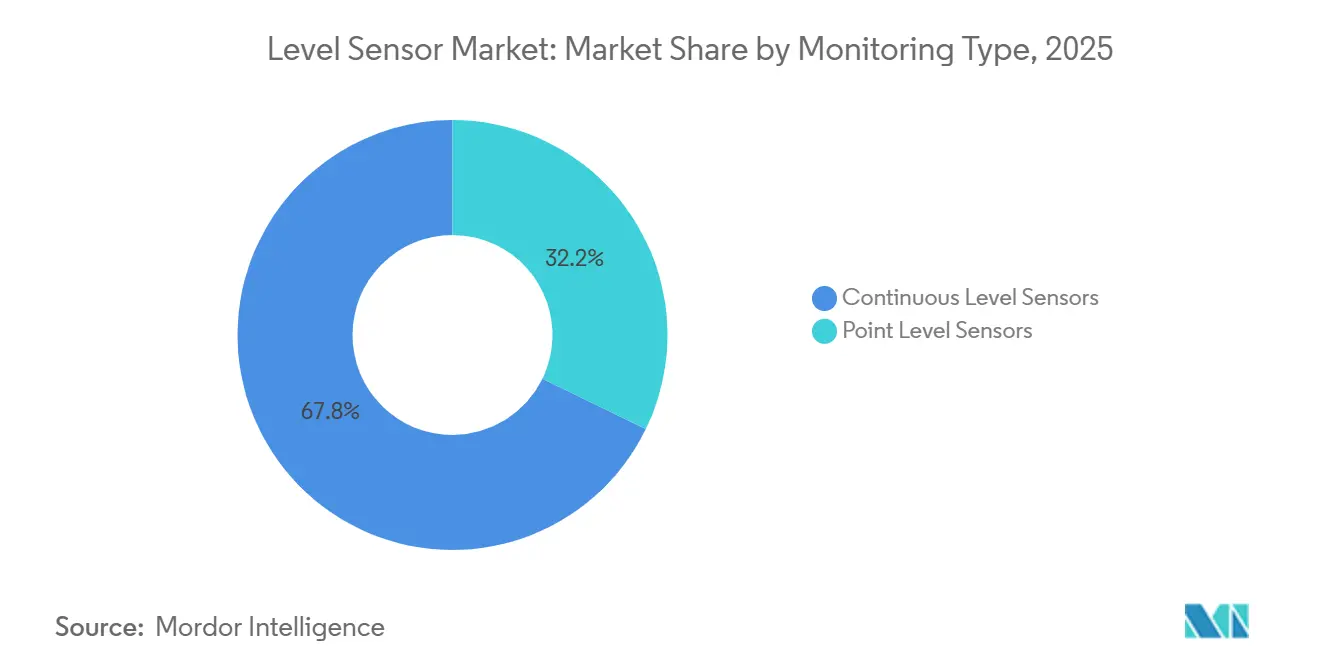
- By monitoring type, continuous level sensors held 67.80% revenue share in 2025; point-level counterparts will trail as continuous devices climb at an 8.50% CAGR through 2031.
- By technology, non-contact variants captured 62.10% of 2025 deployments, while the contact segment lags despite a 9.32% CAGR forecast for non-contact through 2031.
- By sensor technology, microwave and radar solutions commanded 35.40% of the installed base in 2025 and are set to expand at a 9.50% CAGR through 2031.
- By component, sensing elements and probes represented 51.40% of 2025 value, whereas transmitter and converter modules post the fastest 8.80% CAGR to 2031.
- By geography, Asia-Pacific delivered 38.50% of 2025 revenue; the Middle East is projected to be the fastest region, advancing at a 10.40% CAGR through 2031.
Note: Market size and forecast figures in this report are generated using Mordor Intelligence’s proprietary estimation framework, updated with the latest available data and insights as of January 2026.
Global Level Sensor Market Trends and Insights
Drivers Impact Analysis*
| Driver | (~) % Impact on CAGR Forecast | Geographic Relevance | Impact Timeline |
|---|---|---|---|
| Transition to 80 GHz FMCW Radar in North American Custody-Transfer Systems | +1.8% | North America, with spillover to Europe and the Middle East | Medium term (2-4 years) |
| Digitization-Driven Tank-Farm Automation Surge in Gulf Cooperation Council | +1.5% | Middle East (Saudi Arabia, UAE, Qatar, Kuwait), with technology transfer to Africa | Medium term (2-4 years) |
| Rapid Build-Out of Desalination and Waste-Water Megaprojects Across Asia-Pacific | +1.3% | Asia-Pacific core (India, Taiwan, Singapore, Philippines), spillover to Middle East and Africa | Long term (≥ 4 years) |
| Mandatory SIL-3 Safety Audits in European Chemical Parks Boosting Radar Installations | +1.1% | Europe (Germany, Netherlands, Belgium, France), with regulatory harmonization in Asia-Pacific | Short term (≤ 2 years) |
| Battery-Electric Vehicle Electrolyte Production Capacity Investments in China | +0.9% | China, with supply-chain linkages to South Korea and Japan | Medium term (2-4 years) |
| LNG Floating Storage and Regasification Unit Orders Accelerating Point-Level Demand | +0.7% | Global, with early concentration in Qatar, Bangladesh, India, Philippines | Long term (≥ 4 years) |
| Source: Mordor Intelligence | |||
Transition to 80 GHz FMCW Radar in North American Custody-Transfer Systems
Pipeline operators and refiners in the United States and Canada are migrating from legacy 24 gigahertz sensors to 80 gigahertz frequency-modulated continuous-wave units to meet the American Petroleum Institute’s tighter manual of petroleum measurement standards. The higher frequency narrows the beam angle, minimizing false echoes in tall, slender tanks while achieving ±0.5 millimeter accuracy. Contract clauses now explicitly require 80-gigahertz devices for crude-oil terminals, liquefied petroleum gas caverns, and liquefied natural gas export berths. Vendors embed WirelessHART and IO-Link to eliminate signal cabling and enable predictive diagnostics that flag antenna fouling before accuracy drifts. Roughly 12,000 tanks on the Gulf Coast and in Western Canada are slated for retrofit by 2029, creating a durable replacement revenue stream.
Digitization-Driven Tank-Farm Automation Surge in Gulf Cooperation Council
Saudi Aramco, ADNOC, and Kuwait Petroleum Corporation are automating more than 10,000 storage tanks, installing radar and guided-wave transmitters with redundant architectures that satisfy IEC 61511 risk-reduction factors [1]Source: Saudi Aramco, “Digital Transformation and Automation Initiatives,” Aramco.com. The removal of manual gauging trims product-loss claims and enables recipe-based blending that lifts refinery margin per barrel. Projects specify Safety Integrity Level 2 certification for hydrocarbon service and SIL 3 for hydrogen-sulfide environments, pushing demand toward vendors with full certificate portfolios. The GCC’s preference for unmanned sites further accelerates the adoption of cloud-based inventory dashboards.
Rapid Build-Out of Desalination and Waste-Water Megaprojects Across Asia-Pacific
Indian, Taiwanese, and Singaporean utilities are commissioning high-capacity desalination and wastewater plants that require thousands of corrosion-resistant level transmitters. Chennai’s 400 million liters per day plant runs 1,200 radar and ultrasonic sensors across its intake and brine systems. Taiwan’s Hsinchu Science Park deploys non-contact radar in chemical dosing tanks to avoid sensor fouling in high-solids streams. Operators favor materials such as PVDF and Hastelloy and insist on HART or Profibus connectivity for integration with distributed control systems, creating a specialized subsegment inside the broader level sensors market.
Mandatory SIL-3 Safety Audits in European Chemical Parks Boosting Radar Installations
Amendments to Germany’s Federal Immission Control Act compel Seveso III upper-tier sites to certify all level instruments to Safety Integrity Level 3[2]Source: German Federal Ministry for the Environment, “Federal Immission Control Act Amendments 2024,” Bmuv.de . BASF, Covestro, and Evonik have started retrofits that pair primary radar transmitters with independent ultrasonic devices to meet probability-of-failure-on-demand targets below 10^-8 per hour. Belgium and the Netherlands enforce similar rules on ammonia and chlorine storage, further enlarging the addressable base. Radar dominates these retrofits because non-contact operation eliminates process-seal failures and because a wide variety of SIL-certified devices prevents single-vendor lock-in.
Restraints Impact Analysis*
| Restraint | (~) % Impact on CAGR Forecast | Geographic Relevance | Impact Timeline |
|---|---|---|---|
| Shortage of 8-Inch GaAs MMIC Foundry Capacity for 80 GHz Front-Ends | -0.9% | Global, with acute constraints in North America and Europe | Medium term (2-4 years) |
| EMI-Induced Accuracy Drift in Steel Mills Limiting Adoption in India | -0.7% | India, with similar challenges in South Korea and Turkey | Short term (≤ 2 years) |
| Low Acceptance of Guided-Wave Radar in Hygienic Pharma Lines (US and EU GMP) | -0.5% | North America and Europe, with spillover to regulated markets in Asia-Pacific | Medium term (2-4 years) |
| Complex SIL Certification Cost for Small OEMs in South America | -0.3% | South America (Brazil, Argentina, Chile), with limited impact in other regions | Long term (≥ 4 years) |
| Source: Mordor Intelligence | |||
Shortage of 8-Inch GaAs MMIC Foundry Capacity for 80 GHz Front-Ends
Fewer than 10 foundries worldwide can process 8-inch gallium-arsenide wafers, and three of them account for over 70% of the volume. Automotive radar, 5G, and satellite contracts crowd out industrial demand, stretching lead times to 52 weeks. Yield for 80 gigahertz front-ends hovers near 60% because defect densities rise as electron mobility targets climb above 8,000 cm^2 V-s. Mid-tier sensor vendors have postponed launches or reverted to 24-gigahertz platforms, sacrificing the accuracy that custody-transfer clients demand. New capacity from IQE and AWSC arrives only in late 2027, keeping transmitter prices elevated and squeezing margins on water-treatment and food-processing bids.
EMI-Induced Accuracy Drift in Steel Mills Limiting Adoption in India
Electric arc furnaces emit broadband electromagnetic interference from 100 kilohertz to 2 gigahertz during melt cycles. Field trials at JSW Steel and Tata Steel show ±50 millimeter errors on radar units positioned within 20 meters of the furnaces, forcing operators back to mechanical floats. Shielding solutions cost about USD 8,000 per sensor and are seldom budgeted in Indian projects. Vendors experiment with frequency hopping and migrating to 80 gigahertz, which sits outside the interference spectrum, but gallium arsenide shortages inflate component costs. Until prices normalize, radar penetration in Indian steel mills will remain near 15% of addressable points, preserving demand for ultrasonic and magnetostrictive alternatives.
*Our forecasts treat driver/restraint impacts as directional, not additive. The impact forecasts reflect baseline growth, mix effects, and variable interactions.
Segment Analysis
By Monitoring Type: Continuous Sensors Extend Lead
Continuous devices captured a 67.80% revenue share in 2025 and will keep expanding at an 8.50% CAGR as refineries, chemical parks, and battery-electrolyte lines pursue inventory transparency. Radar, ultrasonic, and magnetostrictive solutions reduce unplanned shutdowns by roughly 20% because they detect foam blankets, agitator swirl, and stratified interfaces in real time. Digital protocols such as HART, Profibus, and Foundation Fieldbus embed calibration and diagnostic data within the transmitter, cutting commissioning hours and enabling remote proof tests. In contrast, point-level devices rely on binary logic for pump interlock, overfill protection, and low-level alarms, so their revenue growth trails but remains resilient in small tanks and day vessels. Mechanical floats linger in legacy installations and regions with limited instrumentation expertise, yet their footprint erodes each year as safety audits force upgrades. The level sensors market benefits from predictive-maintenance mandates in high-value process plants, nudging even conservative operators toward continuous architectures.
Point-level sensors will keep a valuable niche in solids handling, overfill alarms, and low-cost water tanks. Vibratory forks offer a fail-safe design because frequency drops signal both dry and fault conditions. Conductivity probes retain traction in acid and brine service, but dielectric dependence limits usage in hydrocarbon streams. Long-span cable floats survive in developing regions, particularly for open reservoirs where radar budgets remain prohibitive. Overall, as Industrial Internet of Things initiatives spread, continuous monitoring aligns with asset-management dashboards and vendor-hosted cloud analytics, reinforcing the shift inside the level sensors market.


By Technology: Non-Contact Platforms Accelerate Adoption
Non-contact technologies accounted for 62.10% of 2025 deployments and are headed for a 9.32% CAGR. Ultrasonic units dominate water and wastewater applications up to 15 meters, while 80 gigahertz radar leads in custody transfer thanks to a beam angle narrower than 3 degrees and independence from dielectric constant variation. Optical infrared sensors cover hygienic and transparent-liquid duties in pharmaceuticals where contact probes complicate cleaning validation under 21 CFR Part 11. The contact segment retains relevance in high-pressure reactors above 100 bar and cryogenic hydrocarbons below -160 °C, where magnetostrictive and guided-wave radar demonstrate sub-millimeter resolution. Hydrostatic transmitters persist for sealed-tank applications, leveraging differential-pressure measurement that remains immune to foam and vapor composition.
Guided-wave radar struggles with hygienic regulations because probes create dead-leg zones susceptible to biofilm, yet the technology excels in liquefied natural gas tanks where high dielectric and stratified layers complicate non-contact sensing. Contact and non-contact approaches therefore coexist, but the value narrative leans toward non-contact as costs fall and wireless protocols proliferate. This split underlines the dual-thrust growth opportunities inside the level sensors market.
By Sensor Technology: Radar Captures Harsh-Duty Wallet Share
Microwave and radar instruments owned 35.40% of the installed base in 2025 and will expand at a 9.50% CAGR. Frequency-modulated continuous-wave radar tolerates dust, vapor, and foam, making it the default in cement silos, polymer reactors, and grain elevators. Upgraded chipsets allow 120 gigahertz prototypes with sub-millimeter accuracy that rivals guided-wave radar without contact. Ultrasonic sensors, with roughly 28% deployment share, remain cost-effective for open basins but suffer in vacuum, high-temperature, or dense-vapor conditions. Capacitive probes thrive in solids and slurry interfaces because dielectric change cues level, while conductive switches offer the cheapest install for conductive liquids but require frequent electrode cleaning.
Vibratory forks endure in pump dry-run protection due to mechanical simplicity. Optical sensors, although less than 5% of demand, excel in transparent liquids where radar reflections are weak. The sensor-technology hierarchy shows radar staking claim to high-margin niches, ultrasonic covering budget projects, and capacitance and vibratory occupying specialty corners. This mix diversifies revenue streams inside the level sensors market and cushions suppliers against single-technology disruption.


By Component: Electronics Outpace Raw-Material Content
Sensing elements and probes represented 51.40% of 2025 component revenue, buoyed by Hastelloy, tantalum, and sapphire parts that withstand hydrofluoric acid, bromine, and abrasive slurries. Transmitter and converter modules, however, will log an 8.80% CAGR through 2031 as vendors integrate Bluetooth Low Energy, WirelessHART, and edge computing. Smartphone-based commissioning trims labor by 30% and cloud analytics cut emergency maintenance visits by 25%. Displays and local controllers shrink in share because centralized control rooms and web dashboards render panel indicators redundant, yet hazardous-area rules still require local readouts, sustaining a base load.
Cybersecurity enhancements such as secure boot and encrypted firmware updates become standard, responding to alerts from the United States Cybersecurity and Infrastructure Security Agency. The component split illustrates how software and services now command a growing portion of value, confirming the digital pivot within the level sensors market.
Geography Analysis
Asia-Pacific generated 38.50% of global revenue in 2025 and maintains the largest installed base. China alone added 180 gigawatt-hours of lithium-ion cell capacity during 2024-2025, each gigafactory outfitted with radar and magnetostrictive sensors for lithium hexafluorophosphate and ethylene carbonate tanks. India’s desalination build-out requires more than 4,000 radar and ultrasonic units per project, and Southeast Asia’s liquefied natural gas import terminals select guided-wave radar for cryogenic ethane storage. Japan and South Korea execute steady replacement cycles to secure IEC 61508 compliance in petrochemical parks, while Australia’s copper, nickel, and lithium mines install heavy-duty radar in tailings dams.
The Middle East is poised for the fastest 10.40% CAGR through 2031. Saudi Aramco’s Ras Tanura, Jubail, and Yanbu automation projects eliminate manual gauging and integrate radar transmitters into cloud dashboards that cut product-loss claims by 15%. Qatar’s North Field liquefied natural gas expansion specifies guided-wave radar for propane spheres at -160 °C. Unmanned terminal strategies, IEC 61511 adoption, and national hydrogen roadmaps create premium demand that favors brands with SIL certificates.
North America and Europe together account for just under half of 2025 revenue. Updated American Petroleum Institute rules trigger an 80 gigahertz replacement wave from the Gulf Coast to Alberta oil sands. Europe’s SIL-3 mandates drive twin-radar architectures even as overall industrial output plateaus. South America lags because local original equipment manufacturers bear high certification costs and minimal access to 8-inch gallium-arsenide foundries, limiting the pace of 80 gigahertz migration.

Regulatory Landscape
Level instruments used in hazardous and safety-critical duties are shaped by functional-safety and explosion-protection regimes. In Europe, Seveso III upper-tier chemical parks have moved toward tighter Safety Integrity Level requirements, and the 6th Edition of the European Commission guidelines for ATEX Directive 2014/34/EU was issued in January 2026, reinforcing how manufacturers prepare technical files, markings, and conformity assessments for Ex-rated level transmitters.
Standards updates also affect product design and market access. IEC 60079-0:2026 (Edition 8.0) was published in June 2026, setting general requirements for equipment used in explosive atmospheres under IECEx and ATEX-aligned pathways. CENELEC also released EN IEC 60730-2-15:2026 for automatic electrical water level sensing controls used in systems such as boilers and HVAC. For custody-transfer and tank gauging applications, supplier requirements linked to API measurement rules and ISO tank measurement methods continue to tighten uncertainty targets and documentation for verification routines, increasing the weight of SIL certificates and metrological diagnostics in tender specifications.
Value Chain Analysis
The level sensor value chain begins with specialized materials and electronics, including corrosion-resistant wetted parts (for example, PVDF and Hastelloy in desalination and chemical dosing) and high-frequency RF front-ends for 80 GHz radar. A key upstream constraint is 8-inch gallium-arsenide MMIC capacity, where a small group of foundries supplies most volume. As a result, lead times stretch, and some mid-tier vendors delay 80 GHz launches or revert to 24 GHz designs.
Downstream, vendors differentiate through firmware, diagnostics, and functional-safety documentation. SIL 2/SIL 3 certification and hazardous-location approvals can extend customer qualification cycles, especially in regulated chemical, oil and gas, and hygienic process environments. Manufacturing and assembly are concentrated among large multinational suppliers with certified product portfolios, while distribution combines direct sales to major accounts (refineries, chemical parks, utilities, and large EPC-led projects) with regional automation and electrical channels. Digital communications (HART, Profibus, Foundation Fieldbus, IO-Link, and WirelessHART) also widen participation to DCS/PLC suppliers, wireless gateway providers, and service partners that execute installation, proof testing, and periodic verification. For radar-based level probing equipment, compliance with radio and emission rules, plus the need for rapid local support in tank-farm and water projects, further reinforces the role of regional application engineering and after-sales service in order conversion.
Competitive Landscape
The top five suppliers controlled roughly 45% of global revenue in 2025, giving the level sensors market a mid-level concentration. Brands that hold radar patents and SIL-3 certificates command 15-20% price premiums in custody-transfer and hazardous-area duties, while capacitive and vibratory sensors face pricing pressure from low-cost Asian entrants. Strategy now tilts toward software differentiation: cloud dashboards, digital twins, and condition-based maintenance subscriptions anchor customers and expose recurring revenue streams. Radar producers with gallium-arsenide wafer contracts insulate themselves from foundry shortages, while smaller firms postpone 80 gigahertz launches or pay spot premiums that erode margins.
Mergers continue. Emerson acquired Mettler-Toledo’s level division for USD 320 million in December 2025, boosting its hygienic-line portfolio. ABB locked a multi-year wafer deal with WIN Semiconductors to cover 30,000 radar units annually, while Siemens invested EUR 45 million (USD 48 million) in German radar production lines. Disruptors repurpose automotive 77 gigahertz chipsets and undercut incumbents by 20%, yet lack SIL certificates that high-value clients demand. Patent filings climbed in 2025 for frequency-hopping algorithms, sidelobe suppression antennas, and machine-learning echo filters, signaling ongoing technology races[3]Source: United States Patent and Trademark Office, “Patent Database for Radar Level Measurement,” Uspto.gov.
White-space opportunities sit in battery-electrolyte facilities and floating storage and regasification units. Both applications value sub-millimeter accuracy and exposure resistance. Vendors able to pair radar hardware with contamination-proof wetted materials gain early traction. Meanwhile, electromagnetic interference in steel mills and hygienic cleaning challenges in pharmaceuticals preserve niches for ultrasonic and magnetostrictive competitors, preventing absolute dominance by any single technology within the level sensors market.
Level Sensor Industry Leaders
Emerson Electric Co.
Endress + Hauser AG
Siemens AG
VEGA Grieshaber KG
ABB Ltd
- *Disclaimer: Major Players sorted in no particular order

Market Opportunities and Future Outlook
Wireless, battery-powered radar level measurement is creating incremental retrofit and greenfield opportunities where cabling is costly or sites operate as unmanned assets, aligning with tank-farm digitization programs and remote inventory visibility needs. In March 2026, Emerson introduced the Rosemount 3408 Wireless Level Transmitter using 80 GHz FMCW radar and WirelessHART, showing how non-contact level measurement is packaged for faster deployment in chemical and other process environments without new signal wiring. This approach fits the broader shift toward transmitter modules with embedded diagnostics, and it supports overfill protection, corrosion-prone tanks, and difficult-to-access vessels where shutdown windows are constrained.
A second opportunity is concentrated in verification and compliance-led upgrades, as plants look for instruments that simplify proof testing and reduce manual calibration burden while keeping auditable performance. Endress+Hauser is pushing self-verifying 80 GHz radar instrumentation with integrated diagnostics, which helps operators extend or better target physical calibration cycles in regulated settings and in custody-transfer style applications that require tight uncertainty. Supply-side whitespace also remains for vendors that can secure high-frequency semiconductor supply and deliver SIL-certified portfolios for European chemical park retrofits and for GCC tank-farm automation programs, where specifications call out redundant architectures and higher safety integrity requirements.
Recent Industry Developments
- May 2026: Emerson launched the Rosemount 3408 Wireless Level Transmitter using 80 GHz FMCW radar with WirelessHART communications for non-contact level measurement. The release targets faster deployment in hard-to-wire and remote assets, supporting tank-farm digitization programs that prioritize reduced installation labor and continuous diagnostics.
- December 2025: Emerson closed its USD 320 million acquisition of Mettler-Toledo’s level sensor division. The deal broadened Emerson’s portfolio across guided-wave radar and magnetostrictive offerings, strengthening its ability to bid on regulated and hazardous-duty applications that require certified instrument lineups.
- March 2024: Emerson released the Rosemount 3490 Level and Flow Controller for water and wastewater applications. The controller-focused launch supports packaged measurement-and-control deployments at utilities, where level measurement is commonly integrated with pumping and basin operations.


Research Methodology Framework and Report Scope
Market Definition and Coverage
For this methodology, the market covers revenues earned from discrete level sensor devices that detect and measure the level of liquids, slurries, and bulk solids in tanks, silos, pipelines, and similar containers, using contact or non-contact sensing.
Scope exclusions: Embedded level-sensing modules built into broader IoT boards or finished end products are excluded from the market totals.
Segmentation Overview
- By Monitoring Type
- Point Level Sensors
- Mechanical and Magnetic Float
- Capacitance
- Vibratory Probe
- Conductivity
- Other Point Level Sensors
- Continuous Level Sensors
- Laser
- Ultrasonic
- Magnetostrictive
- Radar
- Other Continuous Level Sensors
- Mechanical and Magnetic Float
- By Technology
- Contact Sensors
- Hydrostatic
- Magnetostrictive
- Guided-Wave Radar
- Non-Contact Sensors
- Ultrasonic
- 24 GHz Radar
- 80 GHz Radar
- Optical / IR
- Contact Sensors
- By Sensor Technology
- Capacitive
- Conductive
- Optical / Photoelectric
- Microwave / Radar
- Ultrasonic
- Vibratory Fork
- By Component
- Sensing Element and Probe
- Transmitter / Converter
- Display and Controller
- Point Level Sensors
- By Geography
- North America
- United States
- Canada
- Mexico
- Europe
- Germany
- United Kingdom
- France
- Italy
- Spain
- Russia
- Rest of Europe
- Asia-Pacific
- China
- Japan
- India
- South Korea
- Australia
- Rest of Asia-Pacific
- Middle East
- Saudi Arabia
- United Arab Emirates
- Turkey
- Rest of Middle East
- Africa
- South Africa
- Nigeria
- Rest of Africa
- South America
- Brazil
- Argentina
- Rest of South America
- North America
Data Sources, Market Sizing, and Validation
Desk Research
Desk research was used to set the fact base and keep assumptions realistic across end users where level measurement is a recurring need. We referred to public sources such as the US Census Bureau manufacturing statistics, Bureau of Labor Statistics producer price data, International Energy Agency activity indicators, and water and wastewater datasets published by agencies such as the US EPA, followed by safety and instrumentation guidance from standards bodies such as ISA and IEC.
To convert these signals into workable market inputs, additional secondary material was reviewed, including annual reports, investor presentations, product catalogs, and press releases that describe typical use cases, product positioning, and pricing bands. Where it helped to validate company presence and revenue mix, paid subscriptions for company financials and news intelligence, patent databases, and an import/export shipment-level database were used selectively. The sources listed above are illustrative, and many other public and paid references were also consulted to collect data, validate assumptions, and clarify open questions.
Primary Interviews and Surveys
Primary work focused on interviews and short surveys with manufacturers, channel partners, system integrators, and end users across process industries and discrete manufacturing, so the sizing reflects real purchase behavior. We used these discussions to confirm adoption shifts between point and continuous sensing, typical replacement cycles, and how price levels move by technology and by hazardous or corrosive environments, and then the findings were used to cross-check desk assumptions across APAC, EMEA, and the Americas.
Distribution of primary research fieldwork respondents
| Company type | Respondent position | Region |
|---|---|---|
| Top tier: 34% | CXOs: 14% | APAC: 42% |
| Mid tier: 45% | Functional/Unit leaders: 36% | EMEA: 36% |
| Smaller Players: 21% | Managers: 50% | Americas: 22% |
Market-Sizing & Forecasting
Sizing starts with a top-down build where industrial activity and asset additions are translated into a demand pool for level measurement (for example, new tank and silo installations, brownfield retrofits, and regulated measurement points in water and process plants). Those demand signals are then converted into value using technology mix and pricing, and the totals are checked against selective bottom-up approximations like sampled ASP times estimated unit volumes and channel checks, which helps us adjust when a region looks over or under stated adoption.
Inputs used in the model include the split between point and continuous measurement, the share of non-contact methods (radar and ultrasonic) versus contact methods, typical replacement and calibration cycles, the portion of hazardous-area installations that drive higher specification transmitters, and region-level industrial capex and water infrastructure spending. Forecasts are produced using scenario analysis, where core drivers like industrial output, energy and chemicals project pipelines, and municipal water investment are stressed in a few credible cases, and then aligned to what interviewees expect for technology substitution and pricing movement. When bottom-up checks have gaps, the missing parts are bridged using proxy adoption rates from similar end users and then re-tested through follow-up validation calls.
Data Validation & Update Cycle
Validation is done by triangulating outputs against independent signals that should move in the same direction, such as industrial production trends, capital project cadence in major process industries, and stated pricing movements for instrumentation categories. Outliers are flagged early, and assumptions are rechecked at the variable level, followed by a second analyst review before the numbers are finalized. The report is refreshed annually, and interim updates are triggered when material events occur, such as major regulatory changes, sharp currency moves, or step-changes in input costs that can impact ASPs. Before delivery, a final pass is completed so clients receive the latest updated view and consistent logic across the time series.
Mordor Intelligence's Level Sensor Market Sizing Compared With Other Published Estimates
Published market sizes for level sensors can look far apart because each publisher makes different calls on what to count and when to count it, and then those choices stack up over time. The biggest differences usually come from product scope, whether pricing is tracked at factory gate or later in the channel, and how the base year is normalized across regions.
The main gap comes from whether embedded sensing within broader electronics is treated as part of level sensors and whether channel markups are included, and Mordor Intelligence counts only discrete level sensor devices priced at standard ASP from factory gate to the first distribution step while leaving out embedded modules inside multifunction boards or finished products.
Benchmark comparison
| Source | Market Size | Gaps in Research Methodology |
|---|---|---|
| Mordor Intelligence | USD 6.48 B (2026) | |
| Global Industry Publisher A | USD 9.27 B (2026) | Uses a wider inclusion set that appears to bundle more downstream value and adjacent sensing content, and it does not clearly state factory-gate versus end-user pricing treatment, which can lift the total for the same year. |
| Market Tracker B | USD 3.23 B (2024) | Anchors the series on a smaller base year value and emphasizes sales reporting that can miss higher-spec industrial transmitters and parts of the channel, and the scope language is broad enough that mix and pricing assumptions may not be normalized across regions. |
The table shows that most of the spread is explained by scope and pricing handoffs, rather than a disagreement that demand exists. By keeping the counted device set consistent and then checking adoption and pricing through interviews, the estimate stays traceable to clear demand drivers and repeatable steps.


Key Questions Answered in the Report
How large is the global level sensors market in 2026?
The market stands at USD 6.48 billion in 2026 and is projected to climb to USD 8.68 billion by 2031.
Which monitoring type generates the most revenue?
Continuous sensors lead with 67.80% of 2025 revenue and are expanding at an 8.50% CAGR.
Why is 80 gigahertz radar gaining favor?
It meets ±0.5 millimeter accuracy mandates for custody transfer and uses narrow beams that avoid tank-wall reflections.
Which region is expected to grow the fastest through 2031?
The Middle East is forecast to register a 10.40% CAGR, driven by large tank-farm automation projects.
Page last updated on:


