Market Overview
| Study Period | 2018 - 2031 |
|---|---|
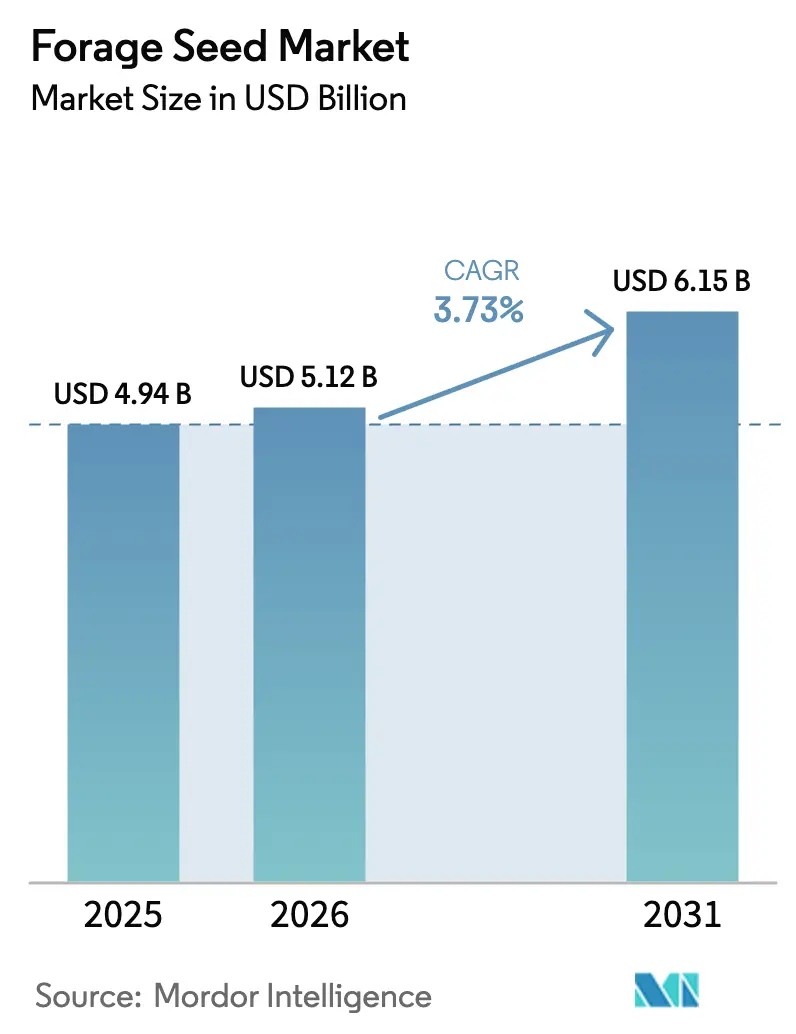
| Market Size (2026) | USD 5.12 Billion |
| Market Size (2031) | USD 6.15 Billion |
| Growth Rate (2026 - 2031) | 3.73% CAGR |
| Fastest Growing Market | Middle East |
| Largest Market | North America |
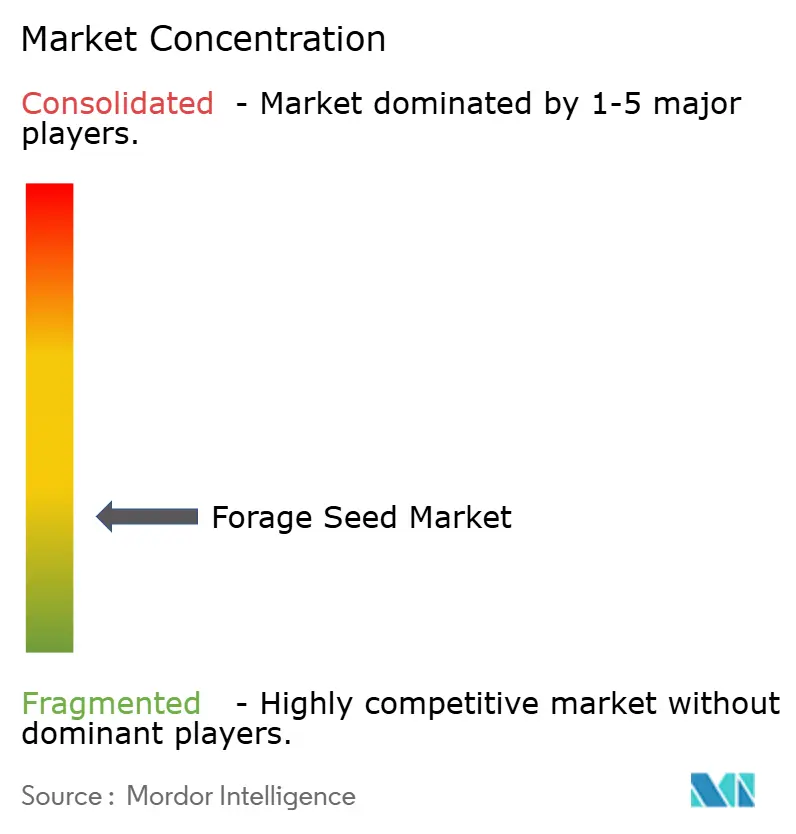
| Market Concentration | Low |
Major Players *Disclaimer: Major Players sorted in no particular order Image © Mordor Intelligence. Reuse requires attribution under CC BY 4.0. | |
Forage Seed Market Analysis by Mordor Intelligence
The forage seed market size was valued at USD 4.94 billion in 2025 and estimated to grow from USD 5.12 billion in 2026 to reach USD 6.15 billion by 2031, at a CAGR of 3.73% during the forecast period (2026-2031). Demand stems from expanding global protein consumption that pushes livestock operations to intensify production while maintaining feed quality. Higher adoption of regenerative agriculture further supports the forage seed market as perennial crops improve soil structure and open new carbon-credit revenue streams. Hybrid breeding gains traction because producers prioritize consistent yields, disease resistance, and drought tolerance. Digital agronomy platforms optimize seed placement, reducing waste and boosting stand uniformity. Regional growth remains uneven, with North America leading and the Middle East logging the fastest CAGR as food-security investments accelerate.
Key Report Takeaways
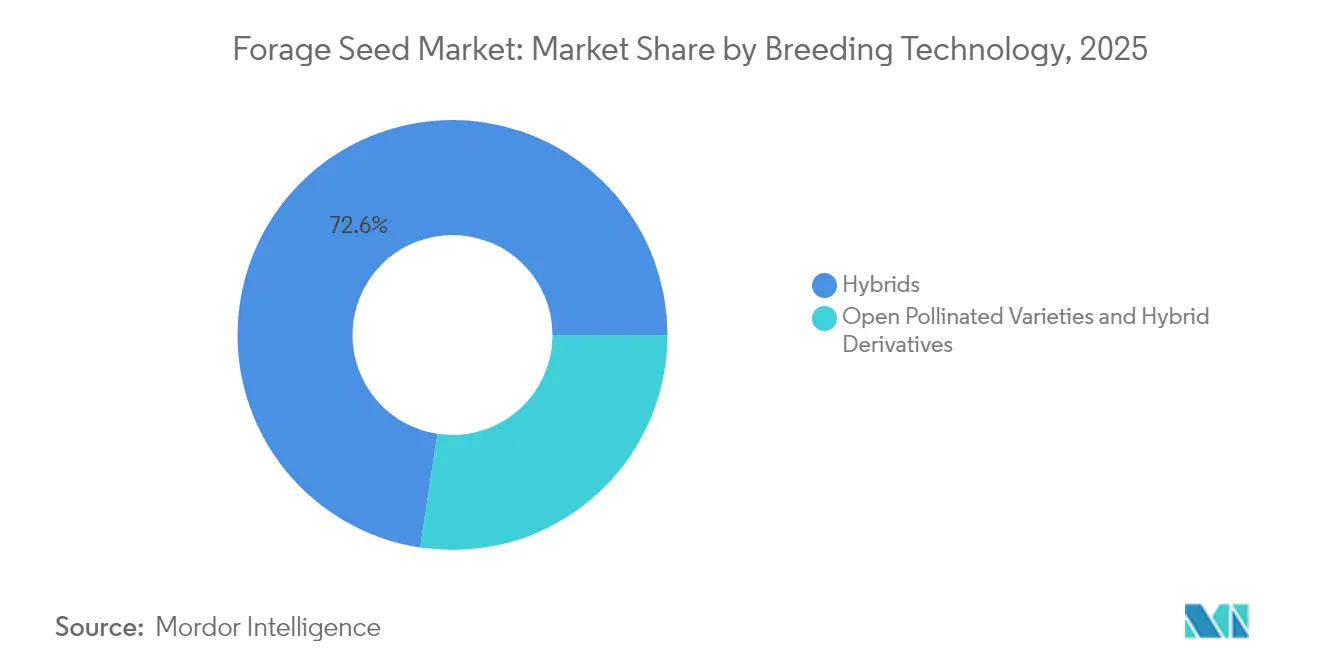
- By breeding technology, hybrids led with a 72.60% forage seed market share in 2025. Open-pollinated varieties and hybrid derivatives posted the highest projected at 4.05% CAGR through 2031.
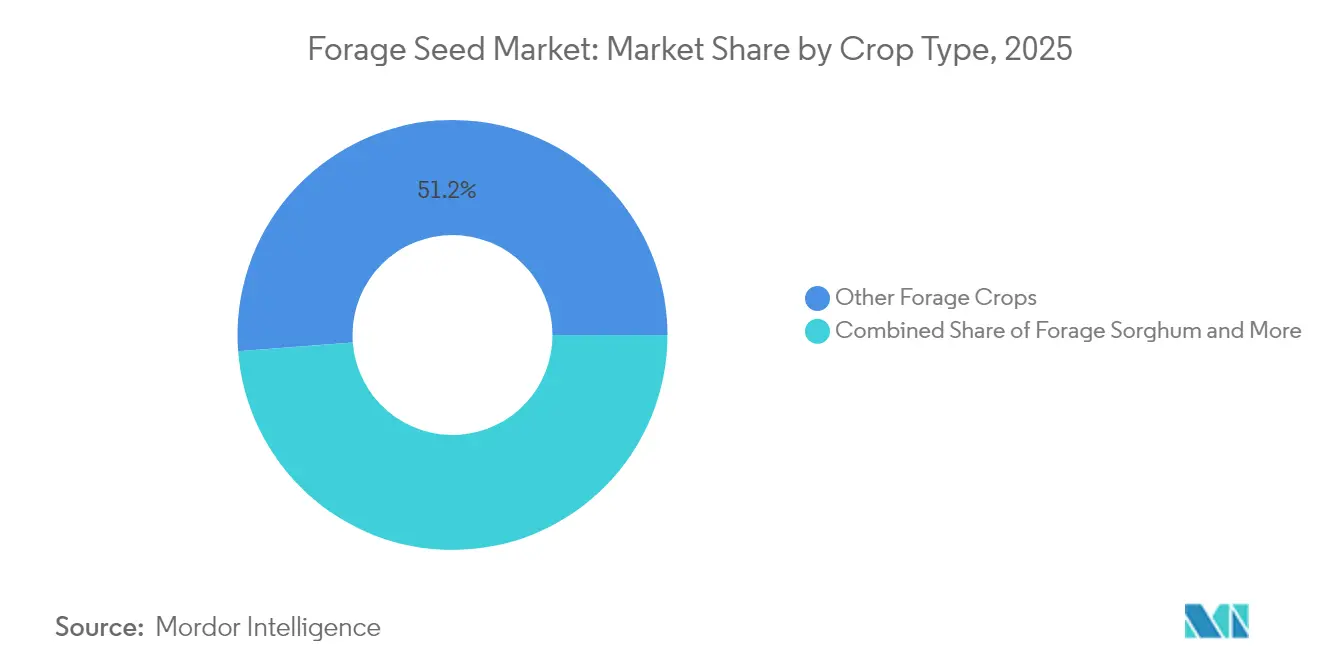
- By crop type, other forage crops captured 51.20% of the forage seed market size in 2025. Forage sorghum is set to grow at the fastest 4.12% CAGR through 2031.
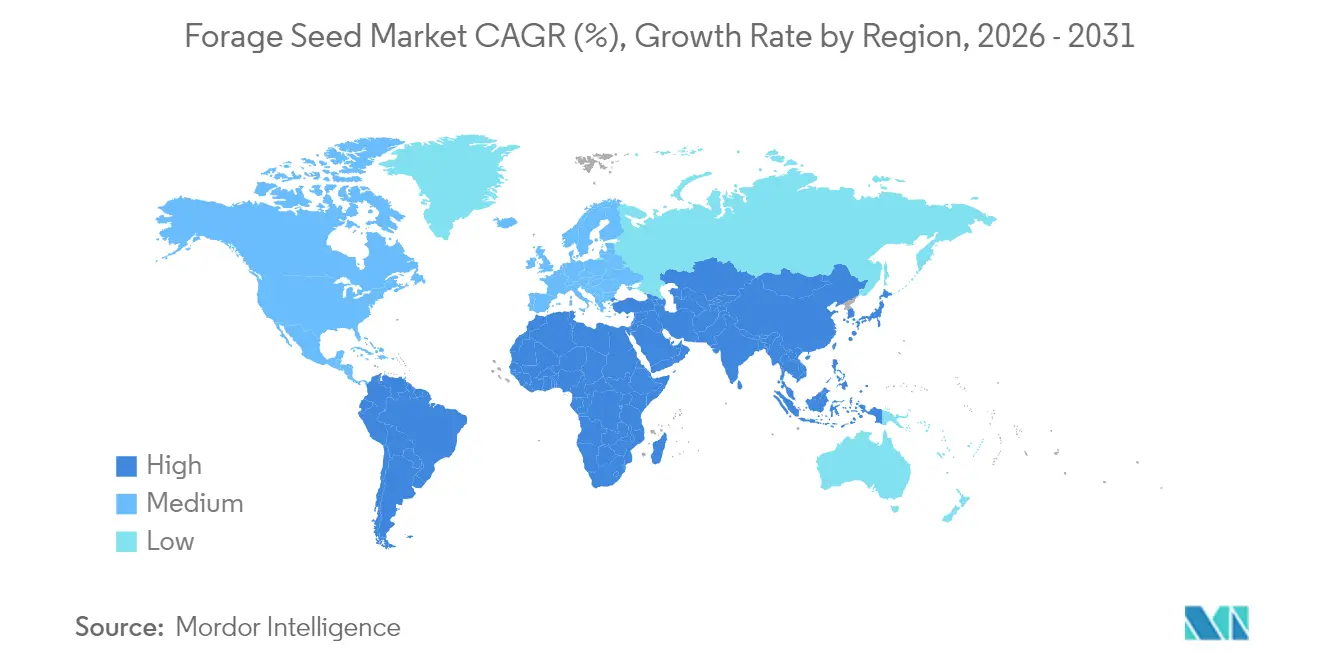
- By geography, North America held 41.85% of the forage seed market in 2025, while the Middle East is projected to expand at a 5.62% CAGR to 2031.
Note: Market size and forecast figures in this report are generated using Mordor Intelligence’s proprietary estimation framework, updated with the latest available data and insights as of 2026.
Global Forage Seed Market Trends and Insights
Drivers Impact Analysis*
| Driver | (~) % Impact on CAGR Forecast | Geographic Relevance | Impact Timeline |
|---|---|---|---|
| Rising livestock protein demand and dairy intensification | +0.8% | Global, with a concentration in Asia-Pacific and North America | Medium term (2-4 years) |
| Mandatory green-cover crop regulations in Europe and enhancing U.S. CRP (Conservation Reserve Program) incentives | +0.6% | Europe and North America, spillover to other developed markets | Long term (≥ 4 years) |
| Rapid adoption of drought-tolerant transgenic hybrids in water-stressed regions | +0.7% | Global, particularly the Middle East, Australia, and the southwestern United States | Short term (≤ 2 years) |
| Government push for regenerative grazing and carbon-credit programs | +0.5% | North America and Europe, emerging in Australia and Brazil | Long term (≥ 4 years) |
| Growing use of forage sorghum in bio-ethanol co-feed markets | +0.3% | North America and Brazil, expanding to Europe | Medium term (2-4 years) |
| Digital agronomy platforms boosting seed placement accuracy | +0.4% | Developed markets globally, with gradual adoption in emerging economies | Medium term (2-4 years) |
| Source: Mordor Intelligence | |||
Rising livestock protein demand and dairy intensification
Food and Agriculture Organization (FAO) projects a 15% jump in global livestock protein demand by 2030, prompting producers to seek higher-energy forages that lift milk yields and average daily gains[1]Source: FAO, “The State of Food and Agriculture 2023,” fao.org. Dairy herds in India and Vietnam are expanding rapidly, driving premium pricing for alfalfa and other protein-rich seeds that underpin long-term feed efficiency targets. In land-constrained regions, producers maximize output per hectare using dense stands of hybrid ryegrass and clover mixes. As profitability hinges on feed conversion, demand for consistently high-quality seed forms a stable growth pillar for the forage seed market.
Mandatory green-cover crop regulations in Europe and enhancing U.S. CRP (Conservation Reserve Program) incentives
The European Union’s Common Agricultural Policy now requires 4% of arable land to remain in ecological focus areas, making cover crops a compliance path that doubles as livestock feed[2]Source: European Commission Agriculture and Rural Development, “CAP 2023-27,” europa.eu. The United States lifted Conservation Reserve Program enrollment by pairing higher payments with flexibility for controlled grazing. These measures create predictable seed demand because non-compliance penalties outweigh premium seed costs, insulating the forage seed market from short-term price cycles.
Rapid adoption of drought-tolerant transgenic hybrids in water-stressed regions
Water scarcity now threatens 40% of agricultural land worldwide, intensifying the shift to hybrids engineered for water-use efficiency[3]Source: IPCC, “Climate Change 2022: Impacts, Adaptation and Vulnerability,” ipcc.ch. Field trials show 30% yield advantages for drought-tolerant varieties under stress, propelling adoption in Australia, Mediterranean Europe, and the United States Southwest. Higher water costs and irrigation caps further elevate the value proposition, helping transgenic hybrids secure shelf space even in risk-averse markets. Seed suppliers emphasize third-party validation data to accelerate farmer acceptance.
Government push for regenerative grazing and carbon-credit programs
Carbon credits now trade between USD 15 and USD 50 per ton of CO₂e, rewarding producers who deploy perennial pastures that lock away soil carbon. The USDA allocated USD 3.1 billion to Climate-Smart Commodities in 2024, funding forage stand establishment that meets both environmental and productivity goals. Food processors are setting carbon-neutral livestock procurement targets, allowing premium seeds to command strong price points as part of verified sustainability packages.
Restraints Impact Analysis*
| Restraint | (~) % Impact on CAGR Forecast | Geographic Relevance | Impact Timeline |
|---|---|---|---|
| Farmer skepticism about GM feed crops in the Asia-Pacific | -0.4% | Asia-Pacific, particularly China, India, and Southeast Asian markets | Long term (≥ 4 years) |
| Volatile commodity prices are squeezing growers' seed budgets | -0.5% | Global, with an acute impact on commodity-dependent economies | Short term (≤ 2 years) |
| Lagging cold-tolerance traits for high-latitude markets | -0.2% | Northern Europe, Canada, and the northern United States | Medium term (2-4 years) |
| Fragmented informal seed channels undermining quality in Africa | -0.3% | Sub-Saharan Africa, with spillover effects in parts of Asia | Long term (≥ 4 years) |
| Source: Mordor Intelligence | |||
Farmer skepticism about GM feed crops in the Asia-Pacific
Regulatory approval processes for genetically modified forage crops remain fragmented across Asia-Pacific markets, with countries like China and India maintaining restrictive policies that limit farmer access to advanced breeding technologies. Consumer concerns about GM feed crops entering the food chain create additional barriers, as livestock producers worry about market access restrictions for their products. This skepticism is particularly pronounced in smallholder farming systems, where traditional varieties maintain cultural significance and farmers lack access to technical information about GM crop benefits. The resistance limits market penetration for transgenic forage varieties, constraining growth potential in the world's largest agricultural region.
Volatile commodity prices are squeezing growers' seed budgets
Between 2020 and 2024, price volatility rose 40%, prompting producers to downgrade inputs when livestock margins tighten. When livestock prices decline, farmers typically reduce input costs by purchasing lower-quality seeds or delaying pasture renovation projects, creating cyclical demand patterns that challenge seed company revenue stability. The price sensitivity is most acute among smaller operations that lack financial reserves to maintain consistent seed purchasing during market downturns. This volatility forces seed companies to maintain larger inventory buffers and offer flexible payment terms, increasing operational costs that ultimately affect market growth rates.
*Our forecasts treat driver/restraint impacts as directional, not additive. The impact forecasts reflect baseline growth, mix effects, and variable interactions.
Segment Analysis
By Breeding Technology: Hybrids Drive Transformation
Hybrids led with a 72.60% forage seed market share in 2025. Open-pollinated varieties and hybrid derivatives posted the highest projected at 4.05% CAGR through 2031. Transgenic hybrids with herbicide tolerance gain momentum in the United States and Brazil, while non-transgenic hybrids dominate in regions with strict GM policies. Continuous R&D investment brings forward improved digestibility and broader environmental adaptability, supporting steady volume growth. Cost-sensitive growers in South Asia favor these seeds, often saving part of the crop for replanting without heavy yield penalties, a practice that sustains the forage seed market size among emerging economies. Conservation programs in multiple countries specify open-pollinated varieties, creating niche but reliable channels that buffer the wider market from volatility.
Second-generation hybrids that integrate drought tolerance and extended grazing windows hold promise for subtropical zones. Seed firms emphasize localized field trials, fostering trust among buyers who need proof of performance under specific soil and climate conditions. As digital agronomy tools advance, hybrid placement can be fine-tuned at sub-acre resolution, raising establishment success and reinforcing the value proposition. The hybrid segment’s strong intellectual property protection also enables sustained R&D funding, ensuring a steady pipeline of traits that fortify the forage seed market against climatic and economic headwinds. In parallel, policy frameworks that expedite trait approval while safeguarding biodiversity will shape adoption speed across geographies.


By Crop Type: Diversification Leads Market Evolution
Other forage crops held 51.20% of the forage seed market share in 2025, reflecting producer preference for species mix strategies that balance nutrition, soil health, and seasonal forage gaps. Ryegrass, timothy, and clover dominate cool-season pastures, delivering fast regrowth and nitrogen fixation that lowers fertilizer costs. Expansion of pollinator-friendly farming further boosts demand for diverse legumes, building new value chains around ecosystem services payments. Alfalfa remains the premium protein source for intensive dairy systems, but rising fertilizer prices drive renewed interest in mixed stands where legumes offset synthetic inputs. These trends secure a broad base that stabilizes the forage seed market size even when individual crop cycles fluctuate.
Forage sorghum records the fastest 4.12% CAGR, aided by its unparalleled drought resilience and suitability for integrated energy and livestock systems. Breeders focus on brown mid-rib traits that enhance digestibility, unlocking higher feed efficiency. Forage corn remains a mainstay in silage programs, yet water constraints and crop-rotation mandates push some producers toward sorghum. Native grass restoration initiatives in North America create incremental demand for species like switchgrass, particularly where government cost-share programs subsidize establishment. Combined, these dynamics illustrate a sector where crop-type diversification spreads risk and fosters innovation, keeping the forage seed market on a stable upward course.
Geography Analysis
North America accounted for 41.85% of the forage seed market in 2025, supported by large cattle herds and robust dairy clusters that value high-quality feed. Extensive extension networks accelerate the adoption of hybrids engineered for local soils, while precision seeding equipment achieves efficient stand density. Canada’s Prairie provinces emphasize cold-tolerant varieties, and Mexico’s northern states favor drought-adapted species. These tailored approaches ensure regional demand remains diversified and resilient.
Europe shows steady growth as the Common Agricultural Policy reforms mandate ecological focus areas that employ forage cover crops for compliance. Germany and France lead purchasing, driven by intensive dairy operations that reward high-protein grasses. Eastern European economies accelerate modernization, directing funds toward improved seed to raise livestock productivity and align with EU environmental standards. The European Green Deal further encourages carbon-sequestering pastures, extending upside for the forage seed market.
The Middle East posts the fastest 5.62% CAGR from 2026 to 2031. Government-backed food-security initiatives, particularly in Saudi Arabia and the UAE, allocate capital to state-of-the-art livestock facilities that depend on drought-tolerant forages. Efficient irrigation systems and protected cultivation techniques maximize output per drop of water, underpinning growing volumes despite arid conditions. Asia-Pacific presents mixed patterns: Australia accelerates adoption of transgenic hybrids, while Southeast Asia lags due to regulatory hurdles. Africa offers long-term potential, but informal seed channels and quality issues limit short-term expansion despite favorable agronomic conditions.

Competitive Landscape
The forage seed market is low-concentrated. Bayer AG and Corteva Inc. lead in transgenic trait portfolios, leveraging Clustered Regularly Interspaced Short Palindromic Repeats (CRISPR) editing and expansive regulatory teams to secure approvals. Their recent R&D outlays signal focus on drought and herbicide tolerance, traits that maintain relevance across major production zones. DLF A/S and Royal Barenbrug Group specialize in conventional breeding, deploying decade-old multilocation trials that yield locally adapted varieties.
Strategic partnerships are reshaping competition; seed companies integrate with digital agriculture platforms to offer end-to-end solutions that bundle genetics with data-driven crop management. Regional specialists carve defensible positions by tailoring varieties to niche conditions and offering technical support in local languages. S&W Seed Company targets arid environments with salt-tolerant lines, while Germinal Holdings Ltd. caters to high-latitude grass markets demanding winter survivability.
Vertical integration from breeding through retail allows faster feedback loops and continuous improvement. Smaller biotech firms supply trait innovations that larger players license, fostering a collaborative ecosystem that accelerates genetic gain without disproportionate R&D risk. Intellectual property enforcement remains pivotal, ensuring a positive return on trait development investments that power the forage seed market forward.
Forage Seed Industry Leaders
Bayer AG
Land O’Lakes Inc.
Royal Barenbrug Group
DLF A/S
Corteva Inc.
- *Disclaimer: Major Players sorted in no particular order

Recent Industry Developments
- March 2023: PGG Wrightson Seeds, a subsidiary of DLF, successfully developed the new GT07 phalaris variety. This variety exhibits greater persistence and market potential, particularly under Australia's changing climate conditions.
- March 2023: The Royal Barenbrug Group announced the acquisition of Watson Group, an independent seed specialist and and agricultural seed wholesaler.


Global Forage Seed Market Report Scope
Hybrids, Open Pollinated Varieties & Hybrid Derivatives are covered as segments by Breeding Technology. Alfalfa, Forage Corn, Forage Sorghum are covered as segments by Crop. Africa, Asia-Pacific, Europe, Middle East, North America, South America are covered as segments by Region.Breeding Technology
| Hybrids | Non-Transgenic Hybrids | |
| Transgenic Hybrids | Herbicide Tolerant Hybrids | |
| Other Traits | ||
| Open Pollinated Varieties and Hybrid Derivatives | ||
Crop Type
| Alfalfa |
| Forage Corn |
| Forage Sorghum |
| Other Forage Crops |
Geography
| Africa | By Breeding Technology | |
| By Country | Egypt | |
| Ethiopia | ||
| Ghana | ||
| Kenya | ||
| Nigeria | ||
| South Africa | ||
| Tanzania | ||
| Rest of Africa | ||
| Asia-Pacific | By Breeding Technology | |
| Australia | ||
| Bangladesh | ||
| China | ||
| India | ||
| Indonesia | ||
| Japan | ||
| Myanmar | ||
| Pakistan | ||
| Philippines | ||
| Thailand | ||
| Vietnam | ||
| Rest of Asia-Pacific | ||
| Europe | By Breeding Technology | |
| France | ||
| Germany | ||
| Italy | ||
| Netherlands | ||
| Poland | ||
| Romania | ||
| Russia | ||
| Spain | ||
| Turkey | ||
| Ukraine | ||
| United Kingdom | ||
| Rest of Europe | ||
| Middle East | By Breeding Technology | |
| Iran | ||
| Saudi Arabia | ||
| Rest of Middle East | ||
| North America | By Breeding Technology | |
| Canada | ||
| Mexico | ||
| United States | ||
| Rest of North America | ||
| South America | By Breeding Technology | |
| Argentina | ||
| Brazil | ||
| Rest of South America | ||
| Breeding Technology | Hybrids | Non-Transgenic Hybrids | |
| Transgenic Hybrids | Herbicide Tolerant Hybrids | ||
| Other Traits | |||
| Open Pollinated Varieties and Hybrid Derivatives | |||
| Crop Type | Alfalfa | ||
| Forage Corn | |||
| Forage Sorghum | |||
| Other Forage Crops | |||
| Geography | Africa | By Breeding Technology | |
| By Country | Egypt | ||
| Ethiopia | |||
| Ghana | |||
| Kenya | |||
| Nigeria | |||
| South Africa | |||
| Tanzania | |||
| Rest of Africa | |||
| Asia-Pacific | By Breeding Technology | ||
| Australia | |||
| Bangladesh | |||
| China | |||
| India | |||
| Indonesia | |||
| Japan | |||
| Myanmar | |||
| Pakistan | |||
| Philippines | |||
| Thailand | |||
| Vietnam | |||
| Rest of Asia-Pacific | |||
| Europe | By Breeding Technology | ||
| France | |||
| Germany | |||
| Italy | |||
| Netherlands | |||
| Poland | |||
| Romania | |||
| Russia | |||
| Spain | |||
| Turkey | |||
| Ukraine | |||
| United Kingdom | |||
| Rest of Europe | |||
| Middle East | By Breeding Technology | ||
| Iran | |||
| Saudi Arabia | |||
| Rest of Middle East | |||
| North America | By Breeding Technology | ||
| Canada | |||
| Mexico | |||
| United States | |||
| Rest of North America | |||
| South America | By Breeding Technology | ||
| Argentina | |||
| Brazil | |||
| Rest of South America | |||


Market Definition
- Commercial Seed - For the purpose of this study, only commercial seeds have been included as part of the scope. Farm-saved Seeds, which are not commercially labeled are excluded from scope, even though a minor percentage of farm-saved seeds are exchanged commercially among farmers. The scope also excludes vegetatively reproduced crops and plant parts, which may be commercially sold in the market.
- Crop Acreage - While calculating the acreage under different crops, the Gross Cropped Area has been considered. Also known as Area Harvested, according to the Food & Agricultural Organization (FAO), this includes the total area cultivated under a particular crop across seasons.
- Seed Replacement Rate - Seed Replacement Rate is the percentage of area sown out of the total area of crop planted in the season by using certified/quality seeds other than the farm-saved seed.
- Protected Cultivation - The report defines protected cultivation as the process of growing crops in a controlled environment. This includes greenhouses, glasshouses, hydroponics, aeroponics, or any other cultivation system that protects the crop against any abiotic stress. However, cultivation in an open field using plastic mulch is excluded from this definition and is included under open field.
| Keyword | Definition |
|---|---|
| Row Crops | These are usually the field crops which include the different crop categories like grains & cereals, oilseeds, fiber crops like cotton, pulses, and forage crops. |
| Solanaceae | These are the family of flowering plants which includes tomato, chili, eggplants, and other crops. |
| Cucurbits | It represents a gourd family consisting of about 965 species in around 95 genera. The major crops considered for this study include Cucumber & Gherkin, Pumpkin and squash, and other crops. |
| Brassicas | It is a genus of plants in the cabbage and mustard family. It includes crops such as carrots, cabbage, cauliflower & broccoli. |
| Roots & Bulbs | The roots and bulbs segment includes onion, garlic, potato, and other crops. |
| Unclassified Vegetables | This segment in the report includes the crops which don’t belong to any of the above-mentioned categories. These include crops such as okra, asparagus, lettuce, peas, spinach, and others. |
| Hybrid Seed | It is the first generation of the seed produced by controlling cross-pollination and by combining two or more varieties, or species. |
| Transgenic Seed | It is a seed that is genetically modified to contain certain desirable input and/or output traits. |
| Non-Transgenic Seed | The seed produced through cross-pollination without any genetic modification. |
| Open-Pollinated Varieties & Hybrid Derivatives | Open-pollinated varieties produce seeds true to type as they cross-pollinate only with other plants of the same variety. |
| Other Solanaceae | The crops considered under other Solanaceae include bell peppers and other different peppers based on the locality of the respective countries. |
| Other Brassicaceae | The crops considered under other brassicas include radishes, turnips, Brussels sprouts, and kale. |
| Other Roots & Bulbs | The crops considered under other roots & bulbs include Sweet Potatoes and cassava. |
| Other Cucurbits | The crops considered under other cucurbits include gourds (bottle gourd, bitter gourd, ridge gourd, Snake gourd, and others). |
| Other Grains & Cereals | The crops considered under other grains & cereals include Barley, Buck Wheat, Canary Seed, Triticale, Oats, Millets, and Rye. |
| Other Fibre Crops | The crops considered under other fibers include Hemp, Jute, Agave fibers, Flax, Kenaf, Ramie, Abaca, Sisal, and Kapok. |
| Other Oilseeds | The crops considered under other oilseeds include Ground nut, Hempseed, Mustard seed, Castor seeds, safflower seeds, Sesame seeds, and Linseeds. |
| Other Forage Crops | The crops considered under other forages include Napier grass, Oat grass, White clover, Ryegrass, and Timothy. Other forage crops were considered based on the locality of the respective countries. |
| Pulses | Pigeon peas, Lentils, Broad and horse beans, Vetches, Chickpeas, Cowpeas, Lupins, and Bambara beans are the crops considered under pulses. |
| Other Unclassified Vegetables | The crops considered under other unclassified vegetables include Artichokes, Cassava Leaves, Leeks, Chicory, and String beans. |


Research Methodology
Mordor Intelligence follows a four-step methodology in all our reports.
- Step-1: IDENTIFY KEY VARIABLES: In order to build a robust forecasting methodology, the variables and factors identified in Step-1 are tested against available historical market numbers. Through an iterative process, the variables required for market forecast are set and the model is built on the basis of these variables.
- Step-2: Build a Market Model: Market-size estimations for the forecast years are in nominal terms. Inflation is not a part of the pricing, and the average selling price (ASP) is kept constant throughout the forecast period.
- Step-3: Validate and Finalize: In this important step, all market numbers, variables and analyst calls are validated through an extensive network of primary research experts from the market studied. The respondents are selected across levels and functions to generate a holistic picture of the market studied.
- Step-4: Research Outputs: Syndicated Reports, Custom Consulting Assignments, Databases, and Subscription Platforms


