Global Biophotonics Market Size and Share
Market Overview
| Study Period | 2020 - 2031 |
|---|---|
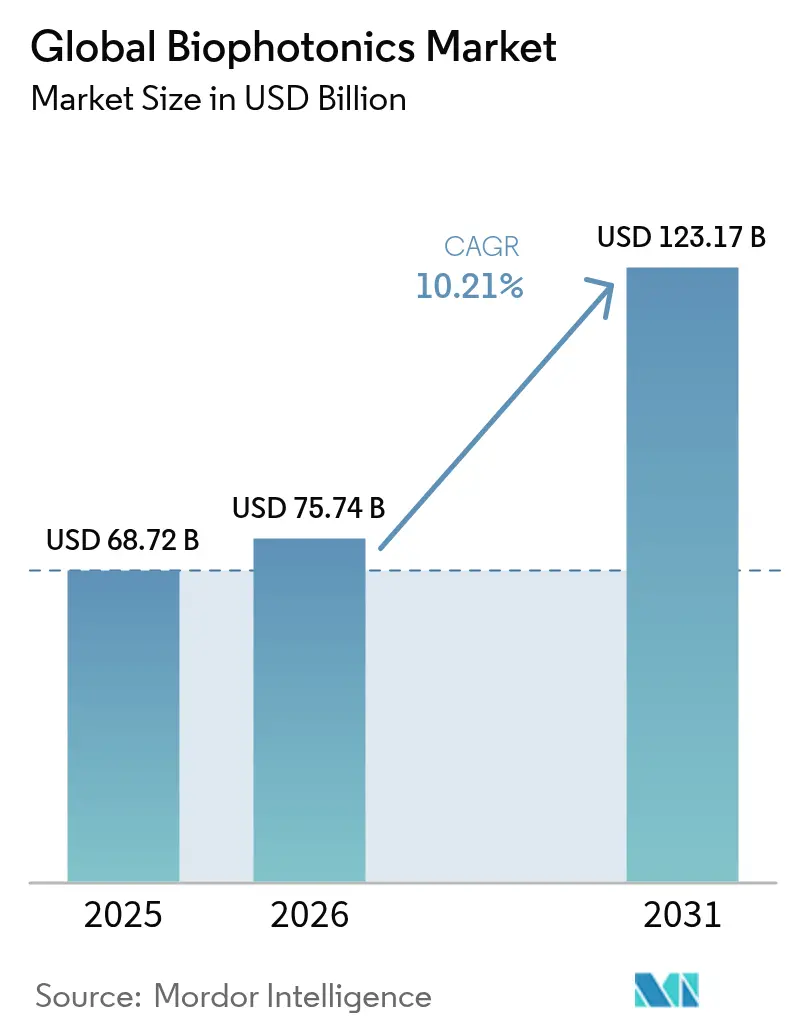
| Market Size (2026) | USD 75.74 Billion |
| Market Size (2031) | USD 123.17 Billion |
| Growth Rate (2026 - 2031) | 10.21% CAGR |
| Fastest Growing Market | Asia Pacific |
| Largest Market | North America |
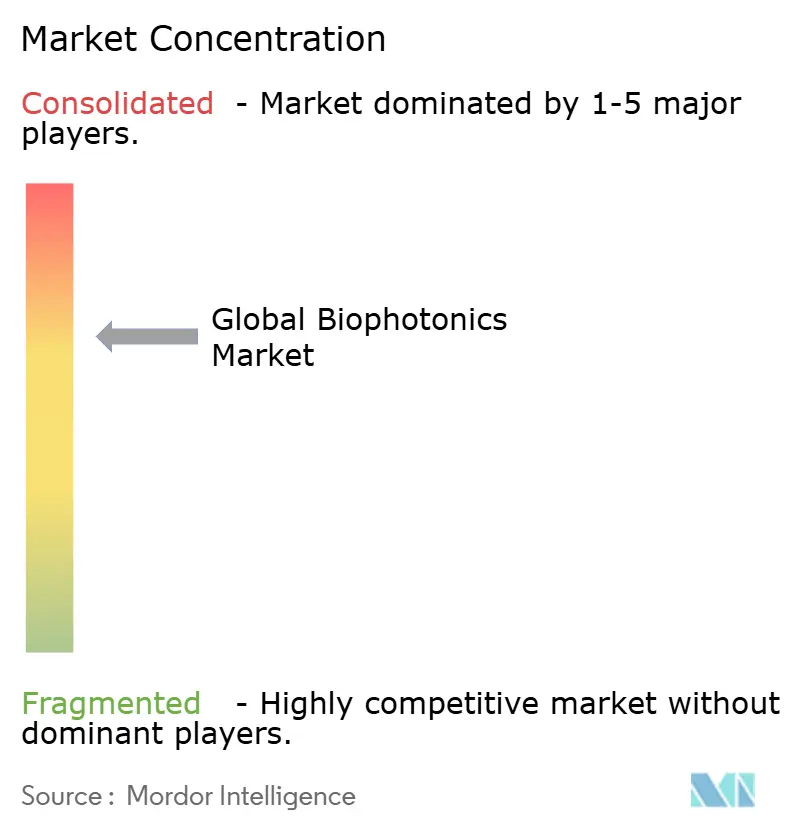
| Market Concentration | Medium |
Major Players *Disclaimer: Major Players sorted in no particular order Image © Mordor Intelligence. Reuse requires attribution under CC BY 4.0. | |
Global Biophotonics Market Analysis by Mordor Intelligence
Biophotonics market size in 2026 is estimated at USD 75.74 billion, growing from 2025 value of USD 68.72 billion with 2031 projections showing USD 123.17 billion, growing at 10.21% CAGR over 2026-2031. Strong growth stems from the convergence of artificial intelligence with optical technologies, where AI-enabled spectroscopy delivers 98.8% accuracy in non-invasive glucose monitoring. Nanotechnology paired with photoacoustic tomography now supports real-time stroke assessment, signaling a shift beyond conventional imaging toward precision therapeutic guidance. Asia-Pacific records the fastest expansion as China’s USD 4.17 billion 2024 investment in biomanufacturing and Japan’s USD 307 million program in optical chips build regional momentum. Lasers hold the leading product position due to precision surgical adoption, while imaging systems outpace other product groups through 2030. Hospitals continue to anchor demand, yet academic institutes move quickly as governments prioritize R&D initiatives.
Key Report Takeaways
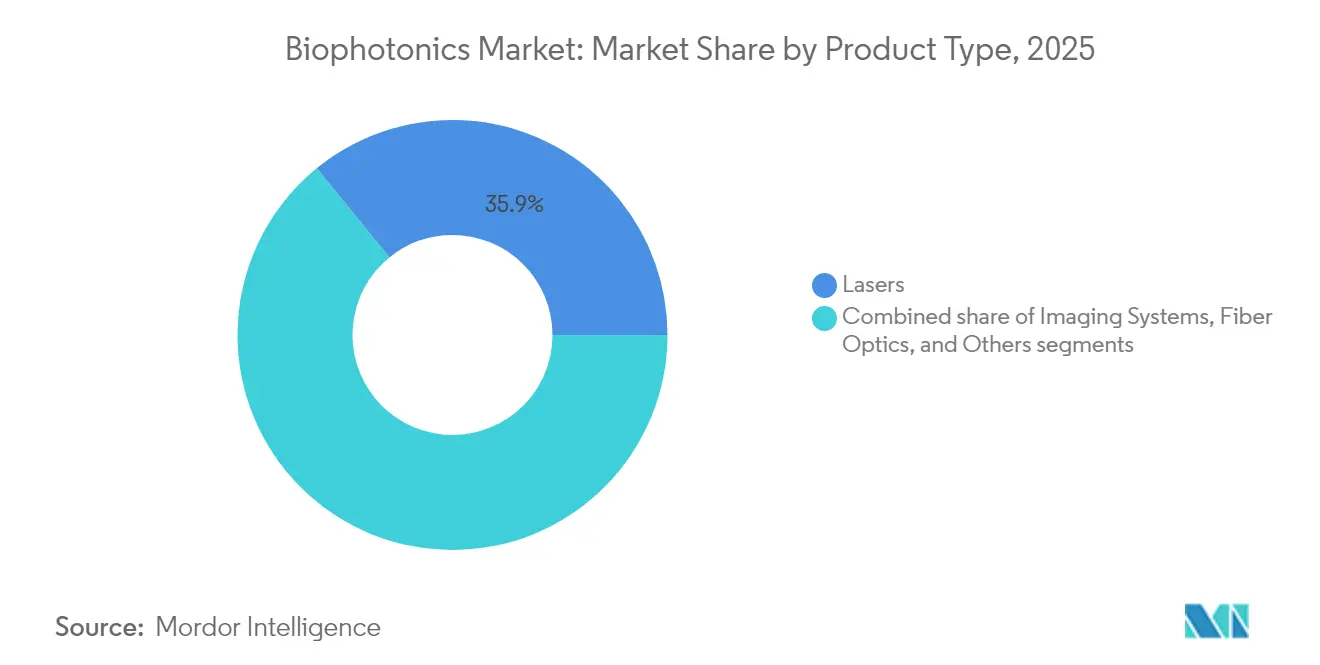
- By product type, lasers led with 35.88% of biophotonics market share in 2025, while imaging systems are projected to post an 11.23% CAGR through 2031.
- By technology, in-vitro platforms accounted for 60.92% of the biophotonics market size in 2025; in-vivo systems are forecast to advance at a 10.62% CAGR to 2031.
- By application, medical diagnostics retained 55.21% share of the biophotonics market size in 2025, whereas biosensors are on track for a 11.69% CAGR to 2031.
- By usage, hospitals and clinics commanded 51.74% share in 2025; academic and research institutes are set to expand at a 11.78% CAGR through 2031.
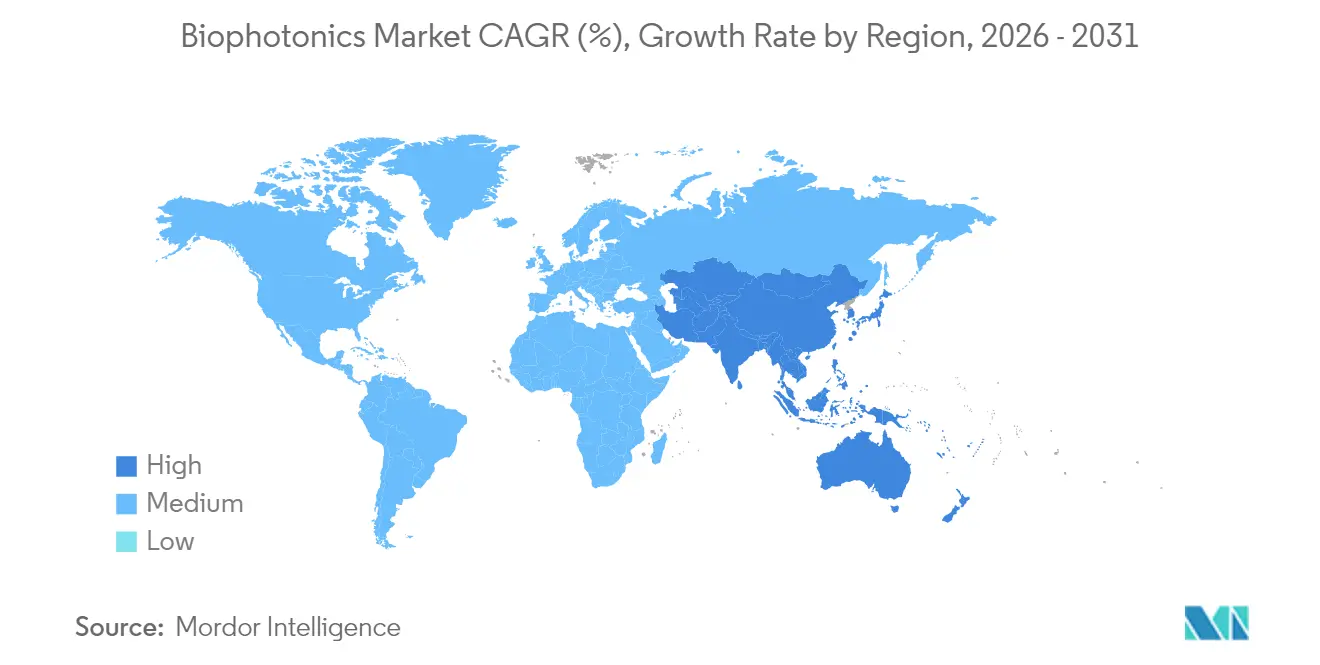
- By geography, North America led with 37.10% of biophotonics market share in 2025, while Asia-Pacific is projected to record the fastest 10.96% CAGR to 2031.
Note: Market size and forecast figures in this report are generated using Mordor Intelligence’s proprietary estimation framework, updated with the latest available data and insights as of 2026.
Global Biophotonics Market Trends and Insights
Drivers Impact Analysis*
| Driver | (~) % Impact on CAGR Forecast | Geographic Relevance | Impact Timeline |
|---|---|---|---|
| Increasing use of biophotonics in diagnostics | +2.1% | Global, led by Asia-Pacific adoption | Medium term (2-4 years) |
| AI-enabled spectroscopy for rapid PoC testing | +1.9% | Global, accelerated in Asia-Pacific | Short term (≤ 2 years) |
| Growing geriatric population | +1.8% | Global, concentrated in North America & Europe | Long term (≥ 4 years) |
| Emergence of nanotechnology in biophotonics | +1.5% | North America & EU research hubs | Medium term (2-4 years) |
| Advancements in photo-acoustic tomography (PAT) | +1.2% | Global, clinical validation in developed markets | Short term (≤ 2 years) |
| Precision-agriculture demand for biophotonic sensors | +0.8% | Global, emerging markets focus | Long term (≥ 4 years) |
| Source: Mordor Intelligence | |||
Increasing Use of Biophotonics in Diagnostics
Surface-enhanced Raman spectroscopy improved with machine learning reaches 87% balanced accuracy[1]Ben Cox, “A Multibeam Fabry–Perot Scanner Enables High-Speed Clinical Photoacoustic Tomography,” Nature Biomedical Engineering, nature.com for head and neck cancer detection using ear wax samples. Photoacoustic tomography supplies real-time vascular monitoring during stroke treatment. Smartphone spectrometers delivering 1 nm resolution across 440–1,300 nm open field diagnostics. The FDA created Class II special controls for near-infrared hematoma detectors, validating optical approaches. Integration with 6G networks offers ultra-low latency transmission for instant clinical decisions.
Growing Geriatric Population
Individuals aged 65 plus require three to four times more diagnostic procedures than younger cohorts, elevating long-term demand. Near-infrared spectroscopy enables continuous glucose monitoring[2]Na Kyung Lee, “Status and Trends of the Digital Healthcare Industry,” Healthcare Informatics Research, e-hir.org, addressing 537 million diabetes cases. Autofluorescence imaging secures 97% tumor-free margins in oral cancer surgery. Photobiomodulation supports Alzheimer’s management. Aging trends align with precision medicine to sustain biophotonic platform adoption.
Emergence of Nanotechnology in Biophotonics
Persistent luminescence nanoparticles deliver simultaneous imaging and targeted therapy. Quantum dots improve near-infrared imaging through reduced scattering. Metasurface biosensors heighten viral detection sensitivity. Enzyme-responsive nanomedicines activate near-infrared-II photoacoustic imaging for cascade-enhanced radiotherapy. Atomic force microscopy paired with AI detects oral cancer at nanoscale resolution.
Advancements in Photo-acoustic Tomography (PAT)
All-optical 3D PAT scanners now create detailed vascular images within seconds. Transcranial imaging benefits from homogeneous skull modeling. Low-cost multichannel acquisitions achieve 46.10 dB signal-to-noise ratios. Temporal encoding merges PAT with fluorescence data. Implicit neural representation tackles sparse-view limitations in dynamic reconstruction.
Restraints Impact Analysis*
| Restraint | (~) % Impact on CAGR Forecast | Geographic Relevance | Impact Timeline |
|---|---|---|---|
| Lack of awareness & skilled personnel | -1.4% | Global, acute in emerging markets | Medium term (2-4 years) |
| High cost of biophotonic systems | -1.1% | Price-sensitive markets, developing regions | Short term (≤ 2 years) |
| Stringent reimbursement frameworks | -0.9% | North America & Europe | Long term (≥ 4 years) |
| Rare-earth supply risk for laser diodes | -0.7% | Global manufacturing, Asia-Pacific production | Medium term (2-4 years) |
| Source: Mordor Intelligence | |||
Lack of Awareness & Skilled Personnel
Interdisciplinary expertise gaps slow adoption because staff must unite optics, biology, and data science skills. Clinicians unfamiliar with optical diagnostics hesitate to integrate new tools. Universities struggle to offer targeted curricula, limiting ready talent. Regulatory navigation adds complexity. Dedicated laboratories at the University of Central Florida reflect early institutional responses.
High Cost of Biophotonic Systems
Clinical photoacoustic units often exceed a USD 500,000 tag, restricting purchases to well-funded centers. Rare-earth supply risks inflate laser prices. Limited Medicare reimbursement narrows hospital budgets. Specialized maintenance pushes lifetime ownership costs higher. Portable spectrometers promise lower prices yet lack clinical-grade precision.
*Our forecasts treat driver/restraint impacts as directional, not additive. The impact forecasts reflect baseline growth, mix effects, and variable interactions.
Segment Analysis
By Product Type: Imaging Systems Drive Innovation
Lasers contributed 35.88% to the biophotonics market share in 2025, reflecting their role in precise photodynamic therapy and surgical work. Imaging systems are forecast to register an 11.23% CAGR, the highest among products, as surgeons seek real-time tissue characterization during operations. Fiber optics benefit from miniaturization trends, powering wearable biosensors. Hybrid quantum sensing improves single-molecule detection. Carl Zeiss consolidated capabilities by forming photonics business units. Manufacturers invest in automated lines to curb costs and meet growing volume. Greater component standardization speeds device certification. Collaborative R&D between optics firms and AI start-ups accelerates platform convergences. Environmental monitoring devices reuse core imaging modules, widening the addressable demand across agriculture and water safety.
Market participants refine beam quality and pulse stability to support emerging photoimmunotherapy protocols. Component vendors expand gallium arsenide wafer capacity for higher-power diode lasers. Imaging system suppliers integrate cloud-based analytics to cut interpretation time. The combined effect sustains product leadership while anchoring the broader biophotonics market.


By Technology: In-Vivo Applications Accelerate
In-vitro platforms maintained 60.92% of the biophotonics market size in 2025, thanks to established lab workflows. In-vivo systems are predicted to rise at a 10.62% CAGR as clinicians favor minimally invasive surgical guidance systems that provide real-time tissue assessment without specimen removal. Photoacoustic tomography now visualizes cerebral vessels through intact skulls. Optical guidance achieves 100% diagnostic success in single-insertion brain biopsies. Regulatory agencies outline streamlined pathways for real-time devices, aiding commercialization. Wearable monitors connect to IoT networks for continuous data feeds. Energy-efficient light sources extend device operating times. Hospitals integrate in vivo outputs into electronic health records, enhancing longitudinal care. Start-ups target ambulatory surgery centers with compact consoles. Emerging transdermal probes enable metabolic tracking, reinforcing expansion prospects for the biophotonics market.
By Application: Biosensors Transform Diagnostics
Analytics sensing held 29.96% share in 2025, bolstered by spectroscopic chemistry analysis. Biosensors will grow at a 11.69% CAGR as AI improves single-cell detection. Surface-enhanced Raman spectroscopy identifies drug concentrations down to 10 pg/mL. Optical coherence tomography moves into dermatology and cardiology. Light therapy gains recognition for Alzheimer’s care. Microscopy surpasses diffraction limits in live-cell imaging. Short-wave infrared see-through imaging assists surgeons. New polymer substrates reduce sensor cost, encouraging point-of-care deployment. Agricultural biosensors monitor soil nitrates, underscoring non-medical potential within the biophotonics market.
By Usage: Medical Diagnostics Maintain Dominance
Medical diagnostics accounted for 55.21% of the biophotonics market size in 2025 and will progress at a 10.41% CAGR. AI-powered research data platforms integrate clinical datasets for personalized care. Photodynamic therapy provides targeted cancer management with fewer systemic effects. Portable spectrometers support disease screening in remote areas. Food quality testing uses spatially offset Raman to detect honey fraud with 99% accuracy. Industry-specific software reduces analysis time, supporting wider uptake. Hospitals adopt leasing models to offset up-front costs. Telemedicine programs deploy handheld devices, reinforcing global demand for the biophotonics market.

By End-User: Academic Institutes Drive Innovation
Hospitals and clinics dominated with 51.74% share in 2025, favored by structured procurement and evidence needs. Academic and research institutes will expand at a 11.78% CAGR as national funds target photonics. Biopharma companies channel USD 2.5 billion into AI-mediated discovery. Food laboratories broaden optical testing amid stricter safety rules. Environmental agencies add fiber-optic probes for water-quality assessments. The University of Central Florida launched a dedicated lab to improve fiber-optic epidural placement. Collaborative hubs couple laser designers with neuroscientists, expediting translational research. Venture capital flows toward campus spin-offs that leverage open-source algorithms. Academic discoveries continue feeding product pipelines across the biophotonics market.
Geography Analysis
North America commanded 37.10% of biophotonics market share in 2025, supported by a mature healthcare system and an FDA framework that now classifies radiological optimization systems under Class II for faster clearance. Thermo Fisher allocated USD 2 billion for domestic expansion, reinforcing analytical instrument supply. Medicare reimbursement gaps limit some diagnostic rollouts. Specialist centers gain coverage for optical cervical screening, sustaining demand. Research grants underpin AI-photonics convergence, while the region’s rare-earth policies aim to secure laser diode inputs. Competition intensifies as start-ups commercialize handheld imaging, adding depth to the biophotonics market.
Europe posts a steady 9.87% CAGR, driven by a EUR 124.6 billion photonics ecosystem. Carl Zeiss advances ophthalmic portfolios by absorbing DORC and investing 15% of revenue back into R&D. The Medical Device Regulation harmonizes standards yet raises compliance costs for small firms. Horizon Europe funding prioritizes precision agriculture, lifting uptake of optical sensors. Cross-border academic consortia enhance technology validation, aligning with regional sustainability goals. Semiconductor laboratories in Dresden accelerate industrial microscopy solutions, extending market depth.
Asia-Pacific is the fastest-growing region at 10.96% CAGR. China leads with a USD 4.17 billion biomanufacturing infusion in 2024. Pilot photonic chip lines in Shanghai Jiao Tong University boost AI and quantum applications. Japan’s USD 307 million optical chip program seeks semiconductor leadership. India invests in quantum photonics despite infrastructure gaps. Local firms emphasize low-cost laser sources to satisfy price-sensitive healthcare providers. Government incentives lower import taxes on diagnostic optics, while telehealth efforts spread mobile spectrometers to underserved zones. Rapid clinic construction across Southeast Asia accelerates demand, supporting expansion of the biophotonics market.

Competitive Landscape
Market consolidation is moderate. Thermo Fisher pledged USD 50 billion for acquisitions and has already spent USD 4.1 billion on Solventum to deepen analytical capabilities. Carl Zeiss created dedicated photonics units and completed the DORC purchase to enhance ophthalmic integration. Becton Dickinson separated bioscience and diagnostic lines and acquired Edwards Lifesciences Critical Care for USD 4.2 billion. White-space growth appears in precision agriculture, where photonic sensors expand faster than clinical segments.
Patent activity in quantum sensing and metasurfaces signals a shift toward fundamental optical control. Vertical integration secures laser diode supply, countering rare-earth volatility. Smartphone-grade spectrometers achieve laboratory-equivalent performance, allowing new entrants without fabrication facilities.
Partnerships between optics giants and cloud AI providers accelerate algorithm deployment. The competitive narrative centers on integrated hardware-software ecosystems, reinforcing strategic depth across the biophotonics market.
Global Biophotonics Industry Leaders
Carl Zeiss AG
Danaher Corporation
Hamamatsu Photonics KK
Olympus Corporation
Thermo Fisher Scientific Inc.
- *Disclaimer: Major Players sorted in no particular order

Recent Industry Developments
- June 2025: Thermo Fisher Scientific unveiled Orbitrap Astral Zoom and Orbitrap Excedion Pro mass spectrometers at ASMS 2025, posting 35% faster scan speeds.
- April 2025: Thermo Fisher announced a USD 2 billion U.S. investment spread over four years, earmarking USD 500 million for R&D.
- October 2024: Carl Zeiss opened a semiconductor applications laboratory in the Dresden Innovation Hub to automate microscopy workflows.
- September 2024: Carl Zeiss Meditec launched a new Missouri facility with ISO 7 clean rooms to advance surgical instrument production.


Research Methodology Framework and Report Scope
Market Definitions and Key Coverage
Our study defines the biophotonics market as all light-based hardware, consumables, and integrated systems expressly designed for life-science research, medical diagnostics, and therapeutics. Devices intended purely for industrial inspection or telecommunications are excluded.
Scope exclusion: Components that never interface with biological material, such as telecom lasers and generic fiber links, lie outside this assessment.
Segmentation Overview
- By Product Type
- Imaging Systems
- Lasers
- Fiber Optics
- Others
- By Technology
- In-Vitro
- In-Vivo
- By Application
- Surface Imaging
- Inside Imaging
- See-through Imaging
- Microscopy
- Biosensors
- Analytics Sensing
- Spectromolecular
- Light Therapy
- Optical Coherence Tomography
- By Usage
- Tests and Components
- Medical Therapeutics
- Medical Diagnostics
- Non-Medical Application
- By End-User
- Hospitals & Clinics
- Academic & Research Institutes
- Biotechnology & Pharma Companies
- Food-Quality Labs
- Other End-Users
- By Geography
- North America
- United States
- Canada
- Mexico
- Europe
- Germany
- United Kingdom
- France
- Italy
- Spain
- Rest of Europe
- Asia-Pacific
- China
- India
- Japan
- Australia
- South Korea
- Rest of Asia-Pacific
- Middle East and Africa
- GCC
- South Africa
- Rest of Middle East and Africa
- South America
- Brazil
- Argentina
- Rest of South America
- North America
Detailed Research Methodology and Data Validation
Primary Research
Mordor analysts spoke with optical engineers at hospital labs, procurement leads in top teaching hospitals across North America, Europe, and Asia-Pacific, and executives at laser module suppliers. These conversations verified typical system lifecycles, emerging use cases such as AI-guided spectroscopy, and realistic price dispersion before we finalized model inputs.
Desk Research
We gathered foundational data from open-access authorities such as the US National Institutes of Health, Eurostat medical-device trade files, the World Bank's health-expenditure dashboard, and peer-reviewed PubMed articles on optical diagnostics. Industry context came from association portals (SPIE, Photonics21), FDA 510(k) summaries, and global customs shipment logs. Paid archives, notably Dow Jones Factiva for deal flow and D&B Hoovers for revenue splits, supplied firm-level clues that sharpened volume and ASP assumptions. This list is illustrative; many other secondary sources informed our checks and balances.
Market-Sizing & Forecasting
A top-down construct begins with national health-tech spend, academic grant flows, and procedure volumes for imaging-intensive specialties, which are then apportioned to biophotonics using penetration ratios derived from primary interviews. Supplier roll-ups of major OEM revenues, plus sampled ASP multiplied by unit counts from trade data, provide bottom-up anchors to cross-validate totals. Key variables driving the forecast include average laser ASP shifts, annual oncology screening rates, nanophotonics patent filings, photonic-chip production capacity, and regional R&D tax incentives. Multivariate regression with ARIMA overlays projects 2026-2030 values; anomalies beyond one standard deviation trigger manual review. Gaps in bottom-up subtotals, for example, limited disclosure by private OEMs, are bridged through regional proxies and calibrated confidence intervals.
Data Validation & Update Cycle
Our analysts run three-layer variance checks against external health-tech indices, revisit outliers with interviewees, and submit every model for senior review. Reports refresh once a year, with ad-hoc updates if regulatory or supply-chain shocks materially alter demand.
Why Our Biophotonics Baseline Commands Trust
Published estimates vary because firms choose different device mixes, price pathways, and refresh cadences.
Key gap drivers include divergent inclusion of research-only lasers, untested ASP escalation rules, and currency conversion cut-offs. Mordor reports reflect the latest fiscal-year exchange rates, a balanced mix of clinical and research spend, and an annual update cadence that cushions clients from mid-cycle surprises.
Benchmark comparison
| Market Size | Anonymized source | Primary gap driver |
|---|---|---|
| USD 68.72 B (2025) | Mordor Intelligence | - |
| USD 76.10 B (2024) | Global Consultancy A | Includes telecom lasers; uses fixed 2019 FX rates |
| USD 83.33 B (2024) | Trade Journal B | Assumes uniform 12% ASP growth; no bottom-up cross-check |
In sum, our disciplined scope selection, dual-path modeling, and timely refresh give decision makers a dependable, transparent baseline they can audit with minimal effort.


Key Questions Answered in the Report
How is artificial intelligence transforming biophotonics diagnostics?
AI-enhanced spectroscopy and imaging workflows are cutting analysis times and boosting accuracy, already reaching 98.8% precision in non-invasive glucose testing.
Which emerging technology is expanding the possibilities of in-vivo imaging?
Photoacoustic tomography combined with nanomaterials now visualizes cerebral vessels through intact skulls, offering real-time stroke monitoring in clinical environments .
Why are biosensors becoming pivotal in next-generation biophotonic applications?
Surface-enhanced Raman techniques paired with machine learning enable single-cell biomarker detection, advancing personalized medicine and rapid drug monitoring.
What supply-chain risk could affect biophotonic equipment pricing?
Reliance on rare-earth elements for high-power laser diodes exposes manufacturers to material shortages that can raise system costs.
How are healthcare organizations addressing the skills gap in biophotonics?
Hospitals are teaming with universities to establish interdisciplinary training labs—such as the dedicated biophotonics facility at the University of Central Florida—to blend optics, biology and data science expertise.
Which non-medical sector is emerging as a promising outlet for biophotonic sensors?
Precision agriculture is increasingly deploying optical probes to track crop health and soil nutrients, underscoring demand for sustainable farming solutions.
Page last updated on:


