
Cell Isolation Market Size and Share
Market Overview
| Study Period | 2020 - 2031 |
|---|---|
| Market Size (2026) | USD 17.91 Billion |
| Market Size (2031) | USD 33.91 Billion |
| Growth Rate (2026 - 2031) | 13.62 % |
| Fastest Growing Market | Asia Pacific |
| Largest Market | North America |
| Market Concentration | Medium |
Major Players *Disclaimer: Major Players sorted in no particular order Image © Mordor Intelligence. Reuse requires attribution under CC BY 4.0. | |
Cell Isolation Market Analysis by Mordor Intelligence
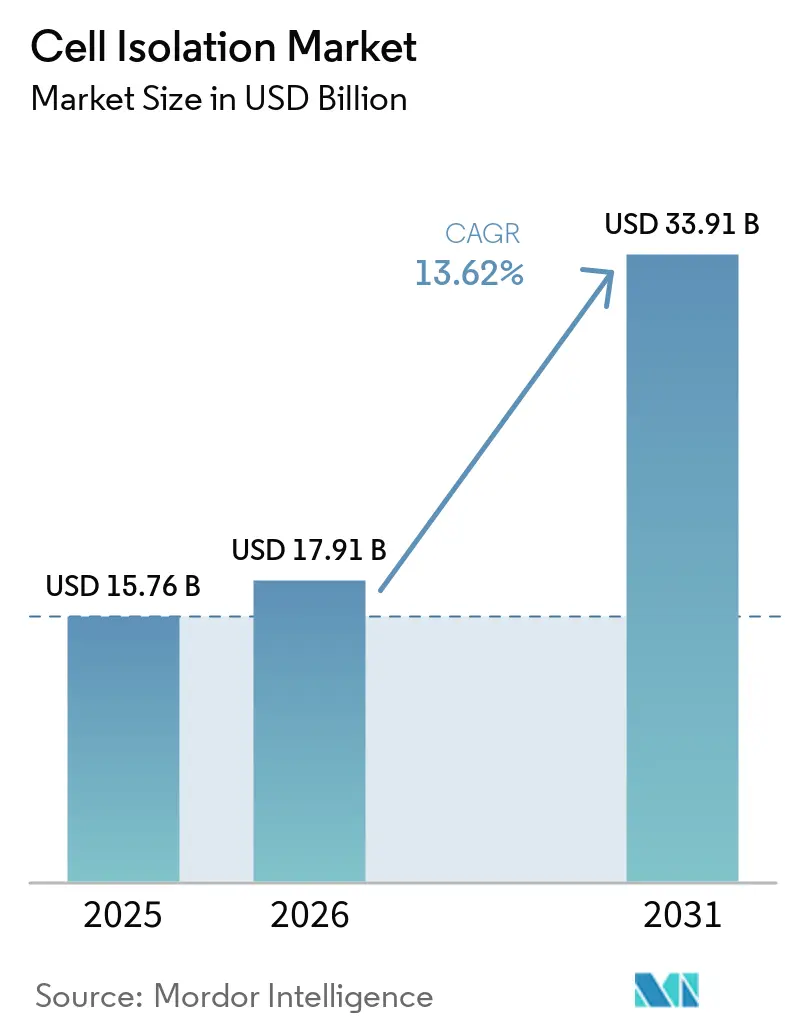
The cell isolation market size is expected to grow from USD 15.76 billion in 2025 to USD 17.91 billion in 2026 and is forecast to reach USD 33.91 billion by 2031 at 13.62% CAGR over 2026-2031. Expansion is propelled by accelerating adoption of cell-based therapies, sustained public‐ and private-sector research funding, and a rapid build-out of biopharmaceutical manufacturing capacity. Automation-ready instruments, especially high-parameter flow cytometers and integrated microfluidic platforms, are moving from research laboratories to GMP suites, shortening development timelines for cell therapies and precision diagnostics. North America remains the largest regional contributor, while Asia-Pacific posts the fastest growth on the strength of government grants and infrastructure investments. Regulatory cost pressure and a severe shortage of skilled technologists are intensifying the need for turn-key, user-friendly platforms that minimize hands-on time and ensure compliance with evolving quality standards.
Key Report Takeaways
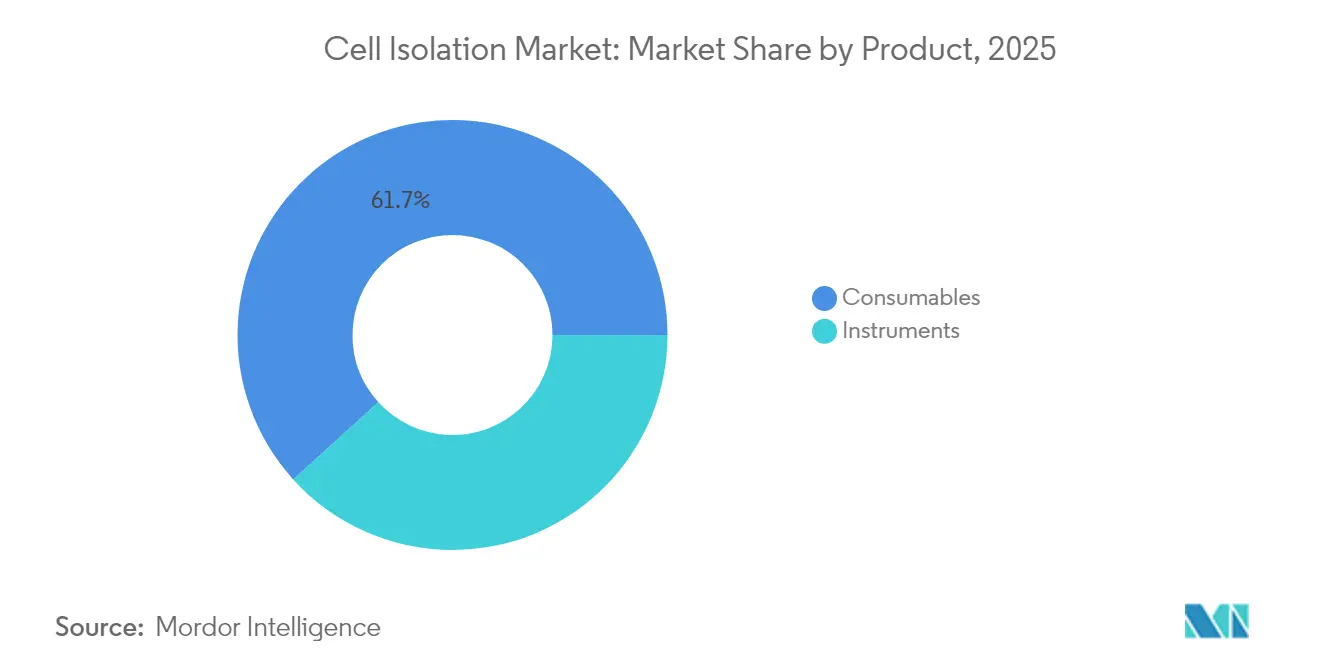
- By product, consumables led with 61.72% of market share in 2025, whereas instruments are forecast to grow at a 15.12% CAGR through 2031.
- By technique, Magnetic-Activated Cell Separation (MACS) captured 45.02% of the market in 2025, while microfluidics & lab-on-chip isolation is projected to expand at a 15.58% CAGR over the same period.
- By cell type, human cells accounted for 70.88% share in 2025, with animal cells poised to increase at a 15.06% CAGR to 2031.
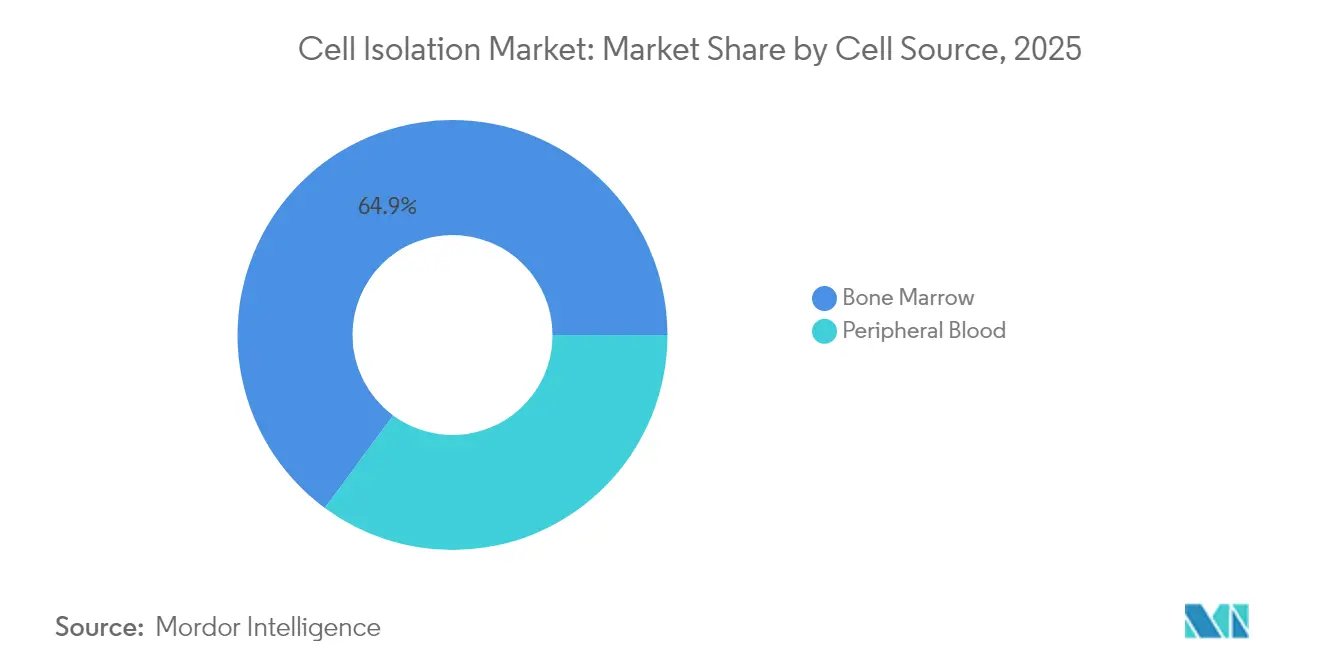
- By cell source, peripheral blood held 35.12% share in 2025, and bone marrow is anticipated to rise at a 15.31% CAGR during 2026-2031.
- By end user, research laboratories & academic institutes commanded 46.01% of the market in 2025, whereas contract research & manufacturing organizations are projected to register the highest CAGR at 16.07%.
- By geography, North America dominated with a 40.86% share in 2025, while Asia-Pacific is expected to be the fastest-growing region with a 14.21% CAGR through 2031.
Note: Market size and forecast figures in this report are generated using Mordor Intelligence’s proprietary estimation framework, updated with the latest available data and insights as of 2026.
Global Cell Isolation Market Trends and Insights
Drivers Impact Analysis*
| Driver | % Impact on CAGR Forecast | Geographic Relevance | Impact Timeline |
|---|---|---|---|
| Growing Adoption Of Cell-Based Therapies | 3.2% | Global, with North America and Europe leading | Medium term (2-4 years) |
| Rising Funding For Life Science Research | 2.8% | North America, Europe, APAC emerging markets | Long term (≥ 4 years) |
| Technological Advancements In Cell Separation Platforms | 2.5% | Global, concentrated in developed markets | Short term (≤ 2 years) |
| Increasing Prevalence Of Chronic Diseases | 2.1% | Global, with aging populations in developed countries | Long term (≥ 4 years) |
| Expansion Of Biopharmaceutical Manufacturing Capacity | 1.9% | APAC core, spill-over to North America and Europe | Medium term (2-4 years) |
| Emergence Of Personalized Medicine And Precision Diagnostics | 1.4% | North America and Europe primarily | Medium term (2-4 years) |
| Source: Mordor Intelligence | |||


Growing Adoption of Cell-Based Therapies
FDA approvals for 37 cell and gene therapy products in 2024 underscore a clinical shift toward living medicines that require precise cell isolation workflows. CAR-T programs are multiplying, and cost-optimized, allogeneic platforms are moving into pivotal trials, magnifying demand for standardized, high-throughput selection of lymphocyte subsets. Brazil’s USD 35,000 CAR-T program illustrates how regional cost innovation can unlock new patient cohorts and expand the addressable cell isolation market. As pipeline volume rises, scalability and batch-to-batch consistency become decisive purchase criteria for instruments and reagents.
Rising Funding for Life-Science Research
NIH High-End Instrumentation (HEI) and Shared Instrumentation Grant programs collectively disburse up to USD 2 million per award for flow cytometers and cell analyzers, anchoring a predictable domestic demand cycle[1]National Institutes of Health, “High-End Instrumentation (HEI) Grant Program,” nih.gov. Venture investors echo public enthusiasm: Garuda Therapeutics raised USD 50 million in Series A-1 financing for off-the-shelf stem-cell platforms, underscoring private-sector confidence in innovative isolation technologies. Regional technology hubs such as the Corvallis Microfluidics Technology Hub (planned 5,000–12,000 jobs by 2033) pool talent, infrastructure, and capital, accelerating product commercialization.
Technological Advancements in Cell Separation Platforms
AI-enabled multi-agent robotic systems such as BioMARS execute autonomous separation protocols with performance at par with experienced technicians, reducing operator variability and lowering training costs[2]Nature, “BioMARS: A Multi-Agent Robotic System for Autonomous Biological Experiments,” nature.com. Spectral flow cytometry, exemplified by BD’s FACSDiscover A8 analyzer, now records up to 50 parameters per cell, delivering deeper phenotyping without compromising throughput. Touchless acoustic-levitation modules eliminate shear-related cell damage and shrink instrument footprints, a benefit for GMP cleanrooms where space commands a premium. Machine-learning models boost predictive power of imaging flow cytometers by correlating morphology with protein expression, facilitating non-destructive, longitudinal studies and zonal isolation.
Increasing Prevalence of Chronic Diseases
Cancer incidence is projected to approach 30.2 million cases by 2040, propelling adoption of liquid biopsy and immunophenotyping assays that depend on highly selective cell isolation steps[3]World Health Organization, “Cancer Fact Sheet,” who.int. Stem-cell therapies for degenerative diseases are forecast to climb to USD 2,612.9 million by 2033, adding volume to stem-cell separation reagents. Regulatory green lights for novel blood-based tests such as the Shield colorectal assay (83% accuracy) validate cell-isolation-enabled diagnostics in routine screening.
Restraints Impact Analysis*
| Restraints Impact Analysis | (~) % Impact on CAGR Forecast | Geographic Relevance | Impact Timeline |
|---|---|---|---|
| High Cost Of Advanced Instruments | -1.8% | Global, particularly impacting emerging markets | Short term (≤ 2 years) |
| Stringent Regulatory And Compliance Requirements | -1.5% | North America and Europe primarily | Medium term (2-4 years) |
| Limited Skilled Workforce In Flow Cytometry | -1.2% | Global, acute in developed markets | Long term (≥ 4 years) |
| Ethical Concerns And Sample Sourcing Challenges | -0.9% | Global, varying by regulatory framework | Medium term (2-4 years) |
| Source: Mordor Intelligence | |||
High Cost of Advanced Instruments
Top-end cell sorters often list above USD 1 million, limiting access for smaller institutes and emerging-market labs. FDA alignment with ISO 13485 by February 2026 will oblige manufacturers to overhaul quality systems, adding compliance overhead and potentially inflating price tags. Even reduced 510(k) fees of USD 6,084 for qualified small businesses strain startup budgets. This capital barrier nudges users toward leasing models and centralized core facilities.
Stringent Regulatory and Compliance Requirements
Forthcoming FDA oversight of laboratory-developed tests will impose phased registration, quality, and adverse-event reporting on clinical labs, stretching validation timelines. Divergent EU and US interpretations for donor compensation and traceability complicate global supply chains for starting materials. The lack of FDA-standardized controls for flow-cytometry assays keeps them in the LDT category, elevating on-site validation costs.
*Our forecasts treat driver/restraint impacts as directional, not additive. The impact forecasts reflect baseline growth, mix effects, and variable interactions.
Segment Analysis
By Product: Consumables Dominate Amid Rising Instrument Automation
Consumables generated 61.72% of 2025 revenues owing to continual replenishment of antibodies, magnetic beads, density media, and disposable cartridges. Reagents customized for CAR-T workflows and GMP-grade buffers command premium pricing, ensuring stable annuity streams for suppliers. Instrument growth, though from a smaller base, is forecast at 15.12% CAGR as users replace manual centrifuges with closed, automated systems that integrate cell washing, volume reduction, and enrichment in a single run. Early adopters report labor savings of up to 40% and lower contamination events, validating ROI assumptions.
The cell isolation market size derived from instruments is set to rise sharply as multi-modal platforms blend magnetic, acoustic, and optical forces within one compact chassis, reducing footprint by 30% relative to legacy layouts. Vendors now bundle consumables under subscription plans that flatten year-one capital outlay, broadening access for mid-tier hospitals. The strategy also locks in reagent pull-through, reinforcing vendor stickiness.


By Technique: MACS Leads, Microfluidics Surges
MACS retained 45.02% of cell isolation market share in 2025 on account of proven protocols, wide antibody menus, and scalable column formats. Yet microfluidic lab-on-chip devices are recording a 15.58% CAGR, fueled by single-cell omics where precise capture of scarce populations is essential. Researchers cite 75% lower sample and reagent consumption alongside reduced operator exposure to biohazards.
The cell isolation market size attributable to microfluidics will grow further as AI-guided droplet generators achieve sub-100 µm precision, enabling downstream barcoding for high-content sequencing. Hybrid platforms now marry dielectrophoretic pre-enrichment with magnetic-bead polishing to reach >98% purity in one continuous flow, shortening setup time and preserving cell viability for sensitive applications.
By Cell Type: Human Cells Remain the Revenue Anchor
Human cells contributed 70.88% of 2025 turnover because clinical programs dominate purchasing power. Therapeutic manufacturers prize GMP-grade antibodies and closed isolators that comply with regional pharmacopoeias. Animal cell demand, rising at 15.06% CAGR, reflects growth in veterinary biologics and alternative toxicity assays. Regulatory leniency in animal models cuts validation timelines, attracting investment into livestock genetics and companion-animal oncology.
Human-cell workflow complexity elevates average consumable spend per sample, cushioning vendors from price erosion. The steady inflow of 1,200+ active US trials sustains baseline demand even if individual programs fail, buffering revenue volatility.
By Cell Source: Peripheral Blood Accessible, Bone-Marrow Rich
Peripheral blood supplied 35.12% of 2025 volumes, prized for venipuncture convenience and minimal donor-site morbidity. The cell isolation market size linked to bone-marrow inputs is expanding fastest (15.31% CAGR) since hematopoietic stem-cell yields are up to 500-fold higher, critical for off-the-shelf allogeneic products. Emerging workflows employ rapid marrow aspiration kits paired with acoustic-levitation fractionators, halving processing times compared with gradient centrifugation.
Perinatal tissues gain traction because of immunologically naive cell populations and fewer ethical hurdles. Automated tissue dissociation robots now achieve >85% yield on cord-tissue MSCs within 30 minutes, replacing manual scalpel dissection and reducing operator risk.
By End User: Academia Leads, CROs Accelerate
Academic laboratories accounted for 46.01% of 2025 spend, leveraging multi-year grant funding to upgrade cytometers and microfluidic chips. CROs register a 16.07% CAGR, mirroring biopharma outsourcing trends that seek to de-risk capital expenditure. For CDMOs running at <50% capacity, differentiation pivots on closed-system isolators with electronic batch records that ease client audits.
Diagnostic labs broaden adoption of fully scripted sorters tied into laboratory information systems, slashing hands-on time for cytogenetic tests. Workforce shortages intensify reliance on such automation, allowing 24/7 operation with minimal supervision.
Geography Analysis
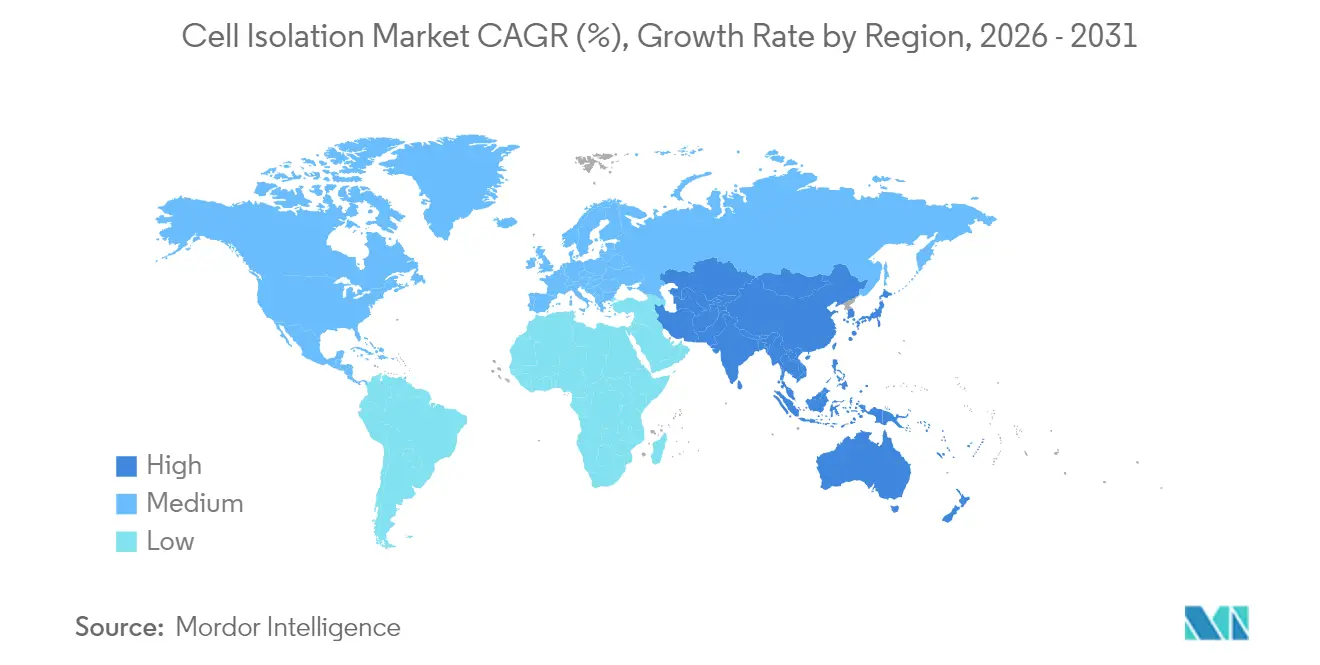
North America generated 40.86% of 2025 revenue, sustained by NIH grant cycles and high clinical-trial density. Thermo Fisher’s USD 10.36 billion first-quarter 2025 revenue, bolstered by its USD 4.1 billion Solventum acquisition, confirms robust instrument pull-through. Yet the region’s 20,000-25,000 technologist shortfall lifts demand for turnkey platforms that embed AI-driven quality checks to ease regulatory audits.
Asia-Pacific posts a 14.21% CAGR, the fastest among all regions, buoyed by state subsidies and capacity additions across China, South Korea, and India. China hosted 37% of global clinical trials in 2024, catalyzing uptake of microfluidic isolators aligned with domestic GMP. South Korea’s Fast Track pathway for regenerative medicines accelerates approval timelines by up to 12 months, motivating early equipment purchases by local CDMOs. Indigenous CAR-T entrants in India signal a shift toward regional supply chains, expanding the prospective customer base for mid-priced instruments.
Europe maintains solid demand despite tighter regulatory scrutiny under the EU Clinical Trials Regulation. Academic-industry consortia leverage Horizon Europe grants to finance spectral-cytometry upgrades, ensuring steady replacement cycles. Meanwhile, Latin America shows promise as Brazil’s USD 35,000 CAR-T program spotlights cost-conscious innovation, although reimbursement uncertainties temper immediate uptake. Middle East & Africa demand is nascent but rising as governments invest in transplant centers and immuno-oncology hubs.

Regulatory Landscape
Regulation for cell isolation instruments and consumables is anchored on intended use, patient-contact claims, and whether workflows align with clinical diagnostics or therapeutic manufacturing. In the United States, the FDA framework for human cells, tissues, and cellular and tissue-based products (HCT/Ps) under 21 CFR Part 1271 distinguishes minimally manipulated, homologous-use products that can be regulated under Section 361 of the Public Health Service Act from products and associated processing that fall under Section 351 and require more extensive premarket and biologics oversight. Quality-system pressure also rises as FDA alignment with ISO 13485 by February 2026 increases documentation and validation expectations for device manufacturers supplying closed, automated isolation workflows into GMP environments.
In Europe, regulatory classification can route cell-isolation-related systems under the Medical Devices Regulation (MDR) or the In Vitro Diagnostic Medical Devices Regulation (IVDR, EU 2017/746), depending on claims and diagnostic intent, with notified-body involvement shaping evidence and post-market obligations for higher-risk IVD pathways. Globally, standardization is tightening through ISO/TS 23565:2021 for bioprocessing equipment and consumables used in cell isolation, selection, expansion, and washing for therapeutic manufacturing, while ISO 21709:2020 covers quality requirements around mammalian cell line establishment and characterization in biobanking. Emerging standards work such as ISO/DIS 25347 for extracellular vesicle purification signals expands formal expectations for isolation and validation beyond cells alone, influencing supplier documentation packages and customer audit checklists.
Competitive Landscape
Market leaders adopt vertical-integration playbooks to secure reagent supply, capture higher margins, and bundle service contracts. Thermo Fisher’s acquisition of Solventum’s purification unit and Merck KGaA’s USD 600 million purchase of Mirus Bio exemplify this consolidation wave. BD complements organic R&D with automation alliances, such as its robotic-integration pact with Biosero, to embed cell isolation inside seamless drug-discovery workflows.
Mid-cap innovators challenge incumbents through differentiated technologies: Cytek Biosciences’ Full-Spectrum Profiling eliminates traditional filters, cutting instrument complexity and price, and still delivered USD 201 million revenue in 2024. Quanterix’s planned tie-up with Akoya Biosciences melds ultra-sensitive protein detection with spatial biology, strengthening its pitch to translational researchers. AI-native startups supply software layers that retrofit onto installed hardware, unlocking incremental revenue for both parties.
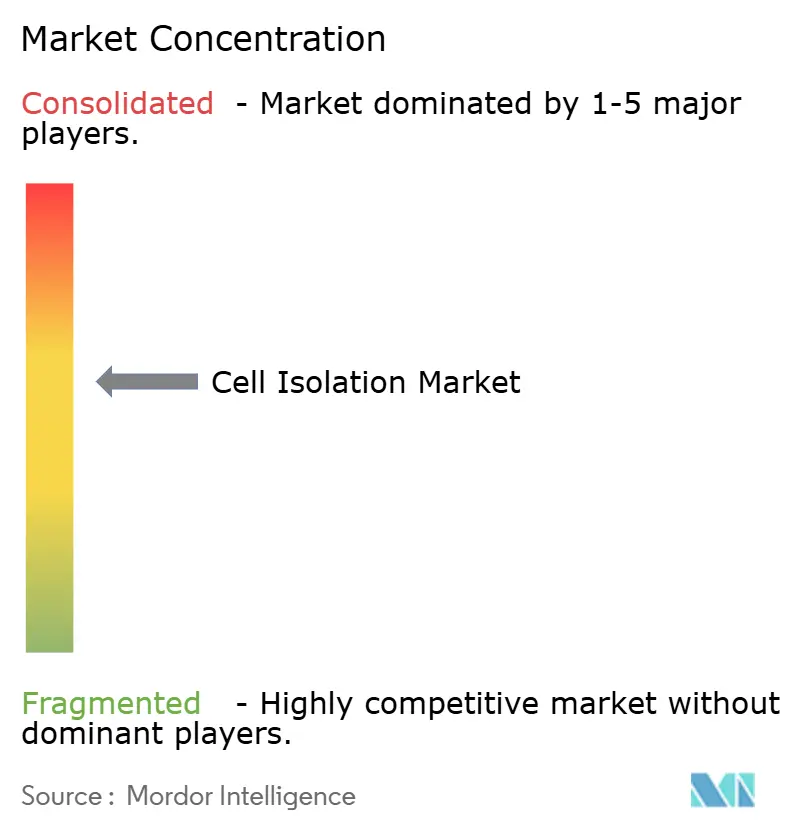
White-space opportunities cluster around automated sample prep, consumable-agnostic platforms, and mid-range systems for emerging markets. Vendors able to certify closed-loop sterility while maintaining sub-USD 500,000 price points are likely to capture hospitals entering the autologous-therapy arena. Competitive intensity remains moderate, but concentration is inching upward as multi-billion-dollar mergers trim the long tail of niche suppliers.
Cell Isolation Industry Leaders
Bio-Rad Laboratories Inc
Danaher Corporation (Cytiva)
Merck KGaA (MilliporeSigma)
Becton, Dickinson & Company
Thermo Fisher Scientific Inc.
- *Disclaimer: Major Players sorted in no particular order

Market Opportunities and Future Outlook
Demand is moving toward turnkey, compliance-ready workflows that reduce operator dependence and streamline validation in both GMP suites and regulated clinical settings. The clearest whitespace sits at the intersection of automation and quality control: vendors that pair closed-system isolation with release-testing and data packages can shorten tech transfer cycles for sponsors and CDMOs expanding cell and gene therapy capacity. This aligns with the market structure, where consumables held 61.72% share in 2025, creating room for suppliers to bundle GMP-grade reagents, disposable fluid paths, and service into subscription-style offerings that lower procurement friction while improving traceability.
M&A and capability build-outs are concentrating around platforms that connect isolation with downstream analytics and manufacturing readiness. Merck KGaA's June 2026 agreement to acquire Bio-Techne (about USD 11.3 billion) highlights the value placed on adjacent tools for cell therapy production and quality control, which can pull through validated isolation reagents and instruments into standardized workflows. Service providers are also expanding QC footprints, as Clean Cells acquiring Stem Genomics in June 2026 aims to strengthen its cell therapy quality control capabilities and expand its US presence. On the technology roadmap, 2026 research activity emphasizes label-free and AI-guided microfluidic isolation, including autonomous single-cell handling and faster circulating tumor cell enrichment from whole blood, supporting opportunities for microfluidics and lab-on-chip platforms that reduce sample prep time, shrink reagent use, and fit into space-constrained cleanrooms.
Recent Industry Developments
- July 2026: Bio-Rad Laboratories launched Vericheck ddPCR Kits compatible with its QX700 platform, positioned for biopharma quality control workflows that support cell and gene therapy manufacturing. By tightening analytical QC around critical materials and process monitoring, the launch strengthens Bio-Rad's pull-through into regulated workflows where isolation, characterization, and release testing increasingly sit in one validated chain.
- June 2026: Merck KGaA (Darmstadt, Germany) agreed to acquire Bio-Techne for approximately USD 11.3 billion. The deal expands Merck's access to tools and reagents used in protein characterization and quality control, alongside cell therapy production technologies, raising competitive pressure on integrated suppliers that can bundle isolation consumables with downstream analytics and manufacturing enablers.
- November 2024: Terumo launched a Therapy Innovations unit to integrate its apheresis capabilities with cell therapy solutions. The move supports more end-to-end, clinical-to-manufacturing workflows where upstream collection and enrichment steps influence demand for standardized isolation consumables and instruments across sites.


Research Methodology Framework and Report Scope
Market Definition and Coverage
For this study, the cell isolation market is defined as revenues generated from tools and consumables that help separate targeted cells from mixed biological samples, so downstream testing, research, and therapy work can be done with cleaner cell populations.
Scope exclusions: We exclude upstream sample collection and general lab supplies that are not primarily used for isolating or separating cells.
Segmentation Overview
- By Product
- Consumables
- Reagents & Kits
- Beads (Magnetic, Polymer)
- Disposables (Tubes, Columns, Filters)
- Instruments
- Centrifuges
- Flow Cytometers / FACS
- Magnetic-Activated Cell Separator Systems
- Microfluidic & Acoustic Isolation Systems
- Filtration Platforms
- Consumables
- By Technique
- Density-Gradient Centrifugation
- Magnetic-Activated Cell Separation (MACS)
- Fluorescence-Activated Cell Sorting (FACS)
- Microfluidics & Lab-On-Chip Isolation
- Filtration & Sieving
- Dielectrophoresis & Acoustic Sorting
- By Cell Type
- Human Cells
- Animal Cells
- By Cell Source
- Peripheral Blood
- Bone Marrow
- Cord Blood & Perinatal Tissues
- Tumor Tissue / Solid Tissue Digests
- By End-User
- Research Laboratories & Academic Institutes
- Biotechnology & Biopharmaceutical Companies
- Contract Research & Manufacturing Organizations
- Diagnostic & Reference Laboratories
- Geography
- North America
- United States
- Canada
- Mexico
- Europe
- Germany
- United Kingdom
- France
- Italy
- Spain
- Rest of Europe
- Asia-Pacific
- China
- Japan
- India
- Australia
- South Korea
- Rest of Asia-Pacific
- Middle East & Africa
- GCC
- South Africa
- Rest of Middle East & Africa
- South America
- Brazil
- Argentina
- Rest of South America
- North America
Data Sources, Market Sizing, and Validation
Desk Research
Desk work starts with public science and health references to understand where demand is coming from and how quickly it is shifting. We lean on sources such as the National Institutes of Health for funding direction, the US FDA for therapy and diagnostic activity signals, the CDC for disease burden context, and peer reviewed journals (for example, methods papers on magnetic separation, centrifugation, and microfluidics).
To keep the model tied to real market movement, we also review company filings, investor presentations, product documentation, and credible press coverage around new launches and lab automation adoption. When needed, we use paid subscriptions focused on company financials and intelligence, plus patent databases to sanity check innovation intensity and technique adoption. This desk source list is illustrative only, and many other public references were also used during data collection, validation, and clarification.
Primary Interviews and Surveys
Primary work is used to pressure test the desk assumptions that are hardest to observe directly, like typical consumable pull through per instrument placement and how technique choice changes by sample type. We speak with a mix of instrument and consumable suppliers, distributors, lab managers, and end users across research labs, biopharma, and diagnostics. We then re-check key inputs across APAC, EMEA, and the Americas so the regional splits stay realistic for isolation demand and instrument usage cycles.
Distribution of primary research fieldwork respondents
| Company type | Respondent position | Region |
|---|---|---|
| Top tier: 30% | CXOs: 14% | APAC: 43% |
| Mid tier: 48% | Functional/Unit leaders: 42% | EMEA: 33% |
| Smaller Players: 22% | Managers: 44% | Americas: 24% |
Market-Sizing & Forecasting
Sizing is built using a top-down approach where research and clinical workflow volumes are translated into an addressable demand pool for isolation steps, which is then converted to value using typical pricing levels for consumables and equipment. To keep the totals grounded, results are corroborated with selective bottom-up approximations like sampled ASP x unit volumes for common kits and beads, plus channel checks on instrument placements and replacement cycles.
The model uses a small set of practical inputs that can be traced and updated, such as the split between consumables and instruments, the adoption rate of magnetic separation versus centrifugation and filtration, the mix of human versus animal cell work, and demand signals tied to oncology and cell therapy research intensity. We also track lab automation readiness, average run frequency for routine isolation workflows, and regional research funding momentum because these variables show up in purchasing patterns. For forecasting, scenario analysis is used around funding and clinical translation speed, and then the final trajectory is aligned to what interviewees describe as the most likely adoption pace by region and end user.
Data Validation & Update Cycle
Validation is done by cross checking the final outputs against independent indicators, and then drilling into variances before sign off. If an assumption shifts materially, such as a pricing step change for key consumables or a sudden change in instrument procurement cycles, we reconnect with sources and rerun the impacted blocks.
A multi step internal review is followed so arithmetic checks, unit consistency, and regional share logic are verified, and then the narrative is aligned to the final numbers. The report is refreshed annually, and interim updates are added when major events occur that can move demand or pricing. Right before delivery, we do a last pass to ensure clients receive the latest updated view.
Mordor Intelligence's Cell Isolation Market Sizing Compared With Other Published Estimates
Published market sizes for cell isolation can look far apart even when the topic name sounds the same, because the included revenue streams and pricing logic are not consistent across publishers. Differences often come from whether services are counted, how instruments versus consumables are treated, and which year is used as the main reference point.
The main gap comes from including cell isolation services and factory gate value accounting, where Mordor Intelligence focuses on product revenues across consumables and instruments tied to isolation workflows, and then tests regional splits using adoption and funding signals rather than bundling downstream service revenue. Other estimates may also apply faster ASP escalation for kits and beads, or mix cell isolation with adjacent cell separation categories without clarifying overlaps, which can inflate totals when summed across techniques.
Benchmark comparison
| Source | Market Size | Gaps in Research Methodology |
|---|---|---|
| Mordor Intelligence | USD 15.76 B (2025) | |
| Global Consultancy A | USD 12.10 B (2025) | Uses a lower starting point that appears closer to factory gate counting plus a narrower interpretation of instruments, and the technique mix is simplified, which can understate consumables pull through in research led demand. |
| Regional Consultancy B | USD 5.24 B (2025) | Counts services and product revenues at factory gate values with explicit supply chain exclusions, and the narrower value basis can produce a smaller total than workflow based demand modeling that captures broader end user purchasing. |
The spread in the table is mainly explained by what is counted as in scope and how price and volume are translated from real lab activity into revenue. By keeping inputs tied to observable workflow drivers and then double checking the outputs with practical supplier and user feedback, our estimate stays repeatable and easier to audit when assumptions need to be updated.


Key Questions Answered in the Report
What is the current cell isolation market size?
The cell isolation market size is USD 17.91 billion in 2026 and is projected to reach USD 33.91 billion by 2031.
Which segment is growing fastest in the cell isolation market?
Microfluidic lab-on-chip platforms register the highest technique-level CAGR at 15.58% through 2031.
Why are CROs important to the cell isolation market?
CROs are expanding at a 16.07% CAGR as biopharma sponsors outsource cell-therapy development and need turnkey isolation services.
How is regulation affecting instrument demand?
Upcoming FDA alignment with ISO 13485 and new LDT rules increase validation complexity, driving demand for compliant, automated instruments.
Which region shows the highest growth potential?
Asia-Pacific posts the fastest regional CAGR of 14.21% owing to government incentives, new GMP facilities, and rising clinical-trial activity.
Page last updated on:





