Cell Signaling Market Size and Share
Market Overview
| Study Period | 2020 - 2031 |
|---|---|
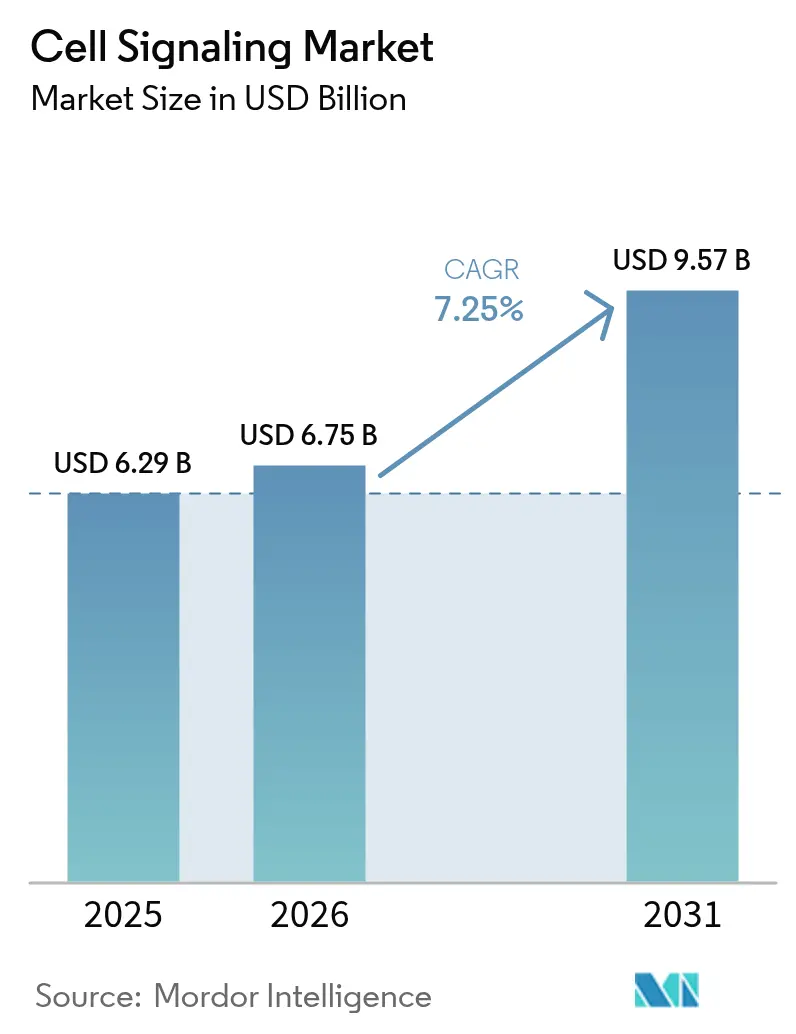
| Market Size (2026) | USD 6.75 Billion |
| Market Size (2031) | USD 9.57 Billion |
| Growth Rate (2026 - 2031) | 7.25% CAGR |
| Fastest Growing Market | Asia-Pacific |
| Largest Market | North America |
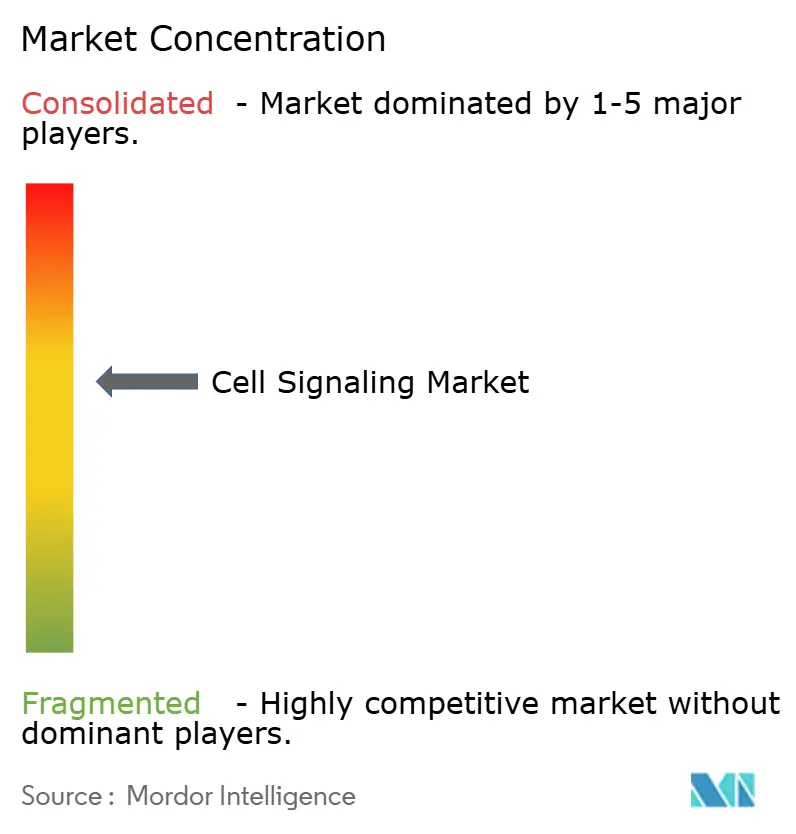
| Market Concentration | Medium |
Major Players *Disclaimer: Major Players sorted in no particular order Image © Mordor Intelligence. Reuse requires attribution under CC BY 4.0. | |
Cell Signaling Market Analysis by Mordor Intelligence
The cell signaling market size was valued at USD 6.29 billion in 2025 and estimated to grow from USD 6.75 billion in 2026 to reach USD 9.57 billion by 2031, at a CAGR of 7.25% during the forecast period (2026-2031). Growth rests on sustained capital spending for automated flow cytometers, mass spectrometers and multiplex imaging systems that generate richer cellular data with fewer manual steps. North America retains leadership on the back of generous National Institutes of Health (NIH) grants and a receptive regulatory climate, while Asia-Pacific posts the fastest gains as Japan, South Korea and China expand single-use bioreactor capacity for clinical-grade cell and gene therapies. Momentum is reinforced by the U.S. Food and Drug Administration’s (FDA) 2024 clearance of Ryoncil, the first allogeneic mesenchymal stromal cell product for steroid-refractory acute graft-versus-host disease, which signals wider acceptance of cell-based interventions. Leading suppliers are sharpening artificial-intelligence modules that cut assay-development cycles and improve reagent selection, thereby raising entry barriers for smaller competitors.
Key Report Takeaways
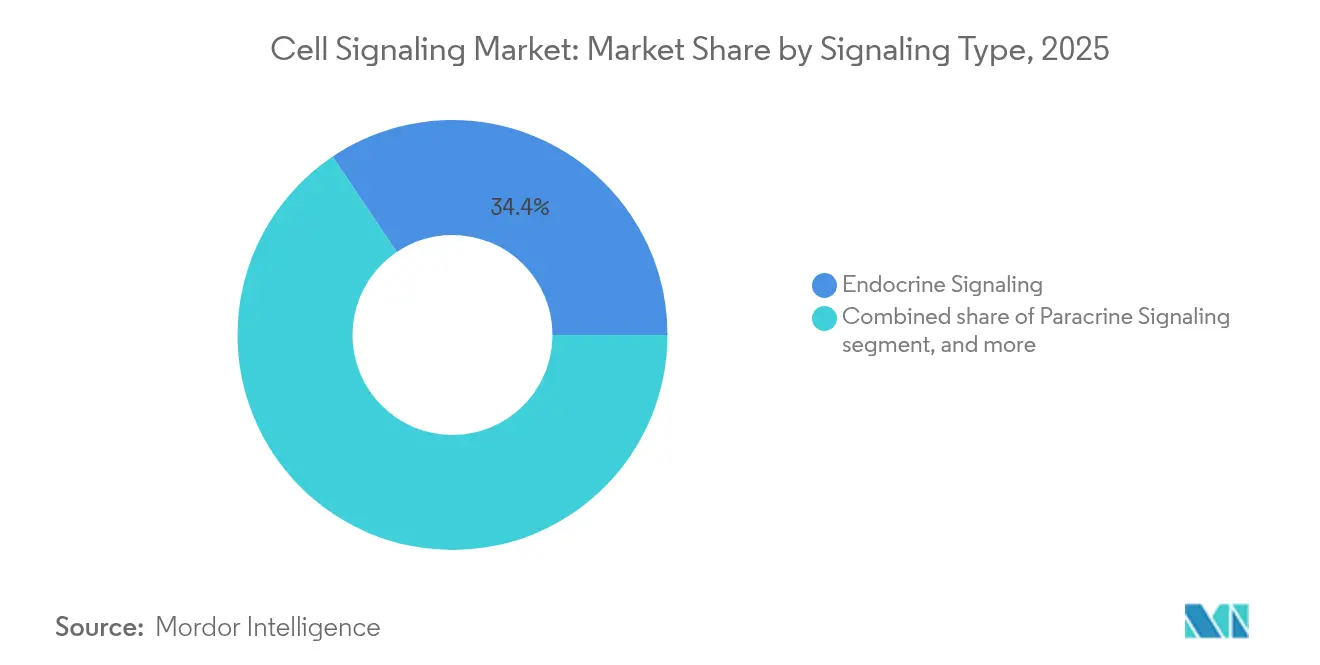
- By signaling type, endocrine signaling led with 34.41% revenue share in 2025, whereas autocrine signaling is projected to expand at a 8.88% CAGR through 2031.
- By product category, instruments accounted for 55.10% of the cell signaling market share in 2025, while consumables are forecast to post a 9.15% CAGR to 2031.
- By technology, flow cytometry captured 45.98% of the cell signaling market size in 2025; western blotting is advancing at a 9.55% CAGR through 2031.
- By pathway, the AKT/PI3K cascade held 22.18% of 2025 revenue, whereas AMPK signaling records the quickest 10.64% CAGR over the forecast window.
- By application, drug discovery and development commanded 34.12% of the cell signaling market in 2025; cancer and stem-cell research is pacing at a 10.15% CAGR.
- By end user, pharmaceutical and biotech companies generated 45.02% of demand in 2025, while contract research organizations (CROs) show the strongest 11.85% CAGR outlook.
- By geography, North America dominated with 42.02% revenue share in 2025; Asia-Pacific leads growth at an 8.12% CAGR through 2031.
Note: Market size and forecast figures in this report are generated using Mordor Intelligence’s proprietary estimation framework, updated with the latest available data and insights as of 2026.
Global Cell Signaling Market Trends and Insights
Driver Impact Analysis*
| Driver | % Impact on CAGR Forecast | Geographic Relevance | Impact Timeline |
|---|---|---|---|
| Growing Prevalence Of Chronic And Autoimmune Diseases | +0.8% | Global | Long term (≥ 4 years) |
| Expanding Funding For Cell-Based Life Science Research | +0.7% | North America & Europe | Medium term (2-4 years) |
| Continuous Technological Innovations In Cell Analysis Platforms | +0.9% | Global | Short term (≤ 2 years) |
| Increasing Adoption Of Artificial Intelligence In Bioassay Design | +0.5% | North America | Medium term (2-4 years) |
| Emergence Of Three-Dimensional Microfluidic Cell Culture Models | +0.6% | Europe & Asia-Pacific | Long term (≥ 4 years) |
| Rapid Scale-Up Of Cell Therapy Manufacturing Workflows | +0.5% | Asia-Pacific | Short term (≤ 2 years) |
| Source: Mordor Intelligence | |||
Growing Prevalence of Chronic and Autoimmune Diseases
The rising incidence of chronic and autoimmune disorders is redirecting capital toward modular lipid-nanoparticle platforms that generate CAR-T cells in vivo, eliminating lengthy ex-vivo manufacturing. Mesenchymal stromal cell (MSC) transplantation continues to produce compelling remission rates across rheumatoid arthritis and systemic sclerosis, fueling wider payer acceptance. As aging populations swell in high-income economies, regenerative medicine trials targeting joint degeneration and metabolic syndrome further accelerate demand for advanced pathway analyses and functional-immune readouts.
Expanding Funding for Cell-Based Life-Science Research
Thermo Fisher Scientific is investing USD 2 billion over four years—USD 500 million earmarked for R&D—to anchor U.S. production of high-impact analytical systems, a move mirroring similar manufacturing onshoring initiatives by rivals. In parallel, Orionis Biosciences secured USD 105 million upfront from Genentech for molecular-glue programs, underscoring venture appetite for next-generation modality platforms. Across Asia-Pacific, sovereign wealth funds have started funneling capital into cell-therapy process-development hubs, compressing technology-transfer timelines for local biologics manufacturers.
Continuous Technological Innovations in Cell-Analysis Platforms
BD’s FACSDiscover A8 marries spectral flow cytometry with high-speed imaging, letting scientists interrogate more than 50 cellular attributes in one run. Beckman Coulter’s Mosaic module pushes spectral detection to 88 channels, while Thermo Fisher’s Orbitrap Astral Zoom increases mass-spectrometry throughput six-fold. The common thread is tighter integration between optical, mass-analytic and informatics stacks, reducing sample-to-result cycles and widening possible biomarker panels.
Increasing Adoption of Artificial Intelligence in Assay Design
Large-language-model algorithms are now embedded in primer-design portals that predict off-target binding and optimize GC content in minutes, freeing researchers from iterative wet-lab validation. Machine-learning classifiers trained on public phospho-proteomics datasets deliver pathway-activation maps that inform drug-screen hit prioritization. Companies pairing such tools with automated liquid handlers report double-digit reductions in reagent waste and faster lot-release decisions for critical antibodies.
Restraints Impact Analysis*
| Restraint | % Impact on CAGR Forecast | Geographic Relevance | Impact Timeline |
|---|---|---|---|
| High Capital Investment Required For Advanced Cell Signaling Systems | -0.4% | Global | Short term (≤ 2 years) |
| Ethical And Regulatory Concerns Surrounding Stem Cell Research | -0.3% | Europe & North America | Long term (≥ 4 years) |
| Inconsistent Quality Of Critical Reagents And Antibodies | -0.3% | Asia-Pacific & Latin America | Medium term (2-4 years) |
| Big-Data Management Challenges In Single-Cell Omics Workflows | -0.2% | Global | Short term (≤ 2 years) |
| Source: Mordor Intelligence | |||
High Capital Investment Required for Advanced Cell-Signaling Systems
Turn-key spectral cytometers exceed USD 750,000 per unit, stretching academic grant cycles and delaying upgrades in lower-income regions. Therapeutic-grade monoclonal antibody production still costs between USD 15,000 and USD 140,000 annually for a single indication, which inflates downstream consumable budgets. Contract manufacturing organizations report sub-50% utilization rates, revealing a supply–demand mismatch that exacerbates cost-recovery challenges for platform owners.
Ethical and Regulatory Concerns Surrounding Stem-Cell Research
Utah and Florida statutes allowing certain unapproved stem-cell therapies dilute federal oversight and introduce multi-jurisdictional compliance hurdles. The FDA’s draft guidance on allogeneic-cell safety testing tightens donor-screening, viral-inactivation and tumorigenicity-assessment requirements, adding time and cost burdens to development programs. European directives remain more restrictive, which can slow multicenter trial initiation and cross-border sample movement for sponsored studies.
*Our forecasts treat driver/restraint impacts as directional, not additive. The impact forecasts reflect baseline growth, mix effects, and variable interactions.
Segment Analysis
By Signaling Type: Endocrine Pathways Drive Systemic Research
Endocrine signaling held 34.41% of the cell signaling market in 2025, underpinning metabolic and reproductive studies that require hormone-receptor assays at organ scale. Autocrine signaling is on track for the fastest 8.88% CAGR because oncology programs increasingly dissect self-stimulating loops that govern tumor proliferation. Paracrine signaling retains relevance for tissue-repair models, while synaptic mechanisms benefit from higher neuroscience funding.
Growing mechanistic clarity around autocrine feedback has spurred design of pathway-selective inhibitors and companion diagnostics. Paracrine insights have inspired nanoparticle carriers programmed to home lymph-node chemokine gradients, an approach now in mid-phase breast-cancer trials. Together, these advances keep the cell signaling market firmly focused on translating pathway biology into precision therapeutics.


By Product: Instruments Lead Despite Consumables Growth
Instruments accounted for 55.10% of 2025 revenue, reflecting the hefty ticket price of analytical workstations that constitute the core lab infrastructure. Consumables, however, are poised to outpace with a 9.15% CAGR as recurring reagent orders scale with assay volume. Flow-cytometry skids, high-resolution imaging chips and microfluidic cartridges dominate replacement cycles, especially in decentralized CRO facilities.
Consumables demand also rises because recombinant antibodies outperform conventional polyclonal reagents on specificity, trimming reproducibility failures that previously cost U.S. labs up to USD 1.8 billion annually. Suppliers offering antibody-validation data sets gain customer stickiness and incremental margins.
By Technology: Flow-Cytometry Dominance Amid Western-Blotting Surge
Flow cytometry retained 45.98% of the cell signaling market share in 2025 on the strength of multiplexed phenotyping and cell-sorting flexibility. Western blotting, rejuvenated by parallel-reaction-monitoring mass-spectrometry readouts, is rising at a 9.55% CAGR as labs pivot to quantitative proteomics. Small-particle detection down to 70 nm now blurs the line between cytometry and nanoparticle analytics, unlocking exosome-tracking workflows.
Integrated imagers and spectral optics let users visualize morphology while gating complex cell populations, a duality that unlocks new immuno-oncology endpoints. Meanwhile, ELISA remains the economical option for batch cytokine quantification in high-throughput screens.
By Pathway: AKT/PI3K Leadership Reflects Cancer Focus
The AKT/PI3K axis held 22.18% revenue in 2025, cemented by its frequent dysregulation in breast, prostate and endometrial cancers. AMPK signaling carries the fastest 10.64% CAGR thanks to mounting evidence of its role in metabolic reprogramming and age-related immune decline. Covalent-allosteric AKT inhibitors tailored to the E17K mutation demonstrate fewer glycemic-side effects, validating isoform selectivity strategies.
Natural‐product libraries that activate AMPK showcase multi-target potential against insulin resistance, encouraging botanical-extract suppliers to seek Investigational New Drug (IND) pathways.
By Application: Drug Discovery Leads Amid Cancer-Research Acceleration
Drug discovery captured 34.12% of the cell signaling market size in 2025, aligned with pharma’s priority to de-risk targets early in the pipeline. Cancer and stem-cell research is climbing quickest at 10.15% CAGR, fueled by next-generation checkpoint modulators and microenvironment-on-a-chip screens that better mimic tumor physiology.
AI-guided phenotypic screens accelerate lead identification, with Bayer and Recursion Pharmaceuticals pursuing up to seven oncology programs under a USD 1.5 billion milestone framework. In parallel, molecular-glue degraders licensed by Degron Therapeutics to Takeda illustrate how novel chemistries reshape targeted-protein-degradation strategies.

By End User: Pharma Dominance Amid CRO Expansion
Pharma and biotech companies generated 45.02% of 2025 sales, leveraging in-house pathway assays to validate biomarkers before clinical entry. CROs exhibit the strongest 11.85% CAGR as cell-therapy firms outsource analytics to scale faster. The U.S. cell-therapy space, valued at USD 2.88 billion in 2023 and projected to hit USD 19.67 billion by 2033, exemplifies the workload CROs now absorb.
Academic centers continue to supply seminal discoveries, such as sub-cellular “wearable” neuro-modulators that monitor interface currents in demyelinating diseases. These innovations often spin out into start-ups that further enlarge the CRO client base.
Geography Analysis
North America generated 42.02% of global revenue in 2025, underpinned by NIH grant stability, venture capital depth and FDA guidance that shortens regulatory review for regenerative candidates. Thermo Fisher’s multi-year USD 2 billion domestic build-out underscores supplier confidence in continued demand for high-throughput instrumentation. State-level legislation permitting certain unapproved stem-cell interventions introduces compliance fragmentation that large sponsors must now navigate.
Asia-Pacific leads growth at a 8.12% CAGR through 2031 as governments expand bioprocess tax incentives and roll out accelerated approval pathways for rare-disease therapies. China alone has compiled single-cell-omics atlases covering 120 million cells, offering unparalleled annotation depth for AI-training datasets. Japan’s Pharmaceuticals and Medical Devices Agency (PMDA) continues to refine its Sakigake fast-track to keep pace with U.S. breakthrough designation metrics.
Europe holds material share yet lags on speed: stringent cell-therapy directives extend trial-setup timelines, though they bolster supply-chain transparency. The region’s active-pharmaceutical-ingredient (API) market is climbing 5.78% annually, with synthetic APIs largest today and biotech APIs growing fastest. Oncology remains Europe’s most dynamic indication as hospitals integrate companion diagnostics into standard-of-care pathways.


Competitive Landscape
Industry concentration is moderate, with the top five vendors controlling roughly 55% of 2024 revenue. Thermo Fisher Scientific, Danaher’s Beckman Coulter unit and BD dominate instrument platforms, while Bio-Rad occupies niche leadership in digital PCR reagents. Thermo Fisher’s USD 4.1 billion acquisition of Solventum’s filtration division broadens its upstream bioproduction footprint, signalling an ecosystem move toward end-to-end workflow ownership.
Technology cycles are compressing: BD delivered spectral-imaging cytometers barely 15 months after its last flagship sorter, compelling rivals to accelerate roadmaps. Cytek Biosciences’ 70 nm particle-detection upgrade extends cytometry into exosome analytics, a frontier where larger incumbents have limited playbooks. Partnerships such as Cell Signaling Technology’s diagnostic tie-up with AmoyDx demonstrate the pivot toward companion-diagnostic co-development that de-risks drug-launch timelines.
White-space competition emerges in AI-driven assay-design suites. Vendors integrating transformer-based single-cell transcriptional models within instrument firmware promise one-button experiment setup, a differentiator likely to upend traditional reagent-subscription models.
Cell Signaling Industry Leaders
Bio-Rad Laboratories Inc.
Cell Signaling Technology Inc.
PerkinElmer Inc.
Becton, Dickinson and Company
Danaher Corporation (Beckman Coulter Inc.)
- *Disclaimer: Major Players sorted in no particular order

Recent Industry Developments
- June 2025: Thermo Fisher launched Orbitrap Astral Zoom and Excedion Pro mass-spectrometers, boosting omics throughput and sensitivity for biopharma workflows.
- May 2025: Orionis Biosciences secured USD 105 million upfront from Genentech for AI-guided molecular-glue discovery with potential milestones exceeding USD 2 billion.
- May 2025: BD debuted the FACSDiscover A8 analyzer, pairing spectral optics with real-time imaging across 50+ parameters per cell.
- April 2025: Thermo Fisher announced a USD 2 billion U.S. capacity expansion, splitting USD 1.5 billion toward capital projects and USD 500 million toward R&D.
- March 2025: Beckman Coulter Life Sciences introduced the CytoFLEX Mosaic spectral module, raising detection to 88 channels and enabling 80 nm nanoparticle visibility.


Research Methodology Framework and Report Scope
Market Definitions and Key Coverage
Our team defines the cell signaling market as the total revenue generated from instruments (flow cytometers, mass spectrometers, western-blot imagers, ELISA readers, and related devices) and consumables (assay kits, reagents, antibodies, sera, and media) that detect, quantify, or modulate intra- or inter-cellular signal transduction across research, diagnostic, and drug-discovery workflows. Coverage spans human, animal, and microbial studies carried out by academic institutes, pharmaceutical and biotech firms, and contract research organizations.
Scope Exclusion: Stand-alone bioinformatics software and general cell-culture consumables not purpose-built for signaling assays are excluded.
Segmentation Overview
- By Signaling Type
- Endocrine Signaling
- Paracrine Signaling
- Autocrine Signaling
- Synaptic Signaling
- Juxtacrine / Gap-Junction Signaling
- By Product
- Instruments
- Flow Cytometers
- Mass Spectrometers
- Western-Blot Imaging Systems
- ELISA Readers
- Other Instruments
- Consumables
- Reagents & Kits
- Antibodies
- Media & Sera
- Other Consumables
- Instruments
- By Technology
- Flow Cytometry
- Mass Spectrometry
- Western Blotting
- ELISA
- Other Technologies
- By Pathway
- AKT / PI3K Signaling
- AMPK Signaling
- ErbB / HER Signaling
- Other Pathways
- By Application
- Drug Discovery & Development
- Cancer & Stem-Cell Research
- Immunology Research
- Diagnostics
- Other Applications
- By End User
- Pharma & Biotech Companies
- Academic & Research Institutes
- Contract Research Organizations
- Other End Users
- Geography
- North America
- United States
- Canada
- Mexico
- Europe
- Germany
- United Kingdom
- France
- Italy
- Spain
- Rest of Europe
- Asia-Pacific
- China
- Japan
- India
- Australia
- South Korea
- Rest of Asia-Pacific
- Middle East & Africa
- GCC
- South Africa
- Rest of Middle East & Africa
- South America
- Brazil
- Argentina
- Rest of South America
- GCC
- North America
Detailed Research Methodology and Data Validation
Primary Research
Our analysts held structured interviews and surveys with lab directors, reagent distributors, CRO procurement heads, and principal investigators across North America, Europe, and Asia. These discussions clarified typical kit throughput, discounting patterns, and technology adoption timelines, filling gaps left by secondary data and anchoring model assumptions.
Desk Research
We began by mapping public benchmarks from sources such as the National Institutes of Health funding database, the World Bank health R&D tables, the European Molecular Biology Laboratory publication portal, HS-code customs records, and peer-reviewed PubMed articles that quantify assay adoption. Annual reports and 10-Ks of major instrument vendors, investor presentations of reagent specialists, and press releases from AACR and ASCB provided shipment clues. To refine company granularity, analysts mined D&B Hoovers and screened Dow Jones Factiva for contract awards and channel inventories. This grounding, combined with access to selected Mordor Intelligence paid datasets, builds a disciplined starting point. The list above is illustrative; many additional sources were consulted during collection and validation.
Market-Sizing & Forecasting
We apply a top-down build that allocates global biomedical R&D outlays to signaling assays using production and trade data, and we then cross-check results with bottom-up snapshots such as sampled average selling price multiplied by verified instrument placements. Key variables include NIH and Horizon Europe grant flows, oncology clinical-trial starts, instrument replacement cycles, consumable pull-through ratios, and average reagent shelf-life. Forecasts employ multivariate regression and scenario analysis, with elasticities informed by primary research. Gaps in bottom-up rolls are bridged with analog benchmarks from adjacent assay categories.
Data Validation & Update Cycle
Outputs pass analyst, senior peer, and research manager reviews. Variance exceeding five percent versus external indicators triggers re-contact of sources. Models refresh annually, with interim updates after material events. Before release, an analyst performs a fresh pass so clients receive the latest view.
Why Mordor's Cell Signaling Market Baseline Commands Confidence
Published estimates often diverge because firms select different product baskets, reference years, and currency treatments, and we disclose our boundary choices so buyers understand exactly what our number captures. Key gap drivers include omission of high-value flow cytometry systems, use of frozen exchange rates, and limited primary validation seen elsewhere, all of which Mordor's wider scope and annual refresh avoid.
Benchmark comparison
| Market Size | Anonymized source | Primary gap driver |
|---|---|---|
| USD 6.29 B (2025) | Mordor Intelligence | |
| USD 5.41 B (2023) | Global Consultancy A | Older base year and narrower geography |
| USD 5.62 B (2024) | Industry Intelligence B | Excludes instruments above USD 50 k price band |
| USD 6.57 B (2025) | Regional Consultancy C | Fixed 2022 exchange rates and limited primary checks |
The comparison shows that while figures vary, Mordor's transparent scope, twin-track modeling, and frequent updates deliver a dependable baseline for decision-makers.


Key Questions Answered in the Report
What is the projected value of the cell signaling market by 2031?
The cell signaling market is forecast to reach USD 9.57 billion by 2031.
Which region is growing fastest in the cell signaling market?
Asia-Pacific is projected to grow at a 8.12% CAGR through 2031 as China, Japan and South Korea ramp up cell-therapy infrastructure.
Which technology currently leads the cell signaling market?
Flow cytometry leads with 45.98% market share due to its ability to profile multiple cellular markers simultaneously.
Why are contract research organizations important to the cell signaling market?
CROs provide specialized analytical and manufacturing services, supporting cell-therapy firms that lack in-house capacity and driving the fastest 11.85% CAGR among end users.
What are the main restraints on cell signaling market growth?
High capital costs for advanced instruments and evolving ethical-regulatory requirements around stem-cell research are the key constraints identified.
Page last updated on:


