
Flow Computer Oil Gas Market Size and Share
Market Overview
| Study Period | 2020 - 2031 |
|---|---|
| Market Size (2026) | USD 1.28 Billion |
| Market Size (2031) | USD 1.81 Billion |
| Growth Rate (2026 - 2031) | 7.24 % |
| Fastest Growing Market | Asia Pacific |
| Largest Market | North America |
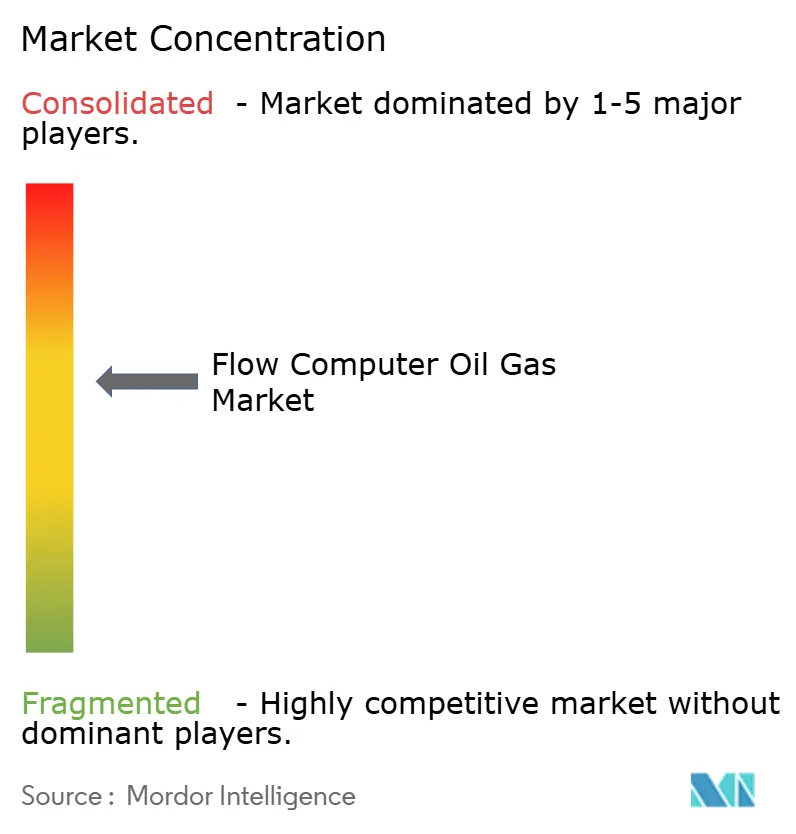
| Market Concentration | Medium |
Major Players *Disclaimer: Major Players sorted in no particular order Image © Mordor Intelligence. Reuse requires attribution under CC BY 4.0. | |
Flow Computer Oil Gas Market Analysis by Mordor Intelligence
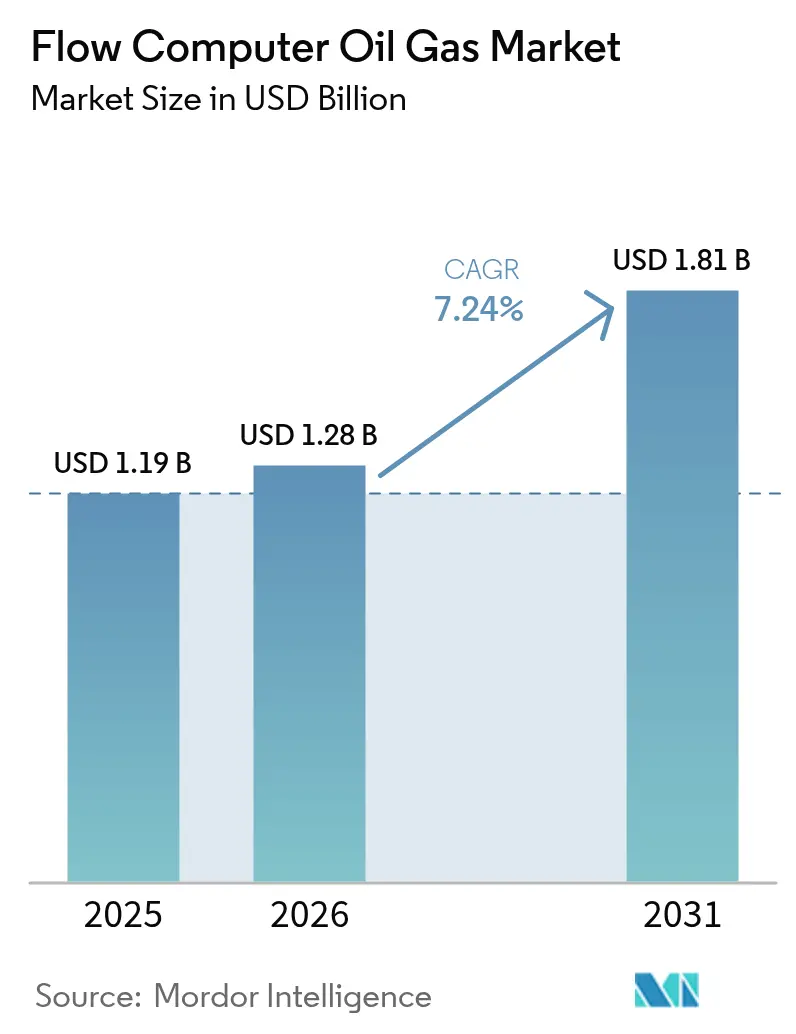
The flow computer oil gas market size was valued at USD 1.19 billion in 2025 and estimated to grow from USD 1.28 billion in 2026 to reach USD 1.81 billion by 2031, at a CAGR of 7.24% during the forecast period (2026-2031). Growth is underpinned by stricter net-zero and flare-reduction mandates, rapid adoption of AI-enabled leak-detection analytics, and wider deployment of edge-ready IIoT architectures that slash operating costs while boosting measurement accuracy. Hardware remains the backbone of the market because custody-transfer applications still demand Coriolis and ultrasonic technologies certified to stringent API standards. At the same time, Software-as-a-Service solutions are scaling quickly as operators pivot toward subscription models for advanced analytics and regulatory reporting. Regionally, North America commands the largest revenue share owing to its shale production base and rigorous methane regulations, whereas Asia-Pacific posts the fastest expansion on the back of LNG capacity additions and accelerating digital-transformation initiatives. [1]Environmental Protection Agency, “40 CFR Part 60 Subpart OOOOb,” ecfr.gov
Key Report Takeaways
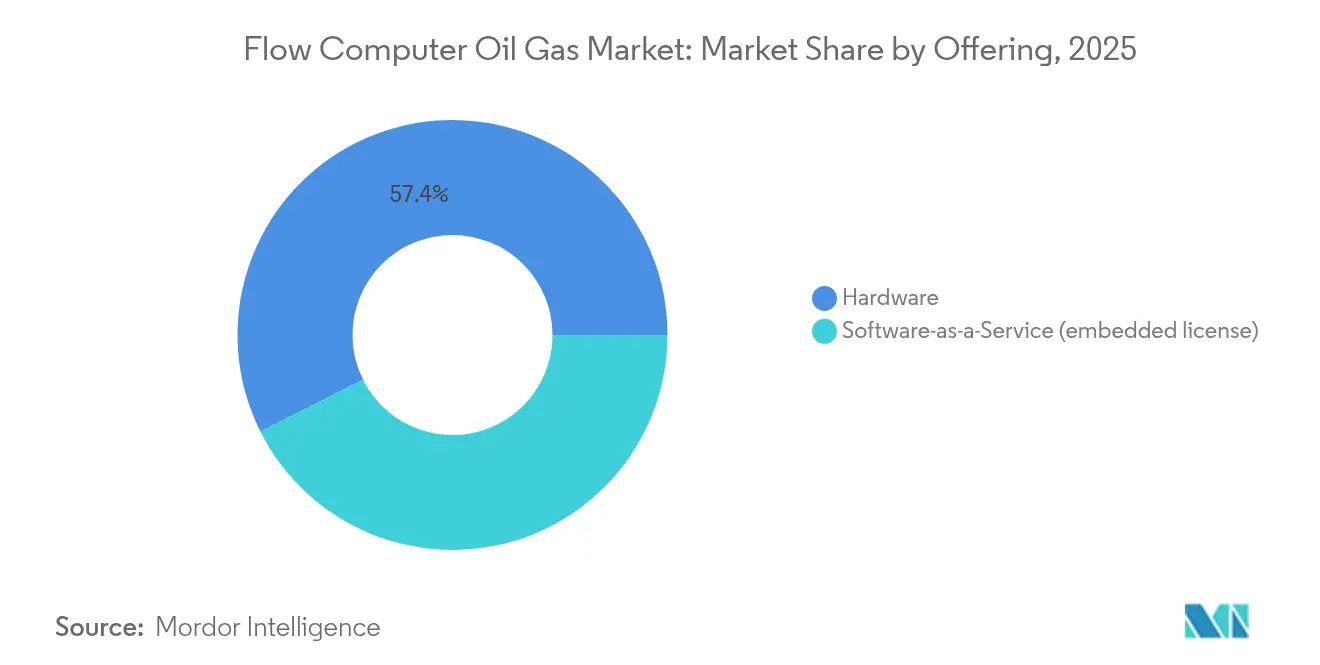
- By offering, hardware components led with 57.40% of the flow computer oil gas market share in 2025, while SaaS posted the highest 9.96% CAGR outlook through 2031.
- By measurement principle, Coriolis technology held 33.40% of the flow computer oil gas market size in 2025; ultrasonic systems are set to grow at a 9.21% CAGR to 2031.
- By application, midstream custody transfer accounted for 39.10% of revenue in 2025; LNG and FLNG operations are projected to rise at an 11.08% CAGR through 2031.
- By deployment environment, onshore sites made up 62.35% of 2025 revenue, but offshore assets are forecast to expand at an 8.31% CAGR to 2031.
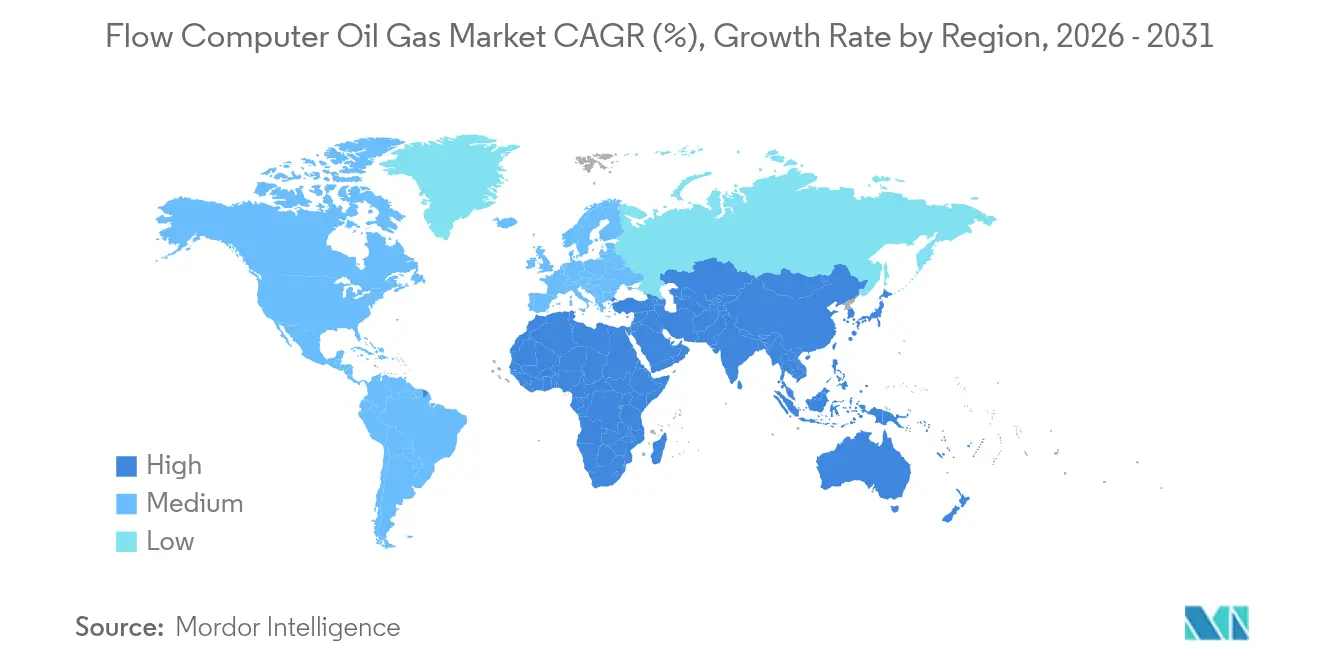
- By region, North America dominated with 40.60% revenue share in 2025, whereas Asia-Pacific is anticipated to post a 9.34% CAGR to 2031.
Note: Market size and forecast figures in this report are generated using Mordor Intelligence’s proprietary estimation framework, updated with the latest available data and insights as of 2026.
Market Trends and Insights
Drivers Impact Analysis of Flow Computer Oil Gas Market*
| Driver | (~) % Impact on CAGR Forecast | Geographic Relevance | Impact Timeline |
|---|---|---|---|
| Growing need for reliable flow & high-speed computing | 1.80% | Global, with concentration in North America & APAC | Medium term (2-4 years) |
| Integration of AI-enabled leak-detection analytics | 1.50% | North America & EU, expanding to APAC | Short term (≤ 2 years) |
| Shift to net-zero & flare-reduction mandates | 1.20% | Global, led by North America & Europe | Long term (≥ 4 years) |
| Edge-ready IIoT architecture lowers OPEX | 1.00% | APAC core, spill-over to MEA | Medium term (2-4 years) |
| Adoption of dual-meter ultrasonic custody transfer | 0.80% | North America & Middle East | Medium term (2-4 years) |
| Rise of LNG floating production & custody units | 0.70% | Global, concentrated in APAC & Africa | Long term (≥ 4 years) |
| Source: Mordor Intelligence | |||
Growing need for reliable flow & high-speed computing
Real-time optimization pressures have intensified, compelling operators to process data from far more sensors while maintaining ±0.1% accuracy for custody transfer. Advanced Coriolis and ultrasonic meters now handle multiphase streams without separation, and edge computing platforms cut time-to-insight from 48 hours to under 2 hours through automated analytics [onepetro.org]. Machine-learning models embedded at the wellhead underpin predictive maintenance, a vital capability for unconventional shale wells whose flow profiles change quickly [krohne.com]. Ruggedized designs ensure continuous operation in remote fields, bridging the gap between high computational demand and harsh environmental conditions. [2]Jason Pitcher & Mike Pry, “Applying Edge Computing to Autonomous Well Control,” onepetro.org
Integration of AI-enabled leak-detection analytics
AI-powered algorithms identify anomalous flow signatures within minutes, curbing methane losses and automating regulatory documentation. Systems certified for offshore use reach detection thresholds below 10 ppm and can trigger immediate shutdown or vent isolation, eliminating quarterly manual inspection lag. EPA methane rules effective 2024 turbo-charge adoption, as compliance now hinges on real-time leak verification. Edge-deployed neural networks mitigate false positives, while solar-powered sensors extend coverage to unmanned facilities. [3]Hazem Ramzey et al., “I2OT-EC: A Framework for Smart Real-Time Monitoring,” mdpi.com
Shift to net-zero & flare-reduction mandates
BLM regulations now drive capture targets from 85% to 98% over the next decade, forcing operators to track flare volumes with unprecedented precision. Super-majors pledging net-zero by 2050 need flow computers that interface with carbon capture systems and validate stored CO₂ volumes. Updated API MPMS 14.10 standards tighten calibration requirements, raising the bar on flow-computer performance. The convergence of environmental and financial incentives is accelerating the switch to digital, high-accuracy meters that underpin verifiable emissions accounting.
Edge-ready IIoT architecture lowers OPEX
By processing data locally, edge-enabled flow computers minimize satellite-bandwidth fees and maintain resilience during communications outages. Field trials show autonomous nodes operating for weeks without central connectivity while sustaining full custody-transfer accuracy Modular deployments let producers scale measurement capacity incrementally rather than incur large upfront CAPEX. Embedded analytics have cut unscheduled maintenance visits by double-digit percentages in remote Australian gas fields, directly reducing operating overhead.
Restraints Impact Analysis of Flow Computer Oil Gas Market*
| Restraint | (~) % Impact on CAGR Forecast | Geographic Relevance | Impact Timeline |
|---|---|---|---|
| Cyber-security vulnerabilities in legacy SCADA | -1.20% | Global, particularly North America & Europe | Short term (≤ 2 years) |
| Volatility of upstream CAPEX with oil-price swings | -0.90% | Global, concentrated in North America & Middle East | Medium term (2-4 years) |
| Shortage of metrology talent for API compliance | -0.70% | North America & Europe, emerging in APAC | Long term (≥ 4 years) |
| Slow retrofit cycles in mature onshore fields | -0.50% | North America & Europe | Long term (≥ 4 years) |
| Source: Mordor Intelligence | |||
Cyber-security vulnerabilities in legacy SCADA
Aging SCADA architectures built before modern threat models suffer from unpatched firmware, flat network topologies, and clear-text protocols that expose critical measurement data to malicious actors. Successful ransomware incidents have forced temporary shutdowns, spurring operators to delay new flow-computer rollouts until segmented, zero-trust architectures are in place. Compliance with emerging IEC 62443 guidelines drives higher implementation costs, lengthening project timelines and tempering market growth.
Volatility of upstream CAPEX with oil-price swings
Oil-price downturns routinely trigger spending freezes on measurement upgrades even though precise metering would enhance profitability. Vendors face lumpy order books, complicating production planning and stretching lead times during recovery phases. Operators extend the lifespan of legacy devices beyond optimal cycles, raising the risk of measurement drift and non-compliance. The boom-bust dynamic thus dampens steady investment in next-generation flow computers.
*Our forecasts treat driver/restraint impacts as directional, not additive. The impact forecasts reflect baseline growth, mix effects, and variable interactions.
Flow Computer Oil Gas Market Segment Analysis
By Offering:
Hardware Dominance Drives Market FoundationHardware captured 57.40% of 2025 revenue as custody-transfer contracts still stipulate certified measurement devices. Mass-flow Coriolis meters, ultrasonic transit-time systems, and differential-pressure transmitters anchor legal metrology, meeting API and ISO accuracy targets better than software-only solutions. Hardware-centric deployments remain the default in midstream pipelines and LNG offloading, where contractual exposure is greatest. Conversely, SaaS platforms are registering a 9.96% CAGR, aided by subscription pricing that shifts spend from CAPEX to OPEX while unlocking cloud-based analytics. Embedded-license software straddles both worlds, bundling onboard processing with cyber-secure cloud routines for regulatory reporting. As AI models migrate toward the edge, hardware and software boundaries blur, prompting integrators to release unified packages that couple ruggedized electronics with continuously updated analytics engines.
Growing SaaS penetration does not erode the centrality of certified devices. Instead, operators deploy SaaS dashboards atop existing meters to augment performance diagnostics and automate compliance filings. The flow computer oil gas market therefore advances on twin tracks: hardware remains indispensable for custody accuracy, while SaaS scales data-driven insights enterprise-wide.



By Measurement Principle:
Coriolis Leadership Faces Ultrasonic ChallengeCoriolis commanded a 33.40% share of the flow computer oil gas market size in 2025 as its direct mass-flow reading is immune to pressure and temperature swings. High-density shale condensate and multiphase streams intensify demand for Coriolis meters that retain ±0.1% accuracy without phase separation. Yet ultrasonic technology is encroaching fast with a 9.21% CAGR. Dual-meter ultrasonic packages enable redundancy that supersedes prover checks, cutting maintenance and sustaining accuracy in wet-gas pipelines. Clamp-on variants simplify retrofits by eliminating process-side disruption, a decisive advantage in offshore tiebacks where downtime costs escalate.
Differential-pressure meters linger in low-value sites where budget overrides supreme accuracy. Turbine and positive-displacement units still populate legacy installations but continue to cede ground as total-cost-of-ownership calculations favor digital diagnostics and fewer moving parts. With diagnostics now standard, ultrasonic vendors flag early fouling or liquid carry-over, ensuring regulatory targets are met despite dynamic process conditions.
By Application:
Midstream Custody Transfer Sets the Commercial BaselineMidstream pipeline and custody-transfer services generated 39.10% of 2025 revenue, underscoring their central role in contractual settlement and regulatory compliance within the flow computer oil gas market. Strict accuracy thresholds of ±0.1% compel operators to deploy premium flow computers with accredited Coriolis or dual-ultrasonic meters for every fiscal hand-off [ifsolutions.com]. Measured volumes determine royalty, tariff, and tax bills, so even minor drift translates into sizable financial exposure. As LNG and FLNG infrastructure expands, operators are adopting cryogenic-rated meters and smart computers that compensate for temperature swings while streaming encrypted data to enterprise resource-planning systems. Continuous self-validation routines embedded in modern units now cut prover-loop frequency, helping midstream firms curb maintenance budgets without sacrificing accuracy.
LNG and FLNG operations form the fastest-growing niche, posting an 11.08% CAGR through 2031 as Asia-Pacific and Africa commission new liquefaction and regasification assets [offshore-mag.com]. These facilities demand computers capable of handling rapid product changeovers and bidirectional trade flows. Upstream well-pad applications remain a steady source of demand as unconventional plays rely on real-time flowback monitoring to optimize choke settings and artificial-lift schedules. Downstream refineries apply multivariable computers to reconcile unit-balance data with custody meters at rack loading points, tightening loss-control programs. Carbon-capture networks add a fresh layer of opportunity because captured CO₂ streams require verification before tax-credit monetization, pushing computers into an emerging compliance service.
By Connectivity/Protocol:
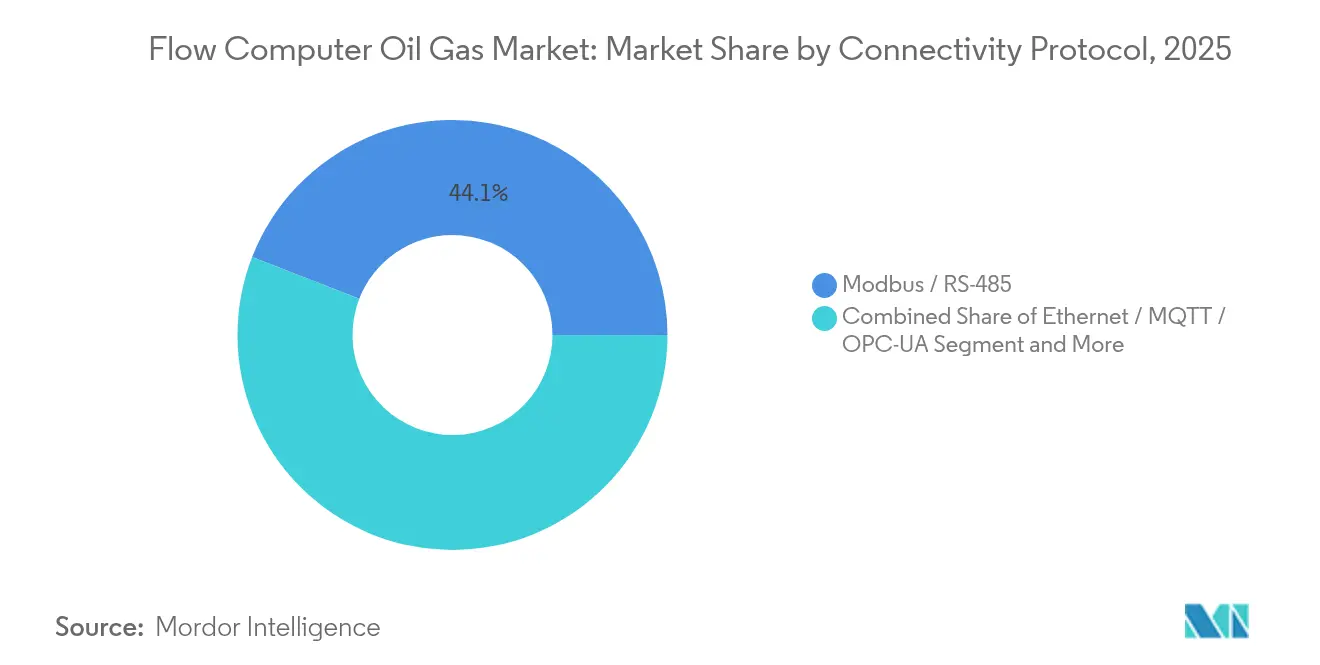
Ethernet and MQTT Propel Digital ConvergenceLegacy Modbus-RTU and RS-485 links still dominate brownfield assets, yet their share declines annually as operators modernize data pipelines to run richer analytics. Newbuild projects specify Ethernet-based OPC-UA or MQTT to stream high-resolution data directly into cloud historians, enabling microsecond-level reconciliation across multiple custody-transfer points. Higher bandwidth supports edge-hosted AI models that detect transients or leaks in real time, replacing daily manual trending. Encryption and certificate-based authentication mitigate cyber-risk while satisfying IEC 62443 guidance, a growing prerequisite for insurance underwriters and regulators.
Wireless ISA-100, Wi-Fi 6, and emerging 5G private networks unlock installation flexibility where trenching cables is unsafe or uneconomic, such as tank farms or temporary flare-measurement skids. Battery-powered transmitters last five years thanks to low-energy silicon and adaptive-sleep firmware, lessening maintenance call-outs. Vendors now bundle dual-network cards—wired plus wireless—so an outage in one bearer does not interrupt custody-quality data streams. As OT-IT convergence accelerates, some operators feed raw flow data straight into SAP or Azure environments for automated invoicing and carbon accounting. The net result is a communication landscape shifting from serial, bandwidth-constrained loops to resilient, high-throughput fabrics that future-proof measurement investments and keep the flow computer oil gas market advancing.
By Deployment Environment:
Onshore Scale Meets Offshore ComplexityOnshore assets retained 62.35% of 2025 sales because surface facilities are easier to access, integrate, and service, especially across prolific shale basins in North America. Mature supply chains, abundant technical labor, and lower installation costs favor high-volume rollouts of standardized flow-computer skids. Edge-ready units with solar back-up and low-power radios now blanket remote pads, cutting field trips by relaying diagnostics to centralized support hubs. Meanwhile, national regulators are stepping up ground-level methane audits, prompting operators to upgrade legacy meters to AI-enabled platforms that auto-generate compliance files for submission to environmental agencies.
Offshore production, including both fixed and floating installations, is climbing at an 8.31% CAGR as deepwater projects in Brazil, Guyana, and West Africa proceed. Space and weight restrictions drive demand for compact, high-MTBF computers that run dual-meter ultrasonic schemes and transmit encrypted data over subsea fiber. Harsh-environment requirements—ATEX, IECEx, and SIL-2/3—elevate switching costs, giving established vendors a competitive moat. Subsea tie-back fields increasingly specify wet-mate connectors and high-pressure housings rated beyond 15,000 psi, allowing flow computers to sit on the seabed for decades without retrieval. Because offshore downtime costs can reach USD 2 million per day, predictive-maintenance analytics embedded in the newest units deliver rapid ROI by flagging sensor drift before it disrupts production.
Geography Analysis
North America Flow Computer Oil Gas Market
North America contributed 40.60% of 2025 revenue, underpinned by prolific shale output and immediate compliance obligations arising from EPA methane rules and BLM flare-capture targets. Operators now integrate AI-enabled flow computers to generate automatic regulatory reports and avoid non-compliance penalties. Despite a robust technology ecosystem, the region faces a widening metrology-skills gap as experienced technicians retire faster than replacements are trained, creating service bottlenecks.
APAC Flow Computer Oil Gas Market
Asia-Pacific is the fastest-growing region at a 9.34% CAGR owing to a wave of LNG terminal start-ups and floating production deployments that necessitate advanced custody-transfer systems. Digital-transformation programs underway in India, China, and Southeast Asia further stimulate demand for edge-ready flow computers, often bundled with predictive-maintenance SaaS to offset scarce on-site expertise. Ambitious CCUS roadmaps add additional measurement requirements, positioning vendors with CO₂-capable flow computers for outsized opportunities.
EMEA Flow Computer Oil Gas Market
Europe and the Middle East exhibit steady, regulation-driven replacement cycles. European operators retrofit assets to satisfy tightening methane-emission directives, favoring integrated measurement-and-analytics solutions that streamline carbon accounting. Middle Eastern NOCs channel investment toward enhanced-oil-recovery and sour-gas processing, necessitating robust flow computers tolerant of H₂S and high CO₂ fractions. Africa remains nascent yet promising, with offshore FPSO projects in Ghana and Namibia calling for compact, high-reliability metering packages despite supply-chain complexity.

Regulatory Landscape
Flow computers used in fiscal, allocation, and custody-transfer services sit under a mix of emissions-performance rules and measurement conformity regimes that shape specification, verification, and auditability requirements. In the United States, EPA oil and natural gas sector performance standards remain a central compliance driver for measurement and documentation systems. The EPA issued a December 2025 action extending certain deadlines, including no identifiable emissions inspection timing, to January 22, 2027, and published an additional final rule in 2026 to adjust aspects of the standards of performance. These rule actions reinforce demand for measurement systems that can support more frequent, traceable reporting and faster anomaly identification across upstream, midstream, and associated equipment.
On the measurement side, custody-transfer implementations commonly align to internationally recognized standards and guidance that define how flow computers perform conversion, diagnostics, and verification. BS EN 12405-3:2015 specifies performance and testing requirements for flow computers as high-accuracy volume conversion devices for fuel gases, while newer European gas-infrastructure standards such as SS-EN 1776:2025 incorporate considerations for changing gas compositions, including hydrogen blends and CO2 handling associated with CCUS measurement use cases. Offshore requirements also tightened operational alignment: BSEE issued a June 2026 final rule covering oil and gas and sulfur operations on the US Outer Continental Shelf, effective August 10, 2026, and incorporated updated production measurement industry standards by reference. As a result, maintaining certified measurement configurations and documented change control across offshore assets has become more important.
Value Chain Analysis
The value chain for oil and gas flow computers spans (1) core electronic components and industrial computing (microcontrollers, I/O, signal conversion), (2) metering sensors and packages (Coriolis, ultrasonic, differential-pressure and associated transmitters), (3) flow computer hardware and embedded software, (4) system integration into PLC/DCS/SCADA and cybersecurity architectures, and (5) commissioning, calibration, verification, and lifecycle services. Global automation majors, including ABB, Honeywell, Emerson, Schneider Electric, and Yokogawa, participate across multiple steps by bundling flow computers with broader control, historian, and reporting stacks. Specialists and integrators also fill gaps in skid engineering, hazardous-area compliance, and site acceptance testing.
Commissioning and compliance services are a consistent bottleneck, particularly for custody-transfer meter runs where calibration and proving readiness can delay start-up. Industry practice has expanded the use of surrogate spool calibration at accredited laboratories to reduce schedule exposure when site-specific meter run spools are not ready, which helps decouple critical-path verification from fabrication and field constraints. On the supply side, 2025-2026 lead-time pressure for semiconductors and specialized instrumentation components has influenced procurement and project sequencing, pushing operators and EPCs toward framework purchasing, inventory strategies, and stronger integrator coordination to keep measurement packages, firmware, and test documentation aligned through delivery and installation.
Competitive Landscape
Competition is moderate, with automation majors using expansive portfolios and global service coverage to erode share from niche specialists. ABB, Schneider Electric, Honeywell, and Emerson embed flow computers within broader DCS and SCADA suites, selling end-to-end platforms rather than stand-alone boxes. Honeywell’s Experion Operations Assistant applies AI to alarm rationalization, whereas Emerson’s cloud-native SCADA allows remote calibration and cyber-secure firmware updates.
M&A remains brisk: Baker Hughes divested its Panametrics brand to Crane Company for USD 1.15 billion, sharpening Baker Hughes’ focus on decarbonization equipment; TechnipFMC exited measurement solutions via a USD 205 million sale to One Equity Partners, and Emerson spun off its Daniel flow-measurement line to Turnspire Capital Partners to emphasize software-rich assets. Smaller firms differentiate through specialty software layers addressing cybersecurity hardening, hydrogen-ready calibrations, or automated compliance paperwork. The flow computer oil gas industry will therefore evolve around integrated platforms, cloud-linked diagnostics, and domain-specific SaaS niches rather than commoditized hardware alone.
Flow Computer Oil Gas Industry Leaders
Emerson Electric Co.
Honeywell International Inc.
ABB Ltd.
Schneider Electric SE
Yokogawa Electric Corporation
- *Disclaimer: Major Players sorted in no particular order
Flow Computer Oil Gas Market Companies Covered in this Report
- ABB Ltd.
- ABB Measurement and Analytics
- Schneider Electric SE
- Honeywell International Inc.
- Emerson Electric Co.
- Yokogawa Electric Corp.
- Baker Hughes Co. (Panametrics)
- Siemens AG
- KROHNE Messtechnik GmbH
- Bedrock Automation Platforms Inc.
- OMNI Flow Computers Inc.
- Dynamic Flow Computers Inc.
- Quorum Business Solutions Inc.
- TechnipFMC PLC (Measurement Solutions)
- Badger Meter Inc.
- Cameron Intl. (Schlumberger) - Scanner
- Spirit IT BV (Flow-X)
- Kepware Technologies
- Brooks Instrument LLC
- ProSoft Technology Inc.

Market Opportunities and Future Outlook
A major whitespace sits at the intersection of stricter emissions-performance oversight and the need for audit-ready, near-real-time measurement data that can be reconciled across SCADA, custody-transfer systems, and environmental reporting workflows. Compliance programs tied to oil and gas air standards, including EPA actions in 2025-2026, increase the value of flow-computer deployments that combine certified measurement, secure data transmission, and automated recordkeeping. This is especially relevant as operators move away from periodic manual checks toward continuous monitoring. Standards and conformity regimes also create upgrade pull-through: custody-transfer frameworks such as API 21.1 (Electronic Gas Measurement) and verification programs such as Measurement Canada S-G-05 elevate the importance of installation practice, reverification readiness, and configuration control. That combination favors vendors and integrators that can supply complete, documented measurement-and-software packages.
Operator roadmaps toward more autonomous operations also open demand for edge-ready flow computers that act as real-time control and analytics nodes rather than passive calculators. In June 2026, SLB launched Intelligent Production Studio to enable an autonomous well pad environment managing real three-phase flow across multiple well streams, which signals continued integration of production equipment, software, and operational intelligence where high-quality flow data is a primary input. In July 2026, Halliburton and Eni demonstrated closed-loop rig automation and managed pressure drilling on a deepwater well offshore Indonesia using Halliburton technology, reinforcing the broader shift toward sensor-informed, closed-loop workflows. This raises requirements for resilient protocols (Ethernet/OPC-UA/MQTT), cybersecurity hardening, and tight integration between measurement, control, and enterprise applications across upstream, midstream, and LNG value chains.
Recent Industry Developments in Flow Computer Oil Gas Market
- July 2026: Emerson launched a new generation of portable ultrasonic flow meters, expanding its non-intrusive measurement portfolio for applications that need rapid deployment and verification. The product refresh supports maintenance and commissioning workflows where temporary metering and validation reduce downtime and strengthen confidence in measurement integrity alongside permanent custody-transfer systems.
- June 2026: Ex-i Flow Measurement unveiled the Sfc3000 flow computer for hydrocarbon and gas measurement, positioning it for global custody-transfer and related measurement use cases. The platform also highlights CO2 emissions monitoring and carbon capture and storage measurement capability, reflecting rising requirements to combine traditional billing-grade measurement with emissions and CCUS accounting.
- January 2025: Emerson introduced the Roxar 5726 Multiphase Transmitter as an integrated enhancement for the Roxar 2600 Multiphase Flow Meter, consolidating previously separate field electronics and flow computer functions. The integration reduces system complexity and installation effort for upstream multiphase measurement while improving data availability for optimization and reporting workflows.


Flow Computer Oil Gas Market Report Scope and Research Methodology
Market Definition and Coverage
This market covers the revenues earned from flow computers used in oil and gas operations to measure, calculate, log, and help control flow measurement for liquids and gases across field and facility settings.
Scope exclusions: We exclude general-purpose PLC/SCADA systems, standalone flow meters sold without flow-computer functionality, and installation-only civil works that are not part of the flow computer supply.
Segments Covered in This Report
- By Offering
- Hardware
- Software-as-a-Service (Embedded License)
- By Measurement Principle
- Coriolis
- Ultrasonic
- Differential-Pressure / Orifice
- Turbine and Positive-Displacement
- By Application
- Upstream Production Well-Pad
- Midstream Pipeline and Custody Transfer
- Downstream Refining and Petrochemical
- LNG Facilities and FLNG Units
- By Deployment Environment
- Onshore
- Offshore (Fixed and Floating)
- By Connectivity / Protocol
- Modbus / RS-485
- Ethernet / MQTT / OPC-UA
- Wireless ISA-100 / Wi-Fi
- By Geography
- North America
- United States
- Canada
- Mexico
- Europe
- United Kingdom
- Germany
- France
- Italy
- Rest of Europe
- Asia-Pacific
- China
- Japan
- India
- South Korea
- Rest of Asia-Pacific
- Middle East
- Israel
- Saudi Arabia
- United Arab Emirates
- Turkey
- Rest of Middle East
- Africa
- South Africa
- Egypt
- Rest of Africa
- South America
- Brazil
- Argentina
- Rest of South America
- North America
Data Sources, Market Sizing, and Validation
Desk Research
Desk work starts by building the operating context for oil and gas measurement demand, and then narrowing it to where flow computers are actually required. We leaned on public energy and production indicators from sources such as the U.S. Energy Information Administration (EIA) and the International Energy Agency, and we also referenced the U.S. Bureau of Labor Statistics for inflation signals that affect electronics and project costs.
To keep the scope aligned to custody transfer and metering practices, we reviewed standards and guidance available from bodies such as API and ISO, and we used safety and environmental publications such as U.S. EPA materials to understand flare reduction and emissions monitoring push factors. Company annual reports, investor presentations, and credible trade press were used to spot product-mix shifts (for example, hardware versus software licensing) and channel movement. Where needed, our analysts also used paid subscriptions for company financials and intelligence, patent databases, and import-export shipment-level data to sanity check supply trends. The specific desk sources listed here are illustrative only, and many other public and subscription sources were also reviewed for collection, cross-checks, and clarification.
Primary Interviews and Surveys
Primary work was used to pressure-test the demand pool and the price logic behind typical deployments, especially across upstream well pads, midstream pipeline and custody transfer, and downstream refining and LNG-type facilities. We spoke with a mix of equipment suppliers, system integrators, EPC-linked stakeholders, and end users to validate adoption timing, replacement cycles, and how software subscriptions are recognized across regions.
Distribution of primary research fieldwork respondents
| Company type | Respondent position | Region |
|---|---|---|
| Top tier: 34% | CXOs: 12% | APAC: 45% |
| Mid tier: 52% | Functional/Unit leaders: 36% | EMEA: 32% |
| Smaller Players: 14% | Managers: 52% | Americas: 23% |
Market-Sizing & Forecasting
Market sizing was built using top-down and bottom-up logic, where production activity and custody transfer intensity were first mapped by region, and then converted into an addressable metering and flow-computer demand pool. In practice, the model starts with oil and gas throughput signals and active infrastructure build, followed by assumptions on where electronic flow computation is typically specified for compliance and measurement accuracy.
To make the model realistic, we used inputs such as upstream and midstream project activity, pipeline and terminal additions, LNG facility expansions, typical replacement and retrofit cycles for measurement skids, and average selling price ranges by offering (hardware and software). A few checks were kept simple but effective, including the split between greenfield and brownfield work, and the pace at which remote monitoring and digital reporting are being added to metering points. Once this top-down view is formed, we corroborate totals with selective bottom-up approximations, such as sampling known shipment and tender signals, applying reasonable ASP times unit volumes for common use cases, and then adjusting for gaps where procurement is bundled through integrators.
For forecasting, we applied scenario analysis supported by expert views on capex cycles, regulatory push for measurement integrity, and the speed of digital upgrades in oil and gas facilities. When inputs conflicted, we kept assumptions conservative and documented the drivers so that the final outputs can be repeated and updated without needing hard-to-access proprietary datasets.
Data Validation & Update Cycle
Validation is done by checking whether modeled values move in line with independent signals such as upstream and midstream activity, project sanction trends, and electronics pricing inflation, and then the outliers are investigated before numbers are finalized. Where variances appear, we re-check unit assumptions, revisit the hardware versus software mix, and re-contact relevant interviewees when a change is large enough to alter the year view.
Each report goes through a multi-step analyst review so that definitions, inputs, and calculations stay consistent across regions and time series. We refresh the model annually, and interim updates are triggered when major oil and gas capex shifts, policy changes, or supply disruptions materially change shipment timing or pricing. Right before delivery, a final pass is performed to ensure the latest currency conversions and key assumptions remain aligned with the current market environment.
Mordor Intelligence's Flow Computer Oil Gas Market Size Versus Other Published Estimates
Published market sizes for flow computers in oil and gas can look far apart, even when the topic sounds identical, because update timing and pricing treatments are not consistent across publishers. Differences also come from what gets counted as flow-computer revenue versus adjacent measurement and automation items, and whether values are stated in current dollars or are effectively anchored to older price points.
The spread typically widens when one estimate uses a single-year currency conversion and a fixed ASP assumption, while another rolls forward prices using inflation and mix shifts between hardware and software. A refresh-led approach also tends to separate project timing effects better, since big midstream and LNG awards can move revenue between years. By re-validating ASP ranges and the hardware versus software share each update cycle, and applying consistent currency timing for the stated year, Mordor Intelligence reduces drift that can build up in multi-year forecasts.
Benchmark comparison
| Source | Market Size | Gaps in Research Methodology |
|---|---|---|
| Mordor Intelligence | USD 1.19 B (2025) | |
| Global Publisher A | USD 0.66 B (2024) | Uses an earlier base year with a tighter revenue perimeter and a shorter forecast window, and it appears to treat pricing and currency at the starting year rather than rolling assumptions forward to the stated year. |
| Industry Publisher B | USD 0.64 B (2023) | Anchors the market on an older base year and may undercount bundled system revenues routed through integrators, which can pull down the total when hardware, software, and service recognition is not normalized. |
Overall, the table shows that timing and scope choices can shift the number more than the growth story itself. Our approach stays traceable because the demand pool, ASP progression, and year-specific currency handling are checked again at each refresh, and then reconciled with real-world oil and gas activity indicators before publication.


Key Questions Answered in the Report
What is the projected value of the flow computer oil gas market by 2031?
The market is forecast to reach USD 1.81 billion by 2031, growing at a 7.24% CAGR.
Which region currently leads the flow computer oil gas market?
North America leads with 40.60% of 2025 revenue due to its expansive shale infrastructure and stringent methane regulations.
Which segment is growing the fastest within the flow computer oil gas market?
SaaS-based offerings are expanding at a 9.96% CAGR as operators shift toward subscription models for analytics and compliance.
Why are ultrasonic flow meters gaining ground on Coriolis technology?
Ultrasonic meters offer non-intrusive installation, lower maintenance, and built-in redundancy, driving a 9.21% CAGR through 2031.
How do AI-enabled flow computers help meet new methane regulations?
They deliver real-time leak detection with sensitivities below 10 ppm and automatically generate compliance reports required by the EPA’s 2024 methane rule.
What is the main cybersecurity challenge facing new flow computer deployments?
Integrating modern devices with legacy SCADA networks that lack zero-trust architecture elevates the risk of ransomware and data breaches, delaying upgrade projects.
Page last updated on:


 Your data is secure and never sold or shared.


