Geomarketing Market Size and Share
Market Overview
| Study Period | 2020 - 2031 |
|---|---|
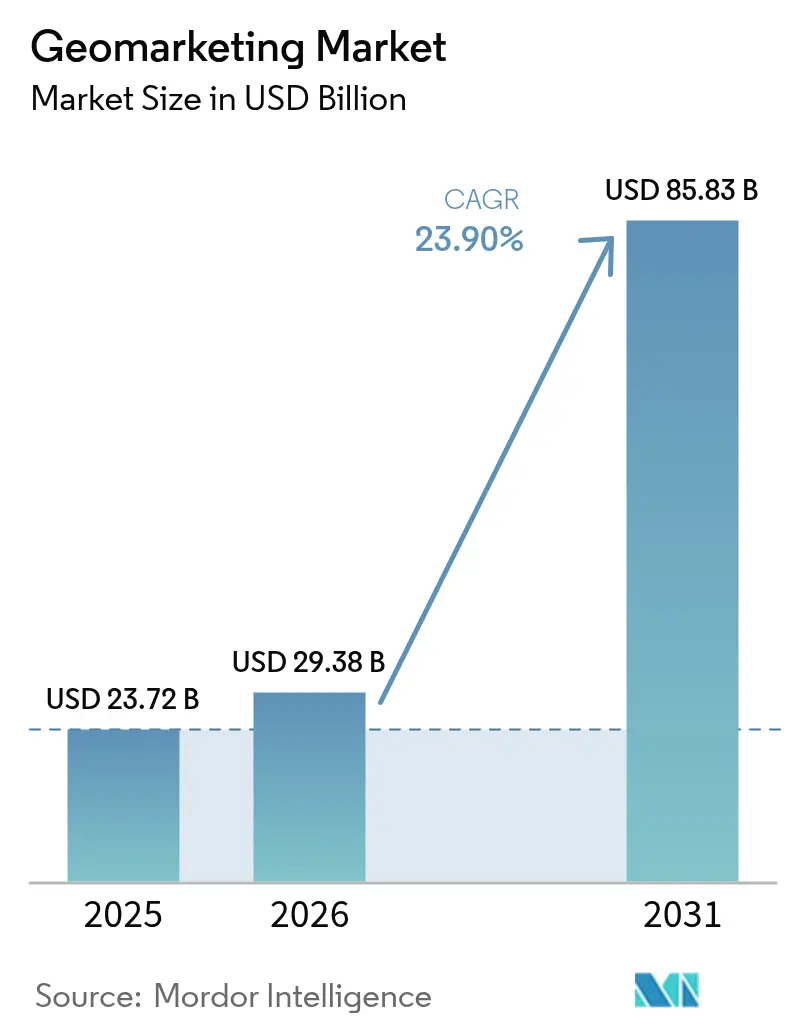
| Market Size (2026) | USD 29.38 Billion |
| Market Size (2031) | USD 85.83 Billion |
| Growth Rate (2026 - 2031) | 23.90% CAGR |
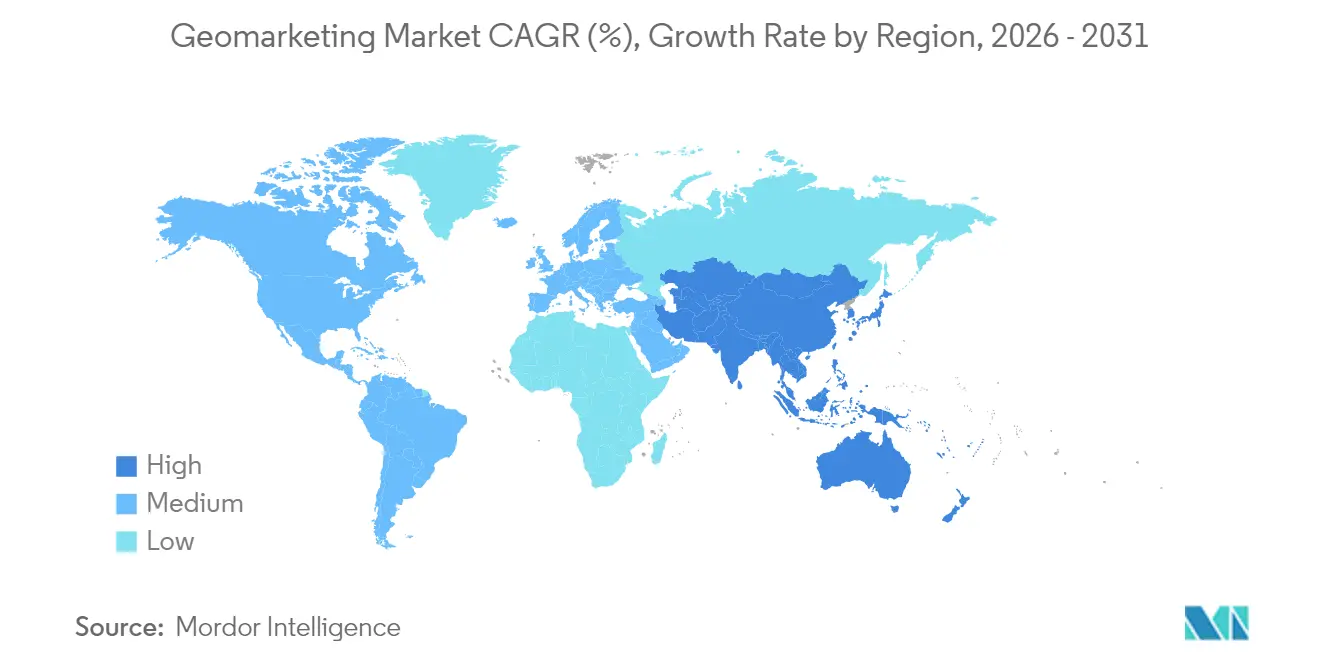
| Fastest Growing Market | Asia Pacific |
| Largest Market | North America |
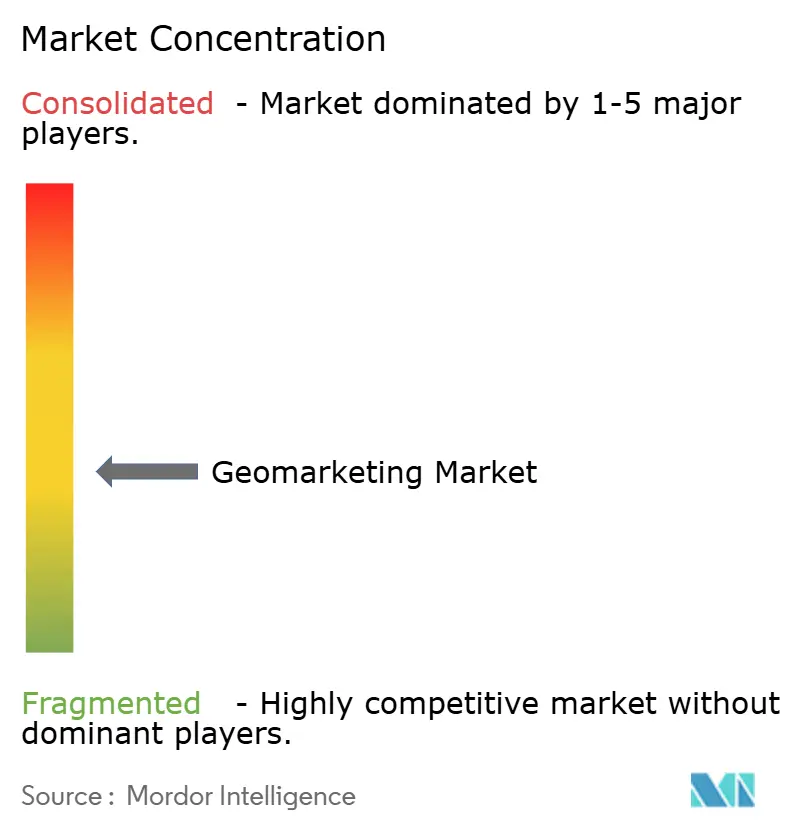
| Market Concentration | Medium |
Major Players *Disclaimer: Major Players sorted in no particular order Image © Mordor Intelligence. Reuse requires attribution under CC BY 4.0. | |
Geomarketing Market Analysis by Mordor Intelligence
Geomarketing market size in 2026 is estimated at USD 29.38 billion, growing from 2025 value of USD 23.72 billion with 2031 projections showing USD 85.83 billion, growing at 23.9% CAGR over 2026-2031. Software-defined platforms and cloud deployments enable rapid feature releases and elastic scaling, while indoor positioning breakthroughs unlock new venue-level use cases. Regulatory pressure around data consent and the technical impact of mobile identifier deprecation temper growth yet also spur innovation in privacy-preserving analytics. Competitive intensity is rising as hyperscale cloud providers, telcos, and specialist vendors compete on data accuracy, real-time insights, and verticalized solutions, making strategic partnerships and cross-stack integration central to differentiation.
Key Report Takeaways
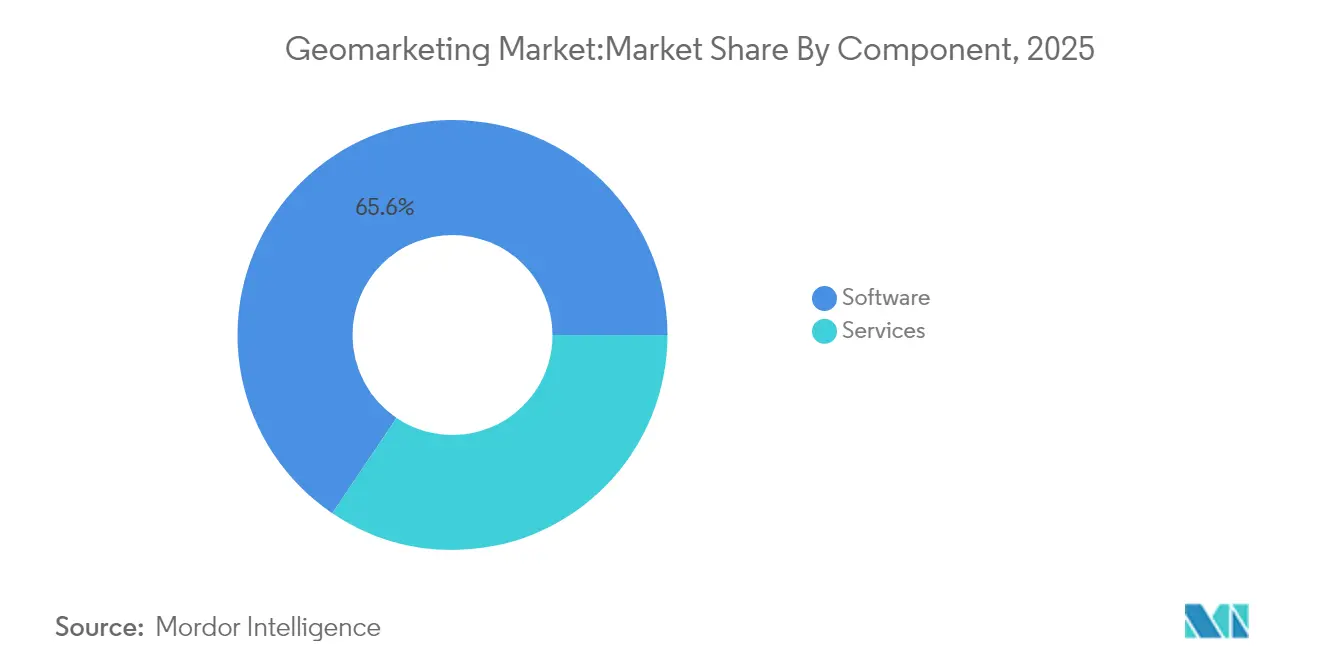
- By component, software held 65.55% of the geomarketing market share in 2025; services post the fastest CAGR at 26.69% through 2031.
- By deployment, cloud platforms captured 70.42% of the geomarketing market in 2025, expanding at 25.46% CAGR to 2031.
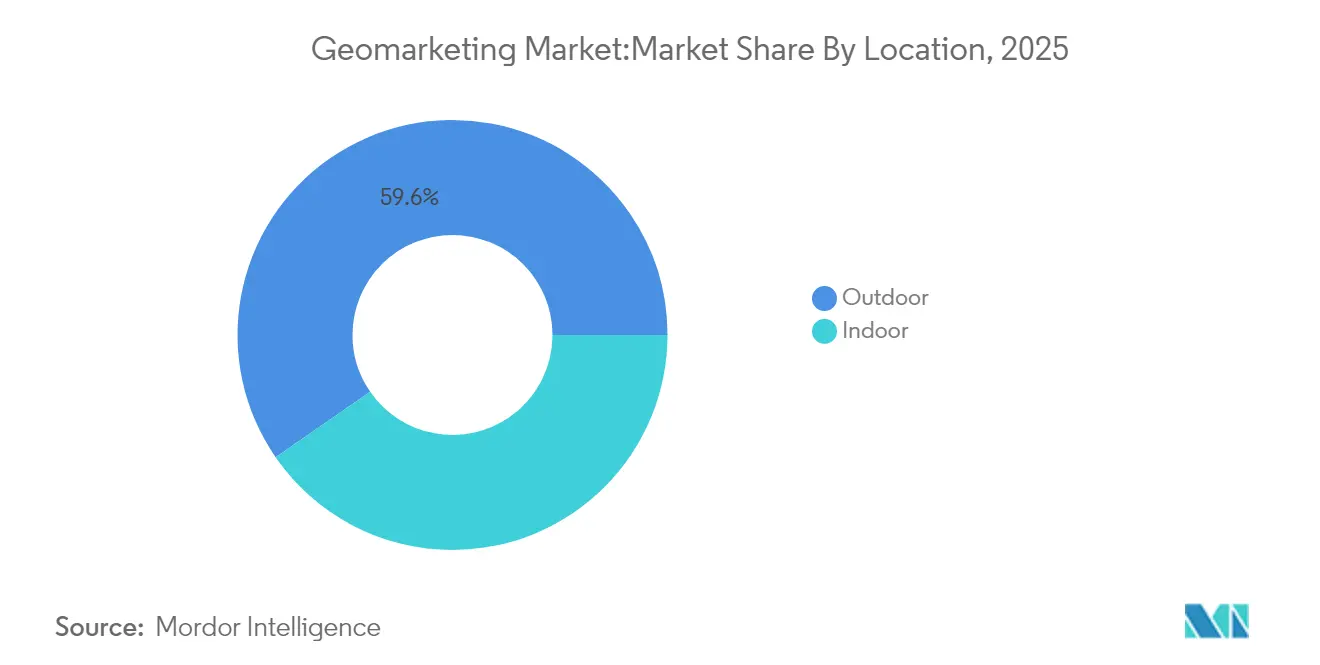
- By location, outdoor services led with a 59.62% share of the geomarketing market size in 2025, while indoor positioning is set to grow at a 26.74% CAGR.
- By end-user industry, retail and e-commerce commanded 27.12% share of the geomarketing market in 2025; travel and hospitality accelerates at 25.88% CAGR.
- By organization size, large enterprises contributed 62.55% revenue in 2025; SMEs record the highest 27.01% CAGR.
- By technology, GPS/cellular retained 42.78% share, whereas BLE beacons advance at 26.05% CAGR.
- By solution type, geo-fencing and proximity marketing led with 33.12% in 2025; real-time tracking scales at 26.25% CAGR.
- By geography, North America controlled 37.25% revenue in 2025, while Asia-Pacific exhibits the quickest 26.31% CAGR.
Note: Market size and forecast figures in this report are generated using Mordor Intelligence’s proprietary estimation framework, updated with the latest available data and insights as of 2026.
Global Geomarketing Market Trends and Insights
Drivers Impact Analysis*
| Driver | (~) % Impact on CAGR Forecast | Geographic Relevance | Impact Timeline |
|---|---|---|---|
| AI-driven hyper-personalization of location ads | +4.2% | Global, led by North America and APAC | Medium term (2-4 years) |
| Growing 5G roll-outs expand indoor accuracy | +3.8% | APAC core, spill-over to North America and EU | Long term (≥ 4 years) |
| Retail digital twins link foot-traffic and spend | +2.9% | North America and EU, expanding to APAC | Medium term (2-4 years) |
| Mainstream adoption of beacons in quick-service restaurants | +2.1% | Global, led by North America | Short term (≤ 2 years) |
| Rideshare and micromobility data monetization | +1.7% | Urban centers globally | Medium term (2-4 years) |
| MarTech stacks embedding real-time geofencing | +1.5% | North America and EU | Short term (≤ 2 years) |
| Source: Mordor Intelligence | |||
AI-Driven Hyper-Personalization of Location Ads
Real-time machine-learning models now adapt creatives to an individual’s movement patterns, dwell time, and venue preferences, enabling retailers to improve ad-spend efficiency by up to 40% compared with traditional geo-targeting methods. [1]Flybuy, “Five Guys + Flybuy: Success, Innovations, and What's Next,” flybuy.com Arrival-time predictions shrink fulfillment gaps, while computer vision links foot traffic to demographic insights, as seen when Aura Vision boosted conversion at Flannels and returned a 4.5 X ROI. These capabilities elevate personalized engagement from optional to indispensable and keep the geomarketing market on an aggressive growth trajectory.
Growing 5G Roll-Outs Expand Indoor Accuracy
Carrier-phase measurements introduced in 3GPP Release 18 deliver sub-meter precision, allowing geomarketing in airports, malls, and factories where GPS once failed. [2]Ericsson, “5G Advanced positioning in 3GPP Release 18,” ericsson.com Enterprises have documented 15-20% productivity gains via automated asset tracking, though mmWave infrastructure requires dense cells and capital investment. Hybrid stacks blending 5G with BLE and Wi-Fi are emerging as a pragmatic route to comprehensive coverage, reinforcing near-term demand for indoor location solutions.
Retail Digital Twins Link Foot-Traffic and Spend
Virtual store replicas correlate movement data with sales to guide merchandise placement, layout changes, and staffing. GUESS reported a 200% merchandising productivity jump using Matterport’s platform. Mall operator Vicinity Centres processed feeds from over 300 dashboards to slash debt by 36% and optimize energy use. Digital twins sharpen return-on-space metrics, keeping retailers invested in advanced location analytics.
Mainstream Adoption of Beacons in Quick-Service Restaurants
Low-cost BLE beacons (< USD 50 each) create location triggers that cut wait times and boost basket sizes. McDonald’s drove an 8% sales lift for select menu items within four weeks of rollout. Sonny’s BBQ then trimmed average pickup times to 2 minutes 30 seconds across 90+ restaurants. Proven ROI and contactless service demand position beacons as a staple across high-volume dining chains.
Restraints Impact Analysis*
| Restraint | (~) % Impact on CAGR Forecast | Geographic Relevance | Impact Timeline |
|---|---|---|---|
| Stringent opt-in consent under GDPR/CCPA | -3.1% | EU and California, expanding to other US states | Long term (≥ 4 years) |
| Depreciation of mobile ad-IDs lowers match rates | -2.7% | Global, highest impact in North America | Medium term (2-4 years) |
| Indoor triangulation accuracy gaps in large venues | -1.9% | Global | Medium term (2-4 years) |
| High TCO for multi-source data normalization | -1.4% | Global, concentrated in enterprise segments | Short term (≤ 2 years) |
| Source: Mordor Intelligence | |||
Stringent Opt-In Consent Under GDPR/CCPA
Regulators now require explicit, affirmative location-data consent, raising compliance costs that range from USD 500,000 to USD 2 million for enterprise platforms. With 21 US states enacting similar laws, fines can touch USD 10,000 per incident. Geo-contextual consent banners aid regional compliance but add operational overhead, keeping privacy at the center of vendor roadmaps.
Depreciation of Mobile Ad-IDs Lowers Match Rates
Opt-in rates for Apple IDFA now sit below 25%, slashing deterministic audience links and trimming attribution accuracy by up to 40%. Probabilistic modeling, first-party data, and differential privacy emerge as alternatives yet carry added technical complexity and may never fully restore granularity, compelling geomarketing platforms to revise performance benchmarks.
*Our forecasts treat driver/restraint impacts as directional, not additive. The impact forecasts reflect baseline growth, mix effects, and variable interactions.
Segment Analysis
By Component: Software Dominance Drives Innovation
Software platforms accounted for 65.55% revenue in 2025, underscoring the geomarketing market preference for cloud-native, feature-rich stacks that can ingest varied data sources and comply with changing privacy rules. Continuous updates funnel AI segmentation, compliance dashboards, and API connectors into user hands without on-premise friction. Services, led by integration and managed analytics, accelerate at 26.69% CAGR as enterprises seek guidance on stitching geomarketing insights into sprawling MarTech architectures.The geomarketing market size tied to services climbs quickly because tailored onboarding, custom algorithm design, and regulatory audits remain outside most in-house skill sets. Oracle’s 2025 cloud revenue growth to USD 11.7 billion illustrates how bundled software-plus-services agreements satisfy enterprise appetite for turnkey location intelligence.


By Deployment: Cloud Adoption Accelerates
Cloud held 70.42% share of the geomarketing market in 2025 and posts the highest 25.46% CAGR as brands favor elastic compute and rapid scaling for high-volume campaigns. Microsoft Azure’s 31% revenue jump reflects surging demand for GPU-accelerated analytics and serverless geospatial pipelines.On-premise persists in sectors with strict data sovereignty, yet faces cost headwinds; enterprises cutting hardware and maintenance achieve 40-60% savings in total cost of ownership. Network egress fees and latency constraints keep certain low-latency applications hybrid, but incremental cloud security advances continue drawing workloads into multitenant environments, expanding the geomarketing market footprint.
By Location: Indoor Positioning Gains Momentum
Outdoor services preserved 59.62% revenue in 2025 thanks to ubiquitous GPS, while indoor positioning’s 26.74% CAGR showcases demand for asset tracking and immersive retail. China Mobile’s 5G system reached 3-5 meter accuracy across 90% of covered space, setting functional benchmarks for venues worldwide.As enterprises embed hybrid BLE–Wi-Fi–5G arrays, the geomarketing market size for indoor services swells, enabling queue management, real-time navigation, and proximity offers. Deployment complexity and cost remain hurdles, but declining beacon prices and managed-service bundles reduce entry barriers for mid-tier retailers and hospitals.
By End-user Industry: Retail Leadership with Hospitality Surge
Retail and e-commerce continued to dominate with 27.12% of the geomarketing market in 2025, exploiting site selection analytics and omnichannel foot-traffic attribution to sharpen margin management. Telstra achieved 95% accuracy in foot-traffic analysis for store planners, exemplifying mature use cases.Travel and hospitality emerges as the fastest-rising adopter as hotels and airlines deploy dynamic pricing and on-premise mobile concierge services. The geomarketing market share captured by hospitality is forecast to expand swiftly, mirroring pandemic recovery and heightened guest-experience expectations. Financial services, media, and healthcare follow with fraud detection, event marketing, and asset monitoring cases that extend addressable revenue.
By Organization Size: Enterprise Dominance with SME Acceleration
Large enterprises retained 62.55% revenue in 2025, leveraging large datasets and multi-site operations to drive holistic customer journey analytics. Cross-stack integrations with CRM, CDP, and BI platforms create 360-degree views, reinforcing lock-in with leading cloud providers.SMEs, historically constrained by budget and expertise, now gain access to SaaS bundles with per-seat pricing, powering the geomarketing market’s democratization. Vendors embed guided workflows and AI-based optimization to mask complexity and accelerate ROI, pushing SME CAGR to 27.01% even as data hygiene and IT resource gaps persist.

By Technology: GPS Stability with BLE Innovation
GPS/cellular retained 42.78% revenue in 2025, offering reliable outdoor positioning for navigation, ride-hailing, and last-mile delivery. BLE beacons however post a 26.05% CAGR, propelled by indoor proximity marketing and order-ahead logistics. Beacon hardware under USD 50 and low power demands reduce rollout friction for franchises and shopping centers.Wi-Fi and NFC serve niche cases, but hybrid technology stacks rise as the geomarketing market chases meter-level accuracy. Patent filings on carrier-phase ranging and ML-enhanced localization show a pipeline of innovations aimed at tighter error bounds and energy efficiency.
By Solution Type: Geofencing Leadership with Real-Time Growth
Geo-fencing and proximity campaigns delivered 33.12% revenue in 2025, valued for clear attribution links between footfall and spend. Retailers and QSR chains rely on polygon-based triggers and competitor “geo-conquesting” to win incremental visits.Real-time tracking’s 26.25% CAGR highlights surging need for logistics orchestration, cold-chain compliance, and customer ETA transparency. 5G latency improvements and edge compute accelerate sub-second updates, expanding the geomarketing market size tied to operational visibility solutions across transport, healthcare, and manufacturing.
Geography Analysis
North America maintained 37.25% of global revenue in 2025, underpinned by mature ad-tech ecosystems, broad 5G penetration, and balanced privacy statutes. Google Cloud logged 30% revenue growth as enterprises layered spatial intelligence on existing data lakes. Federal and state data-privacy frameworks mandate explicit consent yet still permit innovation, ensuring continued investment in precision targeting and omni-channel attribution.Asia-Pacific posts the sharpest 26.31% CAGR, fuelled by population-scale mobile adoption, government 5G incentives, and a mobile-first retail ethos. The GSMA estimates mobile contributed USD 880 billion to regional GDP in 2023, while policies in China, Japan, and Malaysia finance AI and indoor-location pilots. Dual-network 5G frameworks and satellite backhaul projects promise to extend high-accuracy coverage into rural areas, widening the geomarketing market opportunity.Europe advances steadily despite GDPR compliance costs. Enterprises adopt edge processing, federated learning, and differential privacy to reconcile localization with regulatory stringency. Middle East and Africa and Latin America remain emergent yet promising: smart-city investments in the Gulf and rising smartphone penetration in Brazil and Mexico catalyze pilot deployments. Infrastructure gaps and legal uncertainty temper immediate scale, but urbanization and digital payments create fertile ground for localized growth in the next planning cycle.

Competitive Landscape
The geomarketing market is moderately fragmented: no vendor controls outsized revenue, creating room for both hyperscalers and focused specialists. Google, Microsoft, and Oracle bundle location APIs, AI services, and analytics dashboards into their clouds, leveraging scale advantages and enterprise contracts. Foursquare, HERE Technologies, and Mapbox focus on data enrichment, SDK flexibility, and white-label mapping to win developer mindshare.
Strategic positioning revolves around data depth, latency, and privacy. Vendors invest in real-time ingestion engines, AI‐driven segmentation, and consent orchestration to withstand identifier loss and regulatory overhead. Verizon’s 2025 acquisition of Senion adds sub-meter indoor wayfinding to its 5G edge footprint, illustrating telco convergence into analytics. Cisco channels USD 600 million in AI edge orders to embed geospatial triggers in network fabric, highlighting infrastructure players’ offensive.
Patent velocity underscores continuous R&D in multi-sensor fusion and privacy preservation; Qualcomm’s filings on 5G-assisted extended-reality positioning mark the next frontier. [4]Google Patents, “Method and/or system for positioning of a mobile device,” patents.google.com White-space opportunities persist in healthcare, government, and manufacturing verticals where domain compliance and deterministic accuracy outstrip generalist roadmaps, allowing niche vendors to gain footholds even as consolidation looms.
Geomarketing Industry Leaders
Adobe Inc.
Airship Group Inc.
Bluedot Industries Pty Ltd.
CartoDB Inc.
Cisco Systems Inc.
- *Disclaimer: Major Players sorted in no particular order

Recent Industry Developments
- June 2025: Microsoft posted USD 42.4 billion cloud revenue, up 20%, buoyed by Azure location services.
- May 2025: Cisco recorded USD 14.1 billion in revenue and more than USD 600 million in AI infrastructure orders for edge-enabled analytics.
- April 2025: Oracle’s fiscal year revenue reached USD 57.4 billion, with cloud services—including location intelligence—growing 14%.
- March 2025: Verizon acquired Senion to pair 5G with advanced indoor geofencing for enterprise clients.
- February 2025: Google expanded Maps Platform with enhanced privacy controls and real-time analytics aimed at GDPR/CCPA compliance.
- January 2025: Alphabet reported Q4 2024 Google Cloud revenue of USD 12 billion, driven partly by location-based advertising and analytics.


Research Methodology Framework and Report Scope
Market Definitions and Key Coverage
Our study defines the geomarketing market as all software platforms and related implementation or managed services that capture location signals from smartphones or fixed assets through GPS, BLE beacons, Wi-Fi, or cellular triangulation, fuse them with customer or transaction data, and then activate, monitor, or analyze marketing campaigns across digital and physical touchpoints.
Scope Exclusions: Stand-alone geospatial analytics used only for asset tracking or surveying, and hardware sensors that lack embedded marketing functions are outside this assessment.
Segmentation Overview
- By Component
- Software
- Services
- By Deployment
- Cloud
- On-Premise
- By Location
- Indoor
- Outdoor
- By End-User Industry
- BFSI
- IT and Telecommunications
- Retail and E-commerce
- Media and Entertainment
- Travel and Hospitality
- Other End-user Industries
- By Organization Size
- Large Enterprises
- Small and Medium Enterprises (SMEs)
- By Technology
- GPS/Cellular
- BLE Beacons
- Wi-Fi/WLAN
- NFC/RFID
- By Solution Type
- Mapping and Geocoding
- Location Analytics and Visualization
- Geo-Fencing and Proximity Marketing
- Real-Time Tracking
- Campaign Planning and Management
- By Geography
- North America
- United States
- Canada
- Mexico
- South America
- Brazil
- Argentina
- Chile
- Rest of South America
- Europe
- Germany
- United Kingdom
- France
- Italy
- Spain
- Russia
- Rest of Europe
- Asia-Pacific
- China
- India
- Japan
- South Korea
- Singapore
- Malaysia
- Australia
- Rest of Asia-Pacific
- Middle East and Africa
- Middle East
- United Arab Emirates
- Saudi Arabia
- Turkey
- Rest of Middle East
- Africa
- South Africa
- Nigeria
- Rest of Africa
- Middle East
- North America
Detailed Research Methodology and Data Validation
Primary Research
We next conduct structured interviews with SaaS vendors, mobile ad-tech integrators, omnichannel retailers, and regional privacy experts across North America, Europe, and Asia-Pacific. Short follow-up surveys supply average contract values, opt-in rates, and roll-out timelines, letting us validate and refine assumptions from desk work.
Desk Research
We begin with authoritative public datasets. International Telecommunication Union handset penetration grids, UN urbanization ratios, IMF GDP outlooks, and Interactive Advertising Bureau ad-spend dashboards map potential demand pools country by country. Trade papers of the Mobile Marketing Association and privacy rulings released by GDPR or CCPA supervisors clarify regulatory headroom for adoption.
Our analysts then sift through company 10-Ks, investor decks, and press releases to break out geomarketing revenue streams. Patent archives sourced through Questel and beacon shipment logs collated by Volza track technology maturity, while D&B Hoovers and Dow Jones Factiva supply private-firm indicators. The sources named above are illustrative only, and many more inform our library.
Market-Sizing & Forecasting
The 2025 baseline is anchored through a top-down model that allocates verified national digital ad spend to location-enabled formats; selective bottom-up supplier roll-ups and sampled ASP × active-license counts then cross-check totals. Key variables include smartphone installed base, beacon density in modern retail, share of cloud-native marketing stacks, foot-traffic recovery indices, and statutory consent rates. Multivariate regression links these drivers with historical revenue, while scenario analysis stress-tests price erosion and privacy shocks. Calibrated peer substitution closes residual gaps where primary data remain thin.
Data Validation & Update Cycle
Separate analysts run anomaly checks against external series and prior editions; any variance triggers re-contact with at least one primary respondent before senior sign-off. Reports refresh each year, with interim updates after material regulations or mergers so clients receive the latest view.
Why Mordor's Geomarketing Baseline Commands Unmatched Reliability
Published estimates often diverge because each publisher mixes different scopes, driver sets, and refresh cadences. By aligning definition, variable logic, and timestamps in one continuous workflow, we hold these drifts in check.
Key gaps appear when others fold generic geospatial analytics revenue into the core market, omit integration services, or rely on static adoption ratios and outdated currency conversions, whereas Mordor Intelligence revisits every driver annually.
Benchmark comparison
| Market Size | Anonymized source | Primary gap driver |
|---|---|---|
| USD 23.72 B (2025) | Mordor Intelligence | - |
| USD 21.90 B (2024) | Industry Research Firm A | Covers paid media spend only |
| USD 32.50 B (2025) | Global Consultancy B | Counts adjacent location-analytics software and indirect services |
These contrasts show that our carefully delimited scope, annually refreshed variables, and balanced modeling give decision-makers a transparent, repeatable baseline that neither understates nor overextends the true geomarketing opportunity.


Key Questions Answered in the Report
What is the current value of the geomarketing market?
The geomarketing market is valued at USD 29.38 billion in 2026 and is projected to reach USD 85.83 billion by 2031.
Which component segment leads the geomarketing market?
Software solutions lead with 65.55% revenue in 2025, driven by cloud-native platforms that integrate diverse data sources.
Why is indoor positioning growing faster than outdoor services?
Sub-meter accuracy enabled by 5G, BLE, and Wi-Fi fusion opens asset tracking and in-store engagement opportunities, driving a 26.74% CAGR for indoor positioning.
How are privacy regulations affecting geomarketing?
GDPR and CCPA require explicit consent, increasing compliance costs and reducing addressable audiences, which lowers forecast CAGR by an estimated 3.1%.
Which region is expanding the fastest?
Asia-Pacific shows the highest growth at 26.31% CAGR through 2031, supported by large mobile populations and aggressive 5G rollout programs.
What technologies will shape geomarketing over the next five years?
Continued 5G deployment, AI-powered personalization, BLE beacons, and privacy-preserving analytics are expected to dominate investment priorities across industries.
Page last updated on:


