Artificial Turf Market Size and Share
Market Overview
| Study Period | 2021 - 2031 |
|---|---|
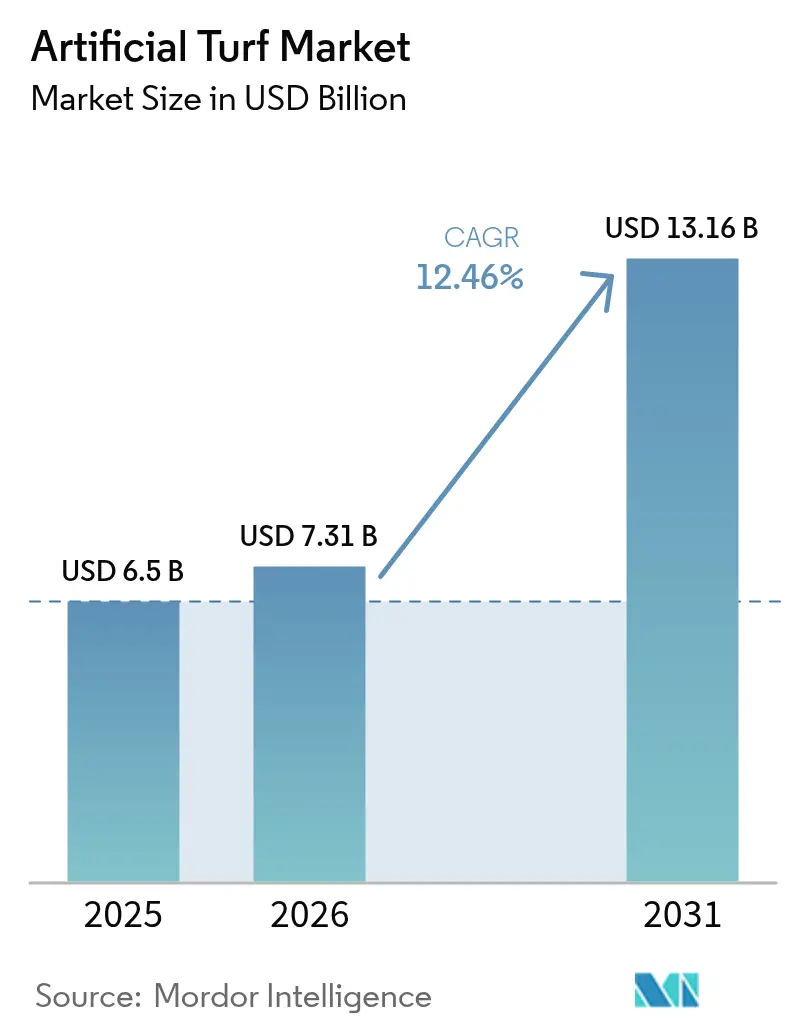
| Market Size (2026) | USD 7.31 Billion |
| Market Size (2031) | USD 13.16 Billion |
| Growth Rate (2026 - 2031) | 12.46% CAGR |
| Fastest Growing Market | Asia-Pacific |
| Largest Market | North America |
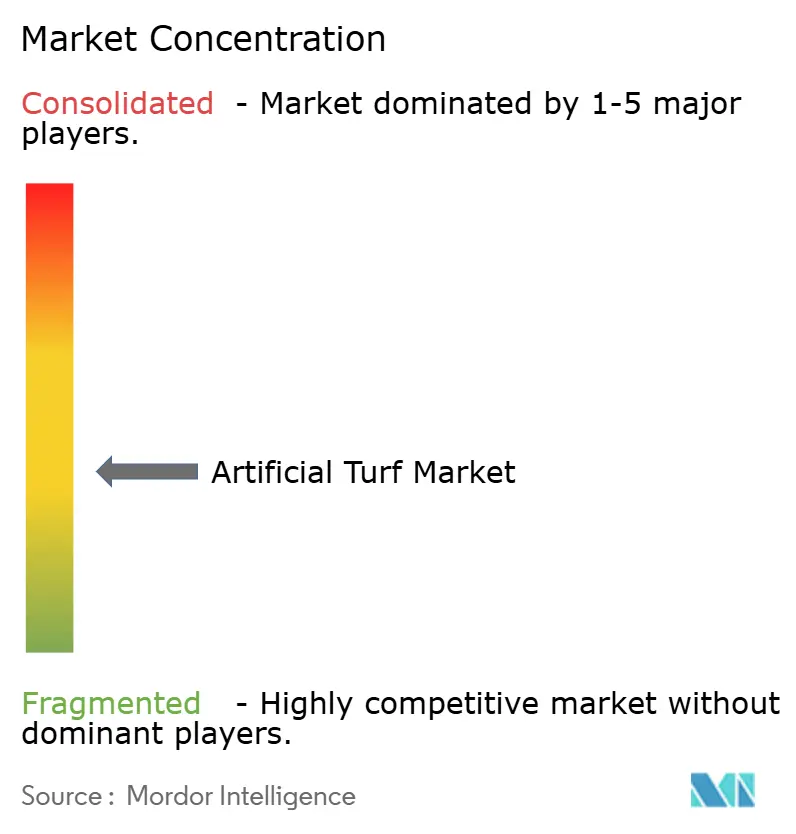
| Market Concentration | Medium |
Major Players *Disclaimer: Major Players sorted in no particular order Image © Mordor Intelligence. Reuse requires attribution under CC BY 4.0. | |
Artificial Turf Market Analysis by Mordor Intelligence
Artificial turf market size in 2026 is estimated at USD 7.31 billion, growing from 2025 value of USD 6.5 billion with 2031 projections showing USD 13.16 billion, growing at 12.46% CAGR over 2026-2031. Heightened drought risk and mandatory water-conservation laws are shifting demand beyond sports venues into residential, commercial, and civic infrastructure. Competitive intensity remains moderate; global leaders such as Tarkett (FieldTurf) and TenCate Grass defend their share through large‐scale extrusion capacity and early-stage recycling programs, while Shaw Sports Turf, CCGrass, and a growing cadre of regional specialists leverage proximity and price agility to win municipal and school contracts. Innovation now centers on low-heat fiber chemistries, per- and polyfluoroalkyl substances-free formulations, and closed-loop recycling partnerships that address the tightening EU microplastics rules and North American extended producer responsibility proposals. Buyers are increasingly evaluating suppliers on end-of-life solutions and verified cooling performance, resulting in a pricing premium for technology owners, even as overall market fragmentation persists.
Key Report Takeaways
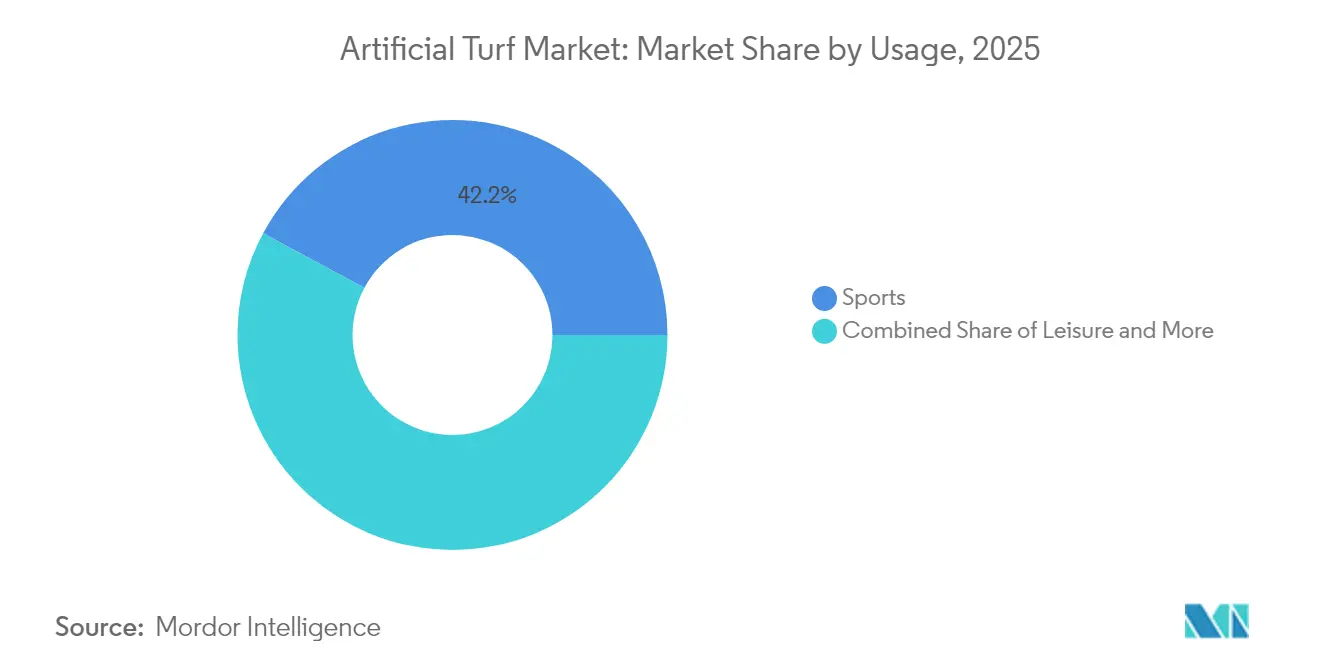
- By usage, sports led with 42.15% of the artificial turf market share in 2025, whereas landscapes are projected to expand at a 14.62% CAGR to 2031.
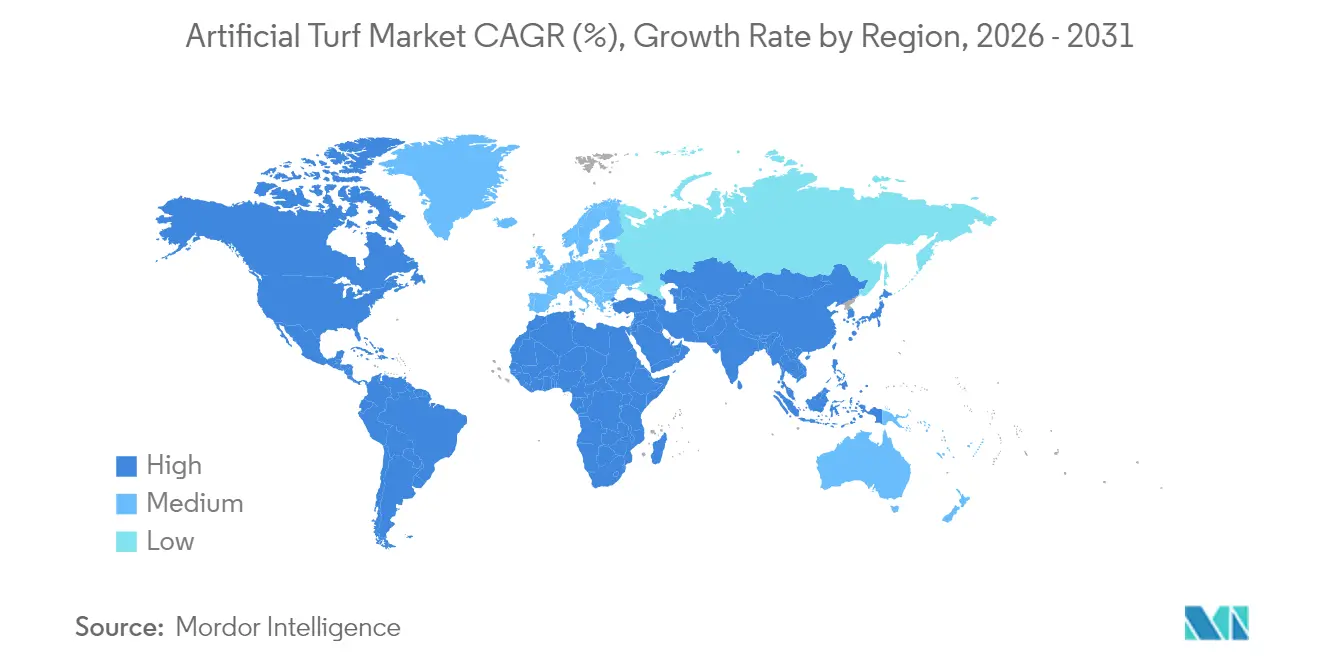
- By geography, North America captured a 37.74% share of the artificial turf market size in 2025, while Asia-Pacific is advancing at a 13.98% CAGR through 2031.
- The competitive landscape remains moderately fragmented. Tarkett (FieldTurf) and TenCate Grass lead the way with sustainability credentials, and recycling infrastructure is emerging as the primary differentiator, rather than price alone.
Note: Market size and forecast figures in this report are generated using Mordor Intelligence’s proprietary estimation framework, updated with the latest available data and insights as of 2026.
Global Artificial Turf Market Trends and Insights
Drivers Impact Analysis*
| Driver | (~) % Impact on CAGR Forecast | Geographic Relevance | Impact Timeline |
|---|---|---|---|
| Stringent water-conservation mandates | +2.8% | North America and Australia core, expanding to Europe | Medium term (2-4 years) |
| Expanding installation in multi-sport stadia | +2.1% | Global, with a concentration in Asia-Pacific and the Middle East | Long term (≥ 4 years) |
| Surging residential and commercial landscaping demand | +3.2% | North America and Europe primary, Asia-Pacific emerging | Short term (≤ 2 years) |
| Urban-heat-island climate resilience projects | +1.4% | Global urban centers, priority in Asia-Pacific megacities | Long term (≥ 4 years) |
| Adoption of autonomous turf-laying robots | +0.9% | North America and Europe early adoption markets | Medium term (2-4 years) |
| Circular turf recycling/Extended Producer Responsibility programs | +1.1% | Europe mandatory, North America voluntary adoption | Medium term (2-4 years) |
| Source: Mordor Intelligence | |||
Stringent Water-Conservation Mandates
California’s AB 1572 and Colorado’s SB 24-005 remove potable-water irrigation from nonfunctional lawns and ban new nonfunctional turf, converting discretionary upgrades into compliance obligations. Accelerated timelines strain installer capacity and pull forward replacement cycles, effectively anchoring the artificial turf market to public-policy calendars rather than team-season budgets. Municipalities in Arizona, Nevada, and parts of Australia have begun drafting parallel ordinances to safeguard dwindling aquifers.
Expanding Installation in Multi-Sport Stadia
Elite venues increasingly demand fields that can host football, soccer, and concerts within compressed scheduling windows. Mercedes-Benz Stadium’s 2025 FieldTurf CORE installation and SoFi Stadium’s hybrid turf pilot for the 2026 World Cup illustrate the visibility that large contracts create for next-generation systems. These specification uplifts migrate to collegiate and secondary facilities within two to three bid cycles, multiplying the revenue influence of each flagship project.
Surging Residential and Commercial Landscaping Demand
Landscaping applications benefit from convergent trends, including water conservation, maintenance cost reduction, and aesthetic consistency requirements. The segment's 15.3% CAGR reflects fundamental shifts in property management economics, where artificial turf's higher upfront costs become justified by the elimination of irrigation, fertilization, and maintenance expenses. Commercial property managers are increasingly specifying artificial turf for common areas to achieve predictable landscaping budgets and maintain year-round visual appeal[1]Source: Synthetic Turf Council, “Landscape Benefits Fact Sheet,” syntheticturfcouncil.org. Hospitality chains are standardizing the use of artificial turf in courtyards to meet ESG targets tied to water conservation and irrigation cuts.
Urban Heat-Island Climate-Resilience Projects
Cities integrate artificial turf cooling systems into broader urban heat mitigation strategies, transforming product specifications from performance-focused to climate-adaptive requirements. Dutch research demonstrating 25.5°C temperature reductions through subsurface water storage systems positions cooling-enhanced turf as infrastructure rather than a recreational amenity. Municipal procurement increasingly prioritizes heat reduction capabilities alongside durability metrics, creating differentiation opportunities for manufacturers developing climate-adaptive solutions.
Restraints Impact Analysis*
| Restraint | (~) % Impact on CAGR Forecast | Geographic Relevance | Impact Timeline |
|---|---|---|---|
| Micro and nano-plastic pollution scrutiny | -1.8% | Europe's regulatory leadership, global environmental advocacy | Medium term (2-4 years) |
| High upfront installation cost | -2.1% | Global, particularly price-sensitive emerging markets | Short term (≤ 2 years) |
| European Union ban on crumb-rubber infill | -1.4% | Europe's direct impact, global supply chain disruption | Short term (≤ 2 years) |
| Player heat-stress litigation risk | -0.7% | North America litigation environment, global safety standards | Long term (≥ 4 years) |
| Source: Mordor Intelligence | |||
Micro- and Nano-Plastic Pollution Scrutiny
The European Chemicals Agency estimates sports pitches contribute 16,000 metric tons of microplastics annually, accelerating momentum for a continent-wide crumb-rubber phase-out[2].Source: European Chemicals Agency, “Microplastics from Artificial Turf Pitches,” echa.europa.eu Manufacturers must redesign infill containment and explore polymer-bound or plant-based alternatives, which could increase system costs by 8-12%. The European Chemicals Agency has now confirmed the shedding of nano-plastic fibers under mechanical wear, strengthening arguments for tighter specification limits and extended producer responsibility schemes.
High Upfront Installation Cost
Installation cost barriers intensify in price-sensitive segments, where artificial turf competes against natural grass alternatives that have lower initial capital requirements. Municipal budget constraints limit the adoption of solutions despite long-term operational savings, particularly in emerging markets where financing mechanisms for infrastructure improvements remain underdeveloped. The cost differential becomes pronounced for smaller installations where economies of scale cannot offset preparation and installation expenses, creating market segmentation between premium applications and cost-constrained projects. Economic sensitivity increases during periods of elevated material costs and labor shortages, forcing manufacturers to balance margin preservation against market access objectives.
*Our forecasts treat driver/restraint impacts as directional, not additive. The impact forecasts reflect baseline growth, mix effects, and variable interactions.
Segment Analysis
By Usage: Sports Dominate Despite Landscape Acceleration
Sports accounted for a 42.15% slice of the artificial turf market in 2025, anchoring recurring eight- to ten-year replacement cycles across professional and collegiate venues. Contact Sports, such as hockey, tennis, and baseball fields, pursue fiber blends that optimize ball roll and shock attenuation, reinforcing a premium tier that shields margins even when resin costs rise. Other sports applications, including baseball and multi-purpose fields, are increasingly specifying hybrid systems that combine synthetic reinforcement with natural grass playing surfaces.
Upgrades now include heat-reflective pigments and stitched labels that log maintenance data for warranty validation. Meanwhile, the landscape is advancing at a 14.62% CAGR to 2031, outpacing every sports sub-segment as municipalities pivot toward drought resilience. This acceleration reflects fundamental shifts in property management economics, where artificial turf's higher upfront costs become justified by the elimination of irrigation and maintenance expenses. Leisure applications, encompassing playgrounds and recreational areas, benefit from safety improvements and year-round usability that natural surfaces cannot provide consistently.


Geography Analysis
North America is projected to command a 37.74% market share in 2025, driven by its established sports infrastructure and predictable replacement cycle across professional, collegiate, and municipal facilities. The region's market maturity generates stable revenue streams through scheduled field renewals and regulatory compliance installations, particularly following the implementation of water conservation mandates. California’s potable-water ban for nonfunctional lawns and Colorado’s turf-planting moratorium create immediate compliance projects with limited scheduling flexibility. Mexico’s municipal parks favor synthetics to curb rising water bills and extend play hours despite temperature spikes.
The Asia-Pacific region emerges as the fastest-growing region, with a 13.98% CAGR from 2026 to 2031, driven by urbanization pressures and the development of sports infrastructure across major economies. China's massive stadium construction programs and India's growing investments in sports facilities create substantial installation opportunities that dwarf replacement-driven demand in mature markets. The region’s freight advantage supports exports across Southeast Asia, while Japan’s dense urban zones provide test beds for heat-mitigating fibers. Government grants in South Korea offset upfront costs for school pitches, thereby accelerating the penetration of primary education facilities.
The Europe, Middle East, and Africa regions represent emerging growth opportunities, despite regulatory headwinds from environmental restrictions. The European Union's ban on crumb rubber infill creates short-term disruption but drives innovation toward sustainable alternatives that may establish competitive advantages in global markets. South America's market development reflects economic constraints and infrastructure priorities that favor cost-effective solutions over premium specifications. Africa's limited current market presence suggests significant long-term potential as economic development and sports infrastructure investment accelerate across the continent.

Competitive Landscape
The artificial turf market exhibits moderate fragmentation, featuring both global brands and regional specialists. Tarkett’s FieldTurf division runs extrusion plants in France, Germany, and Abu Dhabi, supplementing United States production to balance freight costs and diversify resin sourcing. Its Pennsylvania regeneration facility processes 2,600 metric tons of post-consumer turf annually in 2021, bolstering bids in jurisdictions that weigh end-of-life plans during tender scoring. TenCate Grass collaborates with ExxonMobil using Exxtend technology to convert reclaimed polyethylene into virgin-grade feedstock, enabling a closed-loop supply chain that aligns with EU circularity mandates.
Shaw Sports Turf competes on tufting speed and full-depth color consistency, targeting high-volume high-school fields where budget certainty trumps hybrid-grass aesthetics. CCGrass expands its Asian market coverage through lower-priced ranges backed by FIFA Preferred Producer status, while SIS Pitches focuses on turnkey hybrid systems for rugby venues that require stitched natural roots for scrum stability.
Emerging entrants explore sugar-cane-based yarns, silicone-free antistatic treatments, and AI-based wear diagnostics. Technology crossovers from geosynthetics and roofing membranes introduce UV-stabilizer packages that lengthen fiber life in equatorial climates. Competitive intensity is likely to rise once EU extended-producer-responsibility fees fully apply in 2027, pushing mid-tier firms to partner with recyclers or exit.
Artificial Turf Industry Leaders
CCGrass
Tarkett (FieldTurf)
TenCate Grass
Shaw Sports Turf
Sports Group (Polytan)
- *Disclaimer: Major Players sorted in no particular order

Recent Industry Developments
- January 2025: FieldTurf installed its CORE system at Mercedes-Benz Stadium for the College Football Playoff National Championship, reinforcing its position among elite college football programs with over 1,500 NCAA installations.
- October 2024: European Parliament approved the EU crumb-rubber infill ban, representing a USD 218,00 metric tons annual impact across Europe.
- September 2024: Domo Sports Grass’s biobased turf from sugar cane gained market attention as a sustainable alternative to petroleum-based fibers.
- June 2024: City of Windsor announced a USD 3 million investment in an artificial turf soccer field at McHugh Soccer Complex, responding to an increase in field rental demand since 2020 and demonstrating municipal recognition of artificial turf's operational advantages in harsh climate conditions.


Research Methodology Framework and Report Scope
Market Definitions and Key Coverage
Our study defines the artificial turf market as the sale and installation value of synthetic-fiber surfaces that mimic natural grass across sports facilities, residential lawns, and commercial landscapes. The unit of analysis is the finished surfacing system, inclusive of backing and infill, but exclusive of site civil works and post-installation maintenance.
Scope exclusion: Decorative short-pile mats, indoor carpets, and crumb-rubber production are not considered.
Segmentation Overview
- By Usage
- Sports
- Contact Sports
- Field Hockey
- Tennis
- Other Sports
- Leisure
- Landscape
- Sports
- Geography
- North America
- United States
- Canada
- Mexico
- Rest of Noth America
- South America
- Brazil
- Argentina
- Rest of South America
- Europe
- Germany
- United Kingdom
- France
- Italy
- Spain
- Russia
- Rest of Europe
- Asia-Pacific
- China
- Japan
- India
- Australia
- Rest of Asia-Pacific
- Middle East
- Saudi Arabia
- Rest of Middle East
- Africa
- South Africa
- Rest of Africa
- North America
Detailed Research Methodology and Data Validation
Primary Research
Mordor analysts interviewed installers, polymer compounders, sports-facility managers, and landscaping contractors across North America, Europe, the Gulf, and East Asia. These discussions clarified installation costs, adoption hurdles after the EU crumb-rubber ban draft, and the premium buyers place on PFAS-free fibers, letting us validate volumes, average selling prices, and refurbishment cycles.
Desk Research
We began by mapping supply-demand fundamentals through public datasets such as the US Geological Survey water-use statistics, California Department of Water Resources rebate files, Eurostat construction permits, and the European Chemicals Agency docket on infill restrictions. Trade association releases from the Synthetic Turf Council, FIFA Quality program test reports, and patent filings accessed via Questel added technology and cost benchmarks. Financial signals for leading manufacturers were drawn from D&B Hoovers and Dow Jones Factiva, while shipment traces from Volza helped cross-check regional flows. These illustrations are indicative; a wider body of literature was reviewed to ground every assumption.
Our analysts then matched secondary findings with municipal tender archives, building-code updates, and drought severity indices, creating the factual lattice that underpins the model.
Market-Sizing & Forecasting
A top-down construct-installable area derived from sports field inventories, housing starts, and commercial lawn conversions was reconciled with bottom-up checks from sampled ASP × square-meter roll-ups. Key variables include new stadium project count, residential water-rebate uptake, average turf life-cycle, drought index shifts, and regional construction cost inflation. Gap pockets in channel data were bridged through weighted extrapolation from certified installer panels.
For forecasting, multivariate regression blended with ARIMA smoothing captured the sensitivity of demand to water scarcity and cap-ex cycles, while scenario analysis stress-tested regulatory swings such as the impending EU micro-plastic limits.
Data Validation & Update Cycle
Outputs undergo variance scans against independent indicators (e.g., FIFA field approvals, polymer capacity utilization). Anomalies trigger senior analyst review before sign-off. Mordor refreshes every twelve months and issues interim updates when rebate legislation or major material bans materially affect baseline numbers.
Why Mordor's Artificial Turf Baseline Commands Dependability
Published figures often diverge because firms adopt dissimilar scopes, pricing ladders, and refresh rhythms. We acknowledge this variability upfront, and then demonstrate how our disciplined variable selection and timely revisions yield a dependable baseline for planners.
Principal gap drivers include whether landscape retrofits are counted, how material mix shifts alter ASPs, and the cadence at which exchange rates and inflation are rebased.
Some providers also fold carpet and automotive turf into totals, creating headline inflation that skews comparisons.
Benchmark comparison
| Market Size | Anonymized source | Primary gap driver |
|---|---|---|
| USD 6.5 B (2025) | Mordor Intelligence | |
| USD 6.87 B (2024) | Global Consultancy A | Omits retrofit landscape demand and applies uniform regional splits |
| USD 7.59 B (2024) | Trade Journal B | Uses single global ASP, ignoring polymer mix and rebate-driven discounts |
| USD 76.6 B (2022) | Regional Consultancy C | Broad scope includes carpets, mats, and automotive interiors |
The comparison shows that when scope creep or static pricing models are stripped away, Mordor's figure offers a balanced, transparent baseline tied to observable installation activity and clearly stated exclusions, giving decision-makers a number they can trust.


Key Questions Answered in the Report
What is the current value of the artificial turf market?
The artificial turf market is valued at USD 7.31 billion in 2026 and is projected to grow to USD 13.16 billion by 2031 at a 12.46% CAGR.
Which segment is expanding fastest within the artificial turf market?
Landscape applications are advancing at a 14.62% CAGR, outpacing all sports-related segments due to water-conservation mandates and lower lifetime maintenance costs.
Which region holds the largest share of the artificial turf market?
North America leads with 37.74% share in 2025, supported by mature stadium replacement cycles and strict drought legislation.
Why are microplastics a concern for artificial turf?
Studies attribute 16,000 metric tons of annual microplastic emissions in Europe to artificial-turf pitches, prompting regulations that phase out crumb-rubber infill and drive demand for sustainable alternatives.
How are manufacturers addressing end-of-life turf disposal?
Companies such as TenCate Grass and Tarkett are investing in advanced recycling programs that convert used polyethylene fibers into new resin, aligning with circular-economy regulations and buyer sustainability criteria.
What factors influence the total cost of ownership for artificial turf?
Primary factors include initial installation cost, irrigation savings, maintenance labor, field downtime, and eventual recycling or disposal fees, with water-stressed regions achieving the fastest payback periods.
Page last updated on:


