Fiber Bragg Grating Sensor Market Size and Share
Market Overview
| Study Period | 2020 - 2031 |
|---|---|
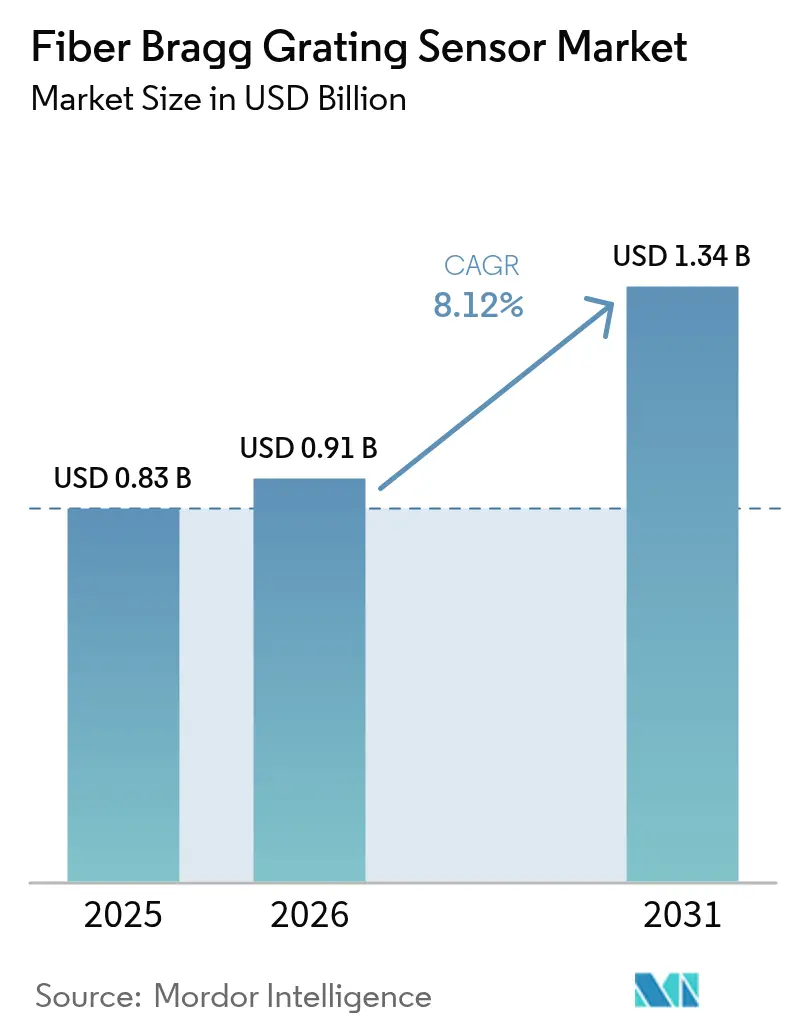
| Market Size (2026) | USD 0.91 Billion |
| Market Size (2031) | USD 1.34 Billion |
| Growth Rate (2026 - 2031) | 8.12% CAGR |
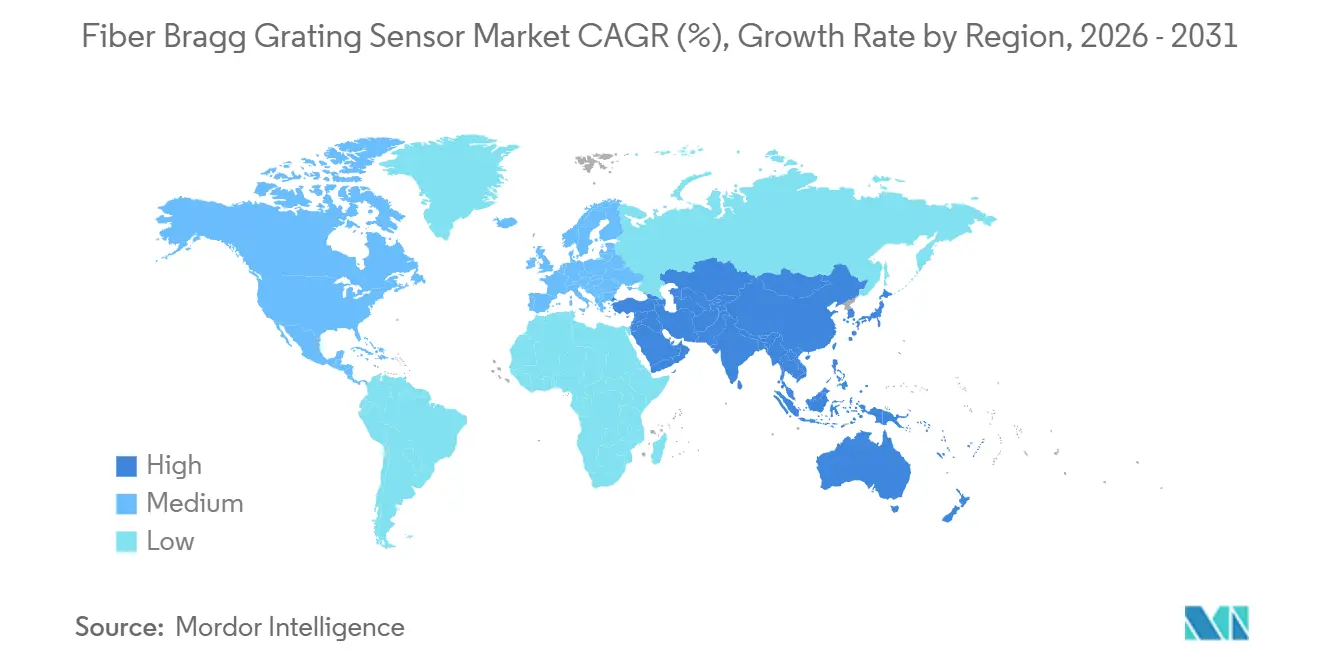
| Fastest Growing Market | Asia Pacific |
| Largest Market | North America |
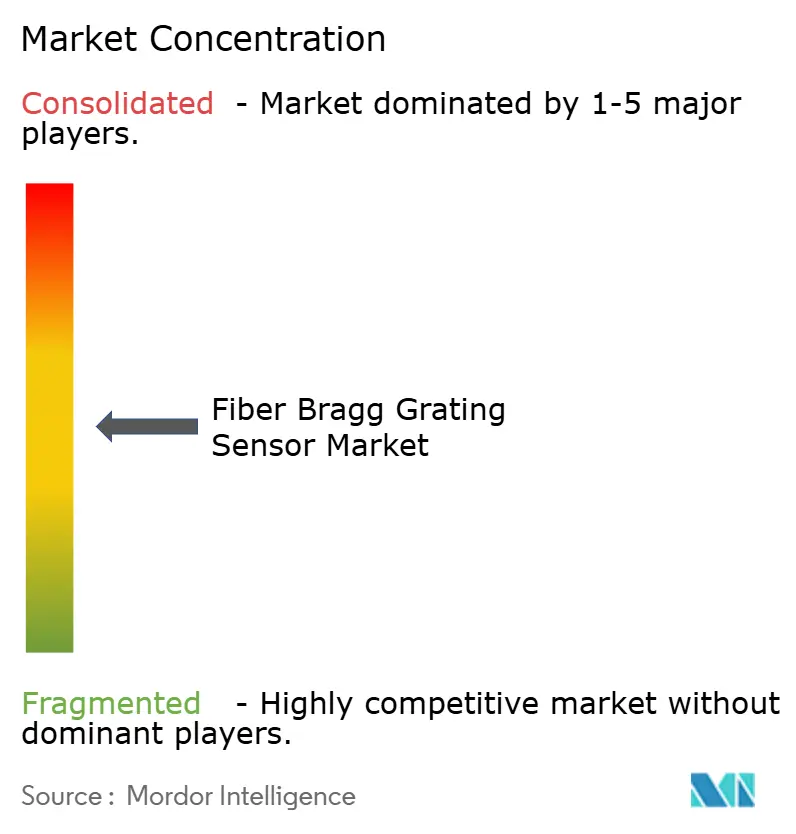
| Market Concentration | Medium |
Major Players *Disclaimer: Major Players sorted in no particular order Image © Mordor Intelligence. Reuse requires attribution under CC BY 4.0. | |
Fiber Bragg Grating Sensor Market Analysis by Mordor Intelligence
The Fiber Bragg Grating Sensor Market size is projected to expand from USD 0.83 billion in 2025 and USD 0.91 billion in 2026 to USD 1.34 billion by 2031, registering a CAGR of 8.12% between 2026 to 2031.
Widespread retrofits of aging bridges and tunnels, surging 5G fiber backhaul deployments, and accelerating adoption of distributed acoustic sensing in long oil and gas pipelines lift baseline demand across construction, telecom, and energy sectors. Mining operators add momentum as regulators insist on real-time ground control monitoring, while aerospace and defense programs embed sensors in composite airframes to reduce unscheduled maintenance. Vendors differentiate on interrogator sampling speed and multiplexing density, two factors that determine total system cost and competitive bid success. Meanwhile, customers see value migrating from raw wavelength data to cloud-based analytics that convert continuous streams into actionable maintenance decisions, stimulating partnerships between hardware specialists and software platforms.
Key Report Takeaways
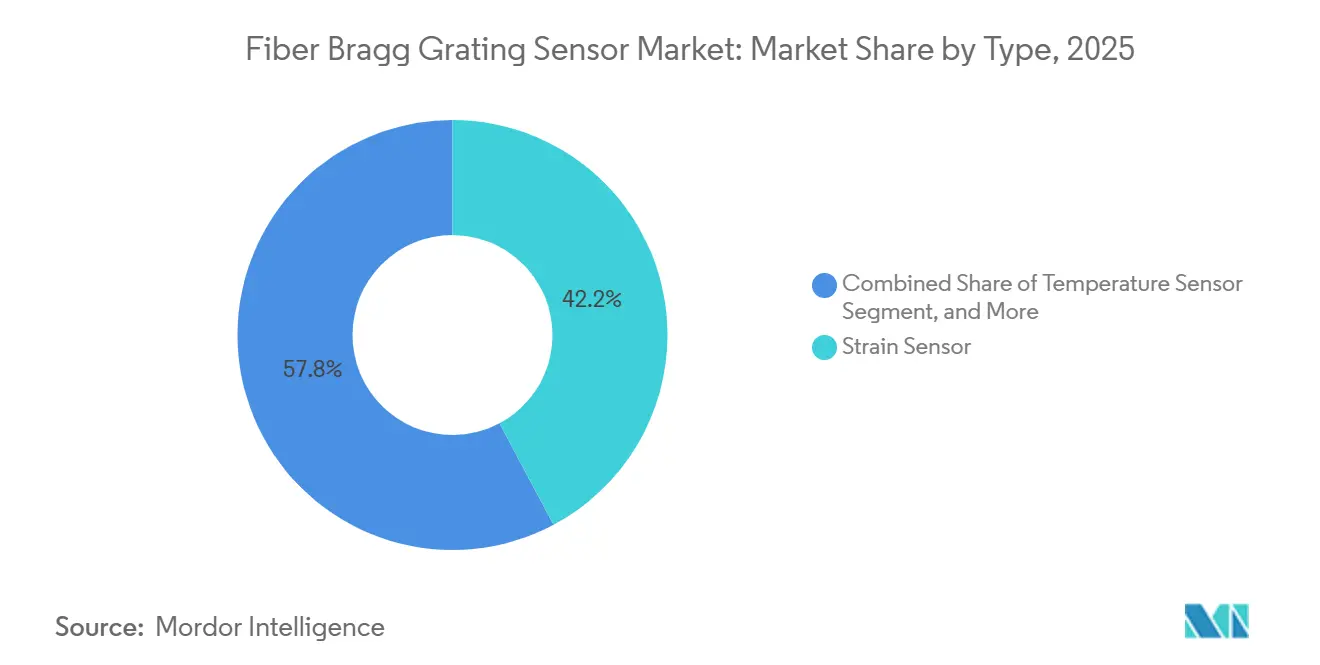
- By type, strain sensors led with 42.21% of the fiber Bragg grating sensor market share in 2025, whereas acoustic sensors are projected to expand at a 9.14% CAGR through 2031.
- By grating wavelength range, the C-band segment held 39.13% revenue share in 2025, while the L-band segment is forecast to grow at an 8.89% CAGR to 2031.
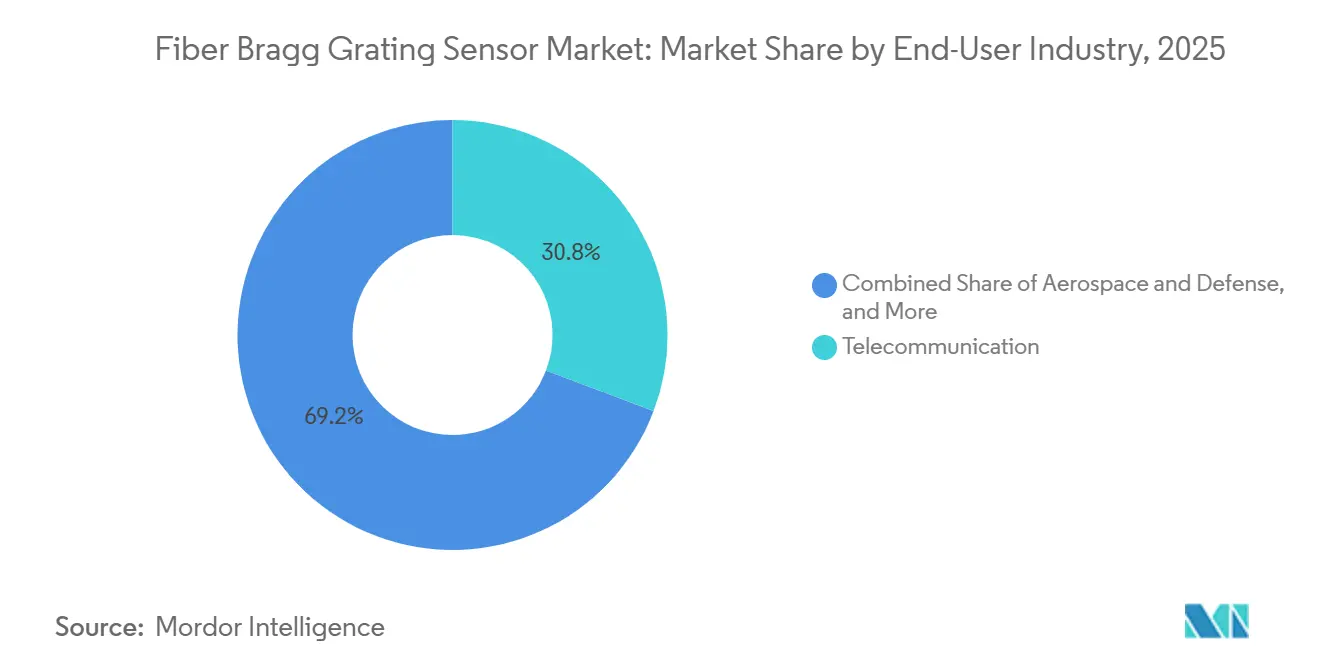
- By end-user industry, telecommunications accounted for 30.76% of the fiber Bragg grating sensor market in 2025, and mining is poised for the fastest 9.56% CAGR through 2031.
- By application, structural health monitoring captured a 37.32% share in 2025, whereas vibration and acoustic monitoring will advance at a 9.19% CAGR between 2026-2031.
- By geography, North America retained a 34.79% share of the fiber Bragg grating sensor market in 2025, yet Asia-Pacific is projected to register the highest 9.07% CAGR to 2031.
Note: Market size and forecast figures in this report are generated using Mordor Intelligence’s proprietary estimation framework, updated with the latest available data and insights as of 2026.
Global Fiber Bragg Grating Sensor Market Trends and Insights
Drivers Impact Analysis*
| Driver | (~) % Impact on CAGR Forecast | Geographic Relevance | Impact Timeline |
|---|---|---|---|
| Growing Demand for Real-Time Structural Health Monitoring | +2.1% | Global, especially North America, Europe, Asia-Pacific urban centers | Medium term (2-4 years) |
| Expansion of 5G Fiber Backhaul Infrastructure | +1.8% | Asia-Pacific, North America, Europe | Short term (≤ 2 years) |
| Rapid Deployment of Distributed Acoustic Sensing in Oil and Gas Pipelines | +1.5% | Middle East, North America, Africa, South America | Medium term (2-4 years) |
| Increasing Use in High-Voltage Direct Current Cables | +1.2% | Europe, Asia-Pacific, North America | Long term (≥ 4 years) |
| Adoption in Hydrogen Pipeline Networks | +0.9% | Europe, Asia-Pacific, Middle East | Long term (≥ 4 years) |
| Defense Focus on Condition-Based Aircraft Maintenance | +0.7% | North America, Europe, Asia-Pacific | Medium term (2-4 years) |
| Source: Mordor Intelligence | |||
Growing Demand for Real-Time Structural Health Monitoring
Bridge and tunnel owners retrofit embedded fiber Bragg gratings to continuously measure strain and temperature, replacing manual inspections with 24-hour data streams that extend asset life by up to 20 years. Wind farm operators add arrays inside turbine blades, capturing micro-crack initiation after millions of fatigue cycles and scheduling blade swaps only when analytics flag risk. Fusion-energy laboratories and aerospace test stands select technologies that are immune to magnetic fields and cryogenic temperatures, thereby broadening credibility among high-reliability users. Cloud dashboards and machine-learning anomaly detection convert sensor data into maintenance work orders, shifting revenue toward software subscriptions. Collectively, these dynamics secure a multi-year volume pipeline for the fiber Bragg grating sensor market.
Expansion of 5G Fiber Backhaul Infrastructure
Mobile operators string dense fiber networks to connect more than three million 5G base stations across China, India, South Korea, Europe, and North America. Apodized gratings spliced at distribution nodes detect bending, temperature spikes, and micro-vibrations that jeopardize latency targets, enabling field crews to repair lines before service degradation. Operators increasingly favor L-band gratings for rural backhaul stretches exceeding 80 km, where lower attenuation cuts amplifier count and capital cost. Pilot projects that reuse installed communications fiber for both data and sensing reduce per-kilometer deployment expense by nearly half, accelerating adoption among railways and power utilities [1]NTT West, “Optical Fiber Sensing for Railways,” NTT West Newsroom, ntt-west.co.jp. The telecom footprint therefore anchors near-term revenue for the fiber Bragg grating sensor market.
Rapid Deployment of Distributed Acoustic Sensing in Oil and Gas Pipelines
Pipeline operators confront stricter leak-detection rules that demand pinpoint localization within minutes. Distributed acoustic sensing converts buried fiber into a continuous microphone, enabling detection of excavations, pressure anomalies, or illegal taps with sub-10-meter accuracy over thousands of kilometers. Algerian trials across 14,000 km delivered a false-positive rate of 0.012 events per km per day, saving operators 20-30% in patrol costs and proving readiness for continental pipelines [2]Huawei, “Sonatrach and Huawei Jointly Innovate a Smart Oil and Gas Pipeline Fiber Sensing Inspection Solution,” Huawei Enterprise, huawei.com. North American shale fields use the same platform to monitor hydraulic fracture propagation in real time, optimizing stage spacing and proppant use. These benefits push acoustic arrays to the top of capital budgets, bolstering multi-year growth prospects for the fiber Bragg grating sensor market.
Increasing Use in High-Voltage Direct Current Cables
HVDC links that evacuate offshore wind power expose cables to high electrical fields that cripple electronic gauges. Fiber Bragg gratings, immune to electromagnetic interference, embed directly into cable insulation during manufacture to map temperature gradients and detect mechanical strain that precedes a USD 50-100 million outage. The North Sea Wind Power Hub and similar Asia-Pacific projects plan thousands of kilometers of such cables, each demanding lifelong monitoring. Dual-grating designs separate strain from temperature, sustaining ±2 microstrain accuracy despite 40 °C load cycles [3]HBK, “Optical Fiber Sensors,” hbm.com. As offshore wind complexes scale, turnkey sensor orders strengthen the fiber Bragg grating sensor market outlook.
Restraints Impact Analysis*
| Restraint | (~) % Impact on CAGR Forecast | Geographic Relevance | Impact Timeline |
|---|---|---|---|
| Cross-Sensitivity to Temperature and Strain | -1.3% | Global harsh-environment sites | Medium term (2-4 years) |
| High Upfront Installation Cost versus Electrical Gauges | -1.7% | Cost-sensitive markets worldwide | Short term (≤ 2 years) |
| Limited Dynamic Range in Ultra-Fast Events | -0.6% | Defense, aerospace, high-speed manufacturing | Long term (≥ 4 years) |
| Scarcity of Skilled Fiber-Optic Technicians | -0.9% | Asia-Pacific, Middle East, Africa | Medium term (2-4 years) |
| Source: Mordor Intelligence | |||
Cross-Sensitivity to Temperature and Strain
A 1 °C thermal change produces a wavelength shift equal to roughly 10 microstrain, forcing installers to pair each active grating with a strain-isolated reference device. Dual-channel configurations raise sensor counts and interrogator complexity by up to 40%, a premium many industrial owners resist. Attempts to solve the issue using software models require historical data that new users rarely have, delaying deployment. Although compensation hardware from leading vendors narrows errors to ±2 microstrain, cross-talk remains a design hurdle that tempers the expansion rate of the fiber Bragg grating sensor market.
High Upfront Installation Cost versus Electrical Gauges
A sixteen-channel optical interrogator can cost USD 15,000-40,000, several times as much as an electrical strain-gauge logger. Fusion splicers, specialized connectors, and certified technicians add to early outlays, straining capital budgets in mining, construction, and small utilities. Leasing plans and sensor-as-a-service contracts convert capital expenditures into operating expenses, yet adoption outside North America, Europe, and tier-one Asian markets still lags. A Canadian tender in 2025 sought interrogators capable of addressing 1,000 gratings, with Phase 2 funding up to CAD 1 million (USD 735,000), underscoring capital intensity [4]Innovation Science and Economic Development Canada, “Optical Fiber Sensor Interrogator,” ised-isde.canada.ca. Until volumes lift and component prices compress, sticker shock will subtract nearly two percentage points from the otherwise robust CAGR of the fiber Bragg grating sensor market.
*Our forecasts treat driver/restraint impacts as directional, not additive. The impact forecasts reflect baseline growth, mix effects, and variable interactions.
Segment Analysis
By Type: Strain Sensors Anchor Revenue while Acoustic Sensors Accelerate
2025 sales show strain devices controlling 42.21% of the fiber Bragg grating sensor market size, reflecting their role in bridges, wind turbines, and aircraft structures that demand continuous load tracking. Volume remains steady as infrastructure owners mandate embedded monitoring to stretch service life. Acoustic formats, however, will chart a 9.14% CAGR to 2031, outpacing every other category as pipeline and perimeter-security buyers adopt distributed acoustic sensing that turns fiber into a kilometer-scale microphone grid.
Dual-FBG temperature-compensated strain designs push accuracy toward ±2 microstrain, satisfying nuclear, aerospace, and HVDC projects that cannot accommodate calibration shut-downs. Meanwhile, acoustic interrogators now sample at rates beyond 1 MS/s, capturing microseismic precursors in mines and high-frequency crack emissions in composites. This technical leap converts long-tail niche opportunities into scale shipments, lifting the fiber Bragg grating sensor market share of acoustic devices by the end of the forecast window.


By Grating Wavelength Range: C-Band Dominance Faces L-Band Reach
C-band sensors accounted for 39.13% of 2025 revenue thanks to compatibility with legacy erbium-doped amplifiers in telecom backbones. Installed gear lowers procurement friction, keeping C-band a staple for operators that already own matching optics. L-band models, however, promise longer reach and greater multiplex density, enabling 600-plus gratings on a single fiber where C-band supports roughly half that figure. The result is an 8.89% CAGR for the L-band slice through 2031.
Greenfield pipeline, railway, and HVDC projects now specify hybrid interrogators capable of reading both C- and L-band, future-proofing investments while easing migration. As unit volumes rise, component prices drop, opening opportunities for mid-tier suppliers and expanding total addressable demand across the fiber Bragg grating sensor market.
By End-User Industry: Telecom Holds Lead while Mining Races Ahead
Telecommunication service providers represented 30.76% of the fiber Bragg grating sensor market revenue in 2025, driven by 5G fiber backhaul quality monitoring and node security. The segment will post moderate growth as networks mature, yet its share will erode to faster-moving verticals. Mining is projected to register a 9.56% CAGR to 2031, the highest among all industries, because regulators and insurers now treat real-time vibration sensing as mandatory for underground safety certification.
Energy and power utilities deploy gratings inside HVDC cables and transformers to capture temperature hotspots beyond electronic sensor limits, while aerospace and defense integrate arrays for condition-based maintenance that cuts fleet downtime by one-third. Diversified interest ensures balanced demand, but the standout momentum belongs to mines embracing predictive ground control.
By Application: Structural Monitoring Prevails, Vibration Leads Growth
Structural health monitoring held 37.32% 2025 share, underscoring long-cycle bridge and tunnel retrofits across North America, Europe, and Asia-Pacific. Continuous strain and temperature logs feed digital twins that schedule targeted repairs, replacing calendar-based maintenance with data-driven decisions. Vibration and acoustic monitoring will accelerate at a 9.19% CAGR through 2031, propelled by pipeline leak detection, seismic perimeter security, and train-track condition programs.
Temperature mapping stays vital in power transformers and battery packs, whereas pressure sensing secures medical and chemical processes. Emerging load and weight use cases on rail axles and cranes illustrate the breadth of fiber Bragg grating sensor market applications, reinforcing the technology’s cross-sector resilience.
Geography Analysis
North America contributed 34.79% of 2025 sales as defense aircraft, shale pipelines, and aging highway bridges embedded gratings for condition-based oversight. Federal infrastructure grants financed structural retrofits, and the United States Air Force advanced full-fleet sensor integration on composite fighters. Canada’s research funding boosted domestic interrogator capability, while Mexican offshore platforms adopted optical arrays to avoid electromagnetic interference from high-voltage equipment.
Asia-Pacific will record the swiftest 9.07% CAGR to 2031. China’s multiyear 5G rollout attaches inline fiber monitoring to every new base station, India’s metro rail projects hard-wire gratings into tunnels for continuous deformation alerts, and Japan’s November 2025 railway pilot showcases cost-saving reuse of existing telecom fiber for vibration surveillance. Technician shortages remain the lone bottleneck, prompting vendors to bundle installation services and remote diagnostic support.
Europe balances mature bridge-monitoring portfolios with forward-looking hydrogen and offshore wind investments. Germany and the Netherlands are laying 1,200 km of hydrogen corridors that specify all-dielectric leak detection, and the North Sea Wind Power Hub will demand thousands of kilometers of HVDC cable carrying embedded gratings for lifetime thermal management. Middle East and African growth clusters around oil and gas, highlighted by Algeria’s 14,000 km acoustic pipeline rollout, while South America trails but shows pockets of uptake in Brazilian offshore fields and Argentine shale plays.

Competitive Landscape
No single vendor controls more than 15% of revenue, so the fiber Bragg grating sensor market remains moderately consolidated yet open to challenger brands. Pure-play specialists such as FBGS International, Luna Innovations, Smart Fibres, and FiSens win projects that require custom grating design or niche coatings, while diversified measurement houses like HBK and National Instruments leverage global sales teams to bundle optical and electronic instrumentation into a single package. Buyers weigh interrogator sampling speed and multiplexing density heavily, and systems that now read more than 1,000 gratings on a single fiber often decide pipeline and railway tenders.
Strategic activity accelerated in 2024-2025 as vendors raced to pair hardware with analytics. Opterro acquired Redondo Optics in May 2024, adding high-speed distributed sensing that captures microsecond acoustic events for aerospace and defense users. FiSens merged with 5Io. Tech in May 2025 and immediately launched sensor-as-a-service contracts that convert capital budgets into subscription fees, a model attractive to cash-constrained construction and mining firms. JR West and NTT West, while not equipment suppliers, validated a dual-use approach in which telecom fiber also carries sensing signals, cutting incremental capital outlay by nearly half and nudging interrogator makers to support mixed traffic on the same strand.
Competition increasingly centers on software and certification. Vendors that secure ISO 9001 quality and IEC 60079 intrinsic-safety approvals lock in eligibility for pipeline and hydrogen corridor bids, where compliance is non-negotiable. At the same time, cloud dashboards that translate wavelength shifts into maintenance work orders tilt margin capture toward algorithm providers, prompting hardware firms to embed machine-learning engines inside edge interrogators. Price pressure persists on sensor elements, yet companies capable of delivering turnkey solutions, design, installation, analytics, and lifecycle support, protect average selling prices and sustain double-digit service revenue growth.
Fiber Bragg Grating Sensor Industry Leaders
Smart Fibres Ltd
Luna Innovations Inc. (Micron Optics)
Technica Optical Components LLC
Opsens Inc
FBGS International NV
- *Disclaimer: Major Players sorted in no particular order

Recent Industry Developments
- November 2025: JR West and NTT West began field verification of optical fiber sensing across railway lines to detect train position, rockfalls, and equipment anomalies using existing communications fiber.
- August 2025: Smart Fibres Ltd closed a USD 45 million Series C funding round led by Siemens Venture Capital, earmarking the proceeds for capacity expansion, AI-driven signal processing development, and a new aerospace manufacturing site in Seattle.
- July 2025: Hottinger Brüel and Kjær acquired Italian firm Optosensing Srl for USD 28 million, adding underwater sensing technology for offshore wind farms and extending its distributed acoustic sensing portfolio for subsea cable protection.
- May 2025: FiSens merged with 5Io.Tech, combining grating hardware and IoT analytics to address smart infrastructure projects.


Global Fiber Bragg Grating Sensor Market Report Scope
The Fiber Bragg Grating Sensor Market Report is Segmented by Type (Temperature Sensor, Strain Sensor, Pressure Sensor, Acoustic Sensor, Other Types), Grating Wavelength Range (C-Band, L-Band, O-Band, Other Ranges), End-User Industry (Telecommunication, Aerospace and Defense, Construction and Infrastructure, Energy and Power, Oil and Gas, Mining, Other Industries), Application (Structural Health Monitoring, Temperature Monitoring, Vibration and Acoustic Monitoring, Pressure Monitoring, Load and Weight Monitoring, Other Applications), and Geography (North America, Europe, Asia-Pacific, Middle East and Africa, South America). The Market Forecasts are Provided in Terms of Value (USD).
| Temperature Sensor |
| Strain Sensor |
| Pressure Sensor |
| Acoustic Sensor |
| Other Types |
| C-Band (1530 to 1565 nm) |
| L-Band (1565 to1625 nm) |
| O-Band (1260 to 1360 nm) |
| Other Grating Wavelength Ranges |
| Telecommunication |
| Aerospace and Defense |
| Construction and Infrastructure |
| Energy and Power |
| Oil and Gas |
| Mining |
| Other End-User Industries |
| Structural Health Monitoring |
| Temperature Monitoring |
| Vibration and Acoustic Monitoring |
| Pressure Monitoring |
| Load and Weight Monitoring |
| Other Applications |
| North America | United States |
| Canada | |
| Mexico | |
| Europe | Germany |
| United Kingdom | |
| France | |
| Russia | |
| Rest of Europe | |
| Asia-Pacific | China |
| Japan | |
| India | |
| South Korea | |
| Australia | |
| Rest of Asia-Pacific | |
| Middle East | Saudi Arabia |
| United Arab Emirates | |
| Rest of Middle East | |
| Africa | South Africa |
| Egypt | |
| Rest of Africa | |
| South America | Brazil |
| Argentina | |
| Rest of South America |
| By Type | Temperature Sensor | |
| Strain Sensor | ||
| Pressure Sensor | ||
| Acoustic Sensor | ||
| Other Types | ||
| By Grating Wavelength Range | C-Band (1530 to 1565 nm) | |
| L-Band (1565 to1625 nm) | ||
| O-Band (1260 to 1360 nm) | ||
| Other Grating Wavelength Ranges | ||
| By End-User Industry | Telecommunication | |
| Aerospace and Defense | ||
| Construction and Infrastructure | ||
| Energy and Power | ||
| Oil and Gas | ||
| Mining | ||
| Other End-User Industries | ||
| By Application | Structural Health Monitoring | |
| Temperature Monitoring | ||
| Vibration and Acoustic Monitoring | ||
| Pressure Monitoring | ||
| Load and Weight Monitoring | ||
| Other Applications | ||
| By Geography | North America | United States |
| Canada | ||
| Mexico | ||
| Europe | Germany | |
| United Kingdom | ||
| France | ||
| Russia | ||
| Rest of Europe | ||
| Asia-Pacific | China | |
| Japan | ||
| India | ||
| South Korea | ||
| Australia | ||
| Rest of Asia-Pacific | ||
| Middle East | Saudi Arabia | |
| United Arab Emirates | ||
| Rest of Middle East | ||
| Africa | South Africa | |
| Egypt | ||
| Rest of Africa | ||
| South America | Brazil | |
| Argentina | ||
| Rest of South America | ||


Key Questions Answered in the Report
How fast is global demand for fiber Bragg gratings growing?
Revenue is projected to climb from USD 0.91 billion in 2026 to USD 1.34 billion by 2031, reflecting an 8.12% CAGR.
Which segment will expand the quickest through 2031?
Acoustic sensors are forecast to post a 9.14% CAGR on increased distributed acoustic sensing projects in pipelines and perimeter security.
Why are miners adopting optical sensing?
Regulators and insurers now require real-time vibration monitoring to prevent rockfalls, pushing mining adoption at a 9.56% CAGR, the fastest among end-user industries.
What advantage does L-band provide over C-band sensors?
Lower attenuation over 80-100 km lines enables higher multiplexing density, cutting amplifier counts and per-sensor cost in long-haul installations.
How do upfront costs compare to electrical gauges?
A standard 16-channel optical interrogator costs USD 15,000-40,000, around four times an electrical data logger, but lower maintenance and longer service life offset capital over time.
Which regions show the most rapid uptake?
Asia-Pacific leads with a projected 9.07% CAGR, driven by China’s 5G backhaul expansion, India’s metro rail projects, and Japan’s railway safety modernization.
Page last updated on:


