
Market Overview
| Study Period | 2020 - 2031 |
|---|---|
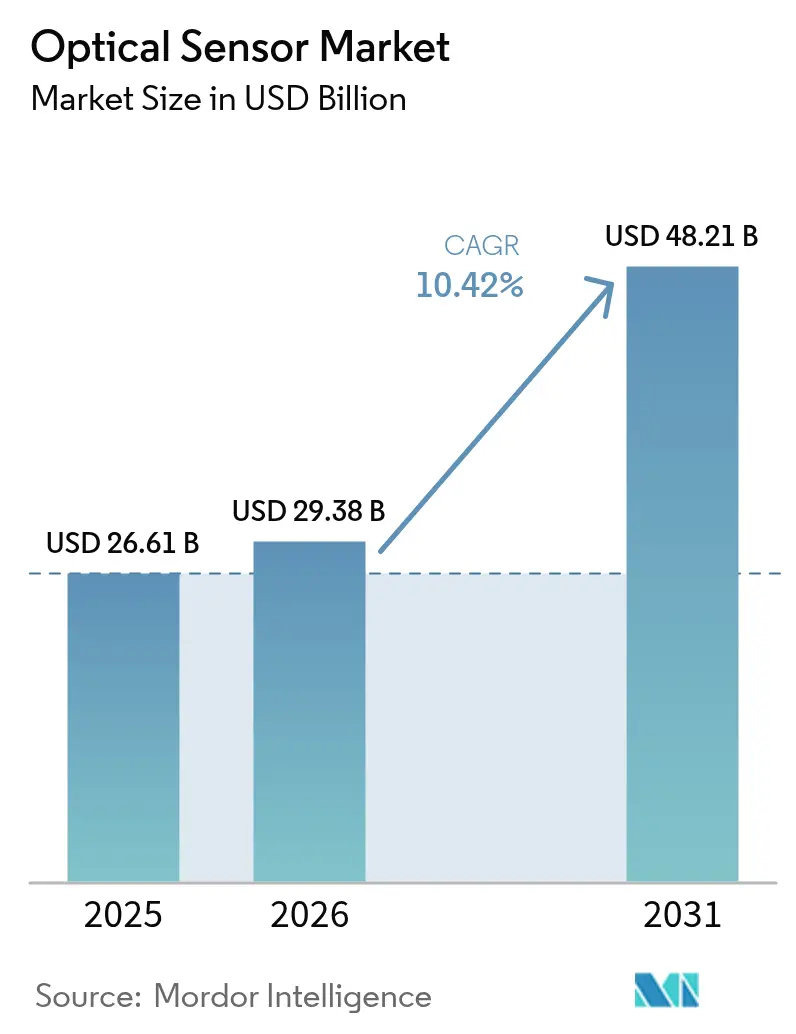
| Market Size (2026) | USD 29.38 Billion |
| Market Size (2031) | USD 48.21 Billion |
| Growth Rate (2026 - 2031) | 10.42 % |
| Fastest Growing Market | Middle East and North Africa |
| Largest Market | Asia Pacific |
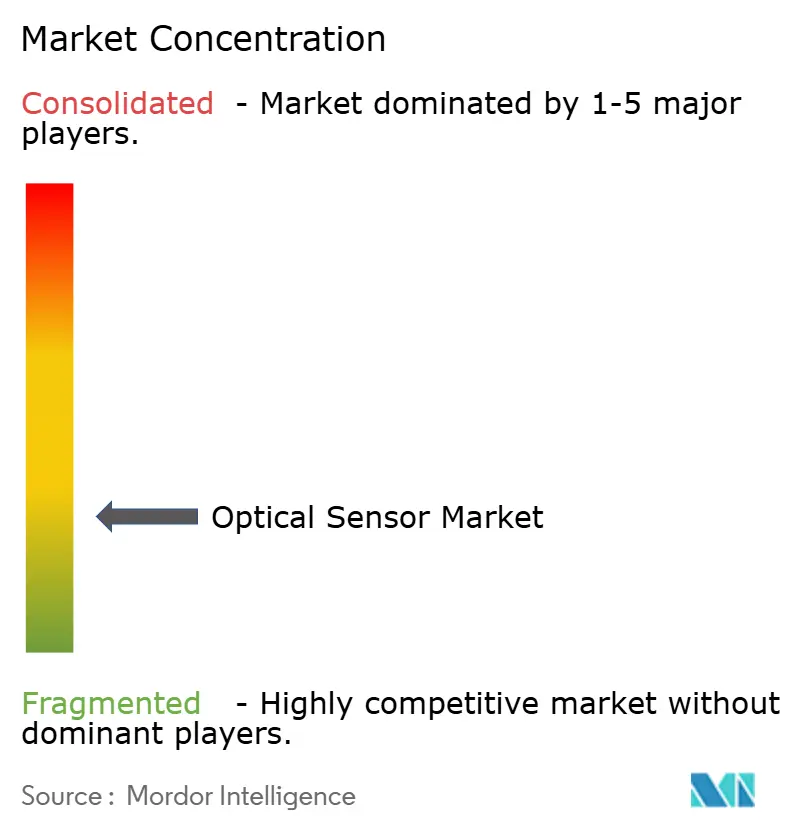
| Market Concentration | Low |
Major Players *Disclaimer: Major Players sorted in no particular order Image © Mordor Intelligence. Reuse requires attribution under CC BY 4.0. | |
Optical Sensor Market Analysis by Mordor Intelligence
The optical sensors market size in 2026 is estimated at USD 29.38 billion, growing from 2025 value of USD 26.61 billion with 2031 projections showing USD 48.21 billion, growing at 10.42% CAGR over 2026-2031. Consistent regulatory pressure on automotive safety, environmental monitoring, and data privacy is steering demand toward integrated, cost-efficient silicon-photonics-based designs. Price drops in wafer-level photonics and the proliferation of AI workloads at the network edge are accelerating sensor adoption in 5G infrastructure, autonomous vehicles, and distributed fiber-optic monitoring. Material-supply risks around high-purity silica and germanium underscore the need for diversified sourcing, while miniaturization requirements in wearables and smartphones continue to shift volume production to Asia-Pacific. Competitive intensity is rising as smaller firms deploy photonic integration to rival long-established semiconductor players. [1]STMicroelectronics, “ST releases first 3D sensor with meta-optics,” Electro Optics, electrooptics.com
Key Report Takeaways
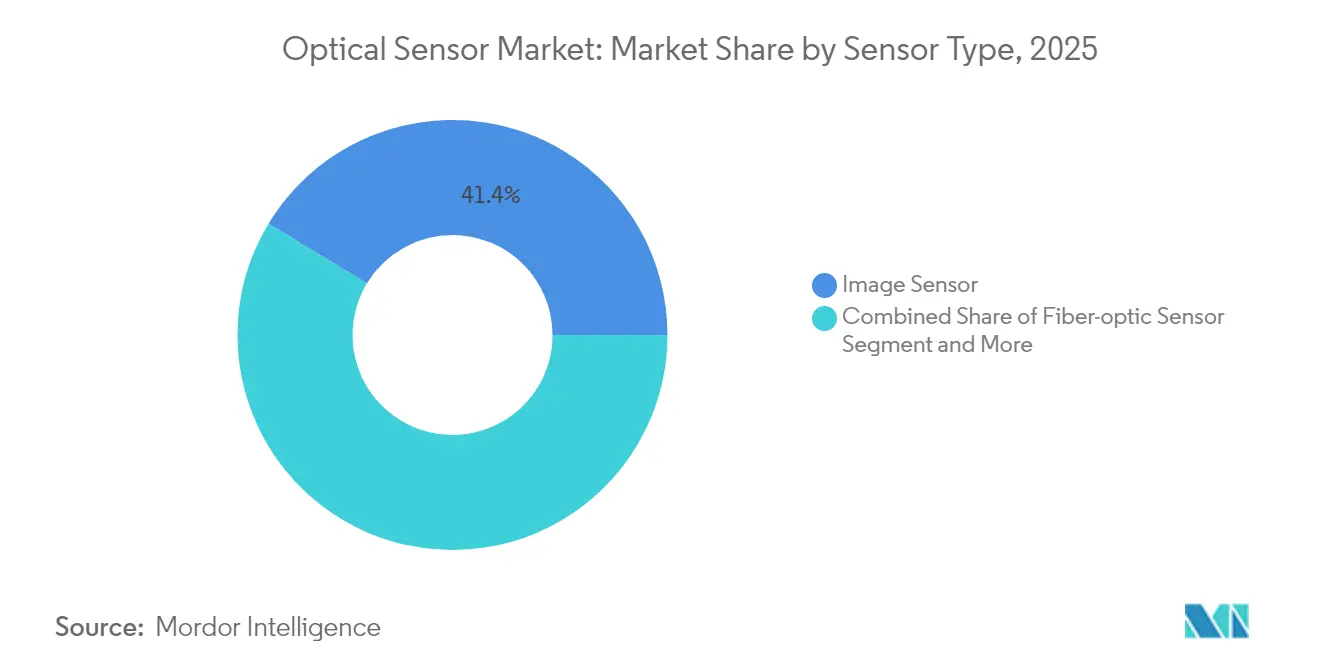
- By sensor type, image sensors led with 41.35% optical sensors market share in 2025; fiber-optic sensors are on track to expand at a 12.05% CAGR through 2031.
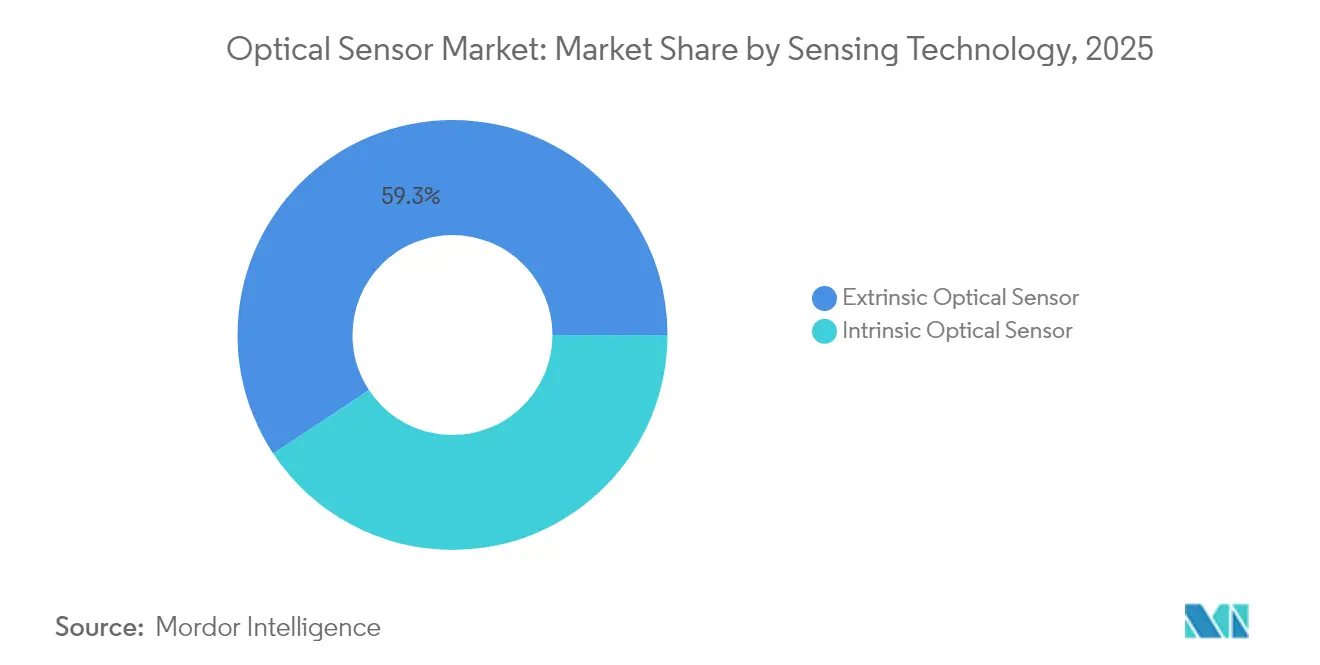
- By sensing technology, extrinsic sensors held 59.30% of the global total in 2025, while intrinsic designs are set to grow at 10.95% through 2031.
- By end-user, consumer electronics accounted for 27.45% of the optical sensors market size in 2025; automotive and transportation are forecast to advance at 13.55% CAGR to 2031.
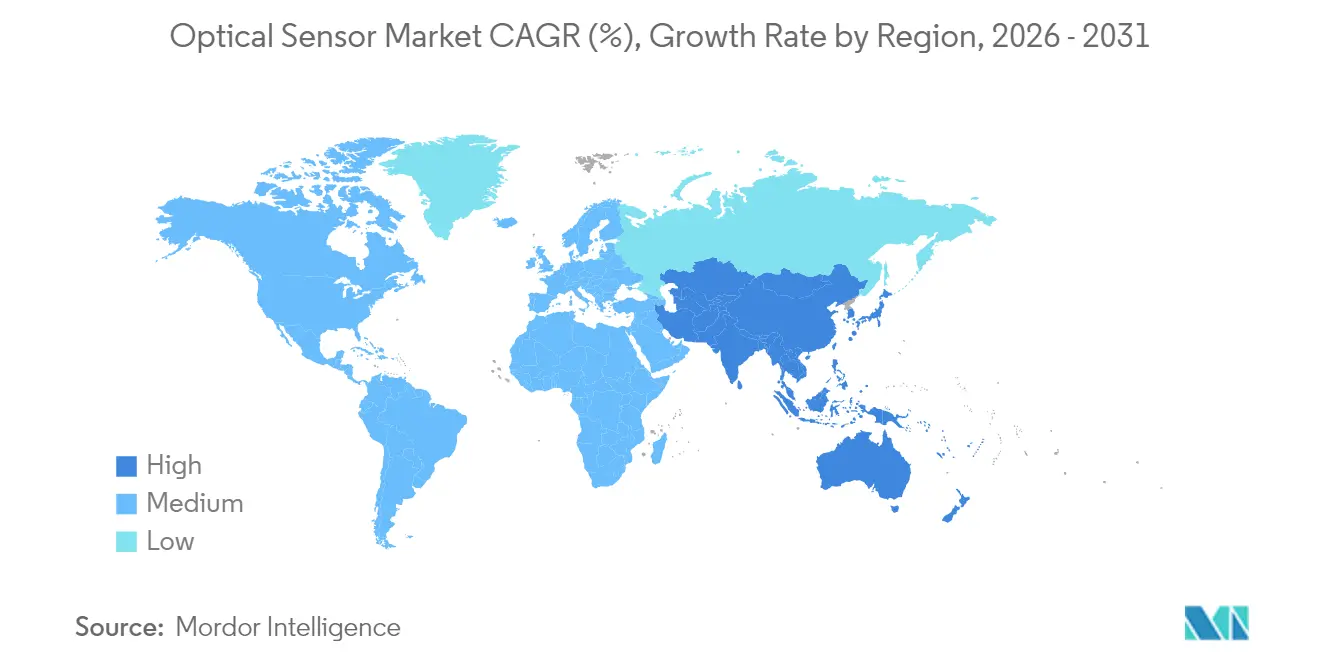
- By geography, Asia-Pacific captured 32.60% revenue share in 2025; the Middle East is expected to register the fastest regional CAGR at 13.05% to 2031.
- Sony, Hamamatsu, and STMicroelectronics collectively controlled below 25% of global shipments, indicating a moderately fragmented landscape.
Note: Market size and forecast figures in this report are generated using Mordor Intelligence’s proprietary estimation framework, updated with the latest available data and insights as of 2026.
Market Trends and Insights
Drivers Impact Analysis of Optical Sensor Market*
| Driver | (~) % Impact on CAGR Forecast | Geographic Relevance | Impact Timeline |
|---|---|---|---|
| Miniaturization Demand for Wearable Optics in APAC Consumer Electronics | 1.80% | APAC core, spill-over to North America | Medium term (2-4 years) |
| Industrial IoT Adoption Fueling Fiber-optic Sensors in Harsh Environments | 2.10% | Global, with concentration in North America & Europe | Long term (≥ 4 years) |
| Automotive ADAS & LiDAR Integration Accelerating NIR Image Sensors in Europe | 1.60% | Europe & North America, expanding to APAC | Medium term (2-4 years) |
| Rapid 5G & Edge-Data-Center Roll-out Requiring High-Speed Optical Sensing | 1.90% | Global, led by North America & APAC | Short term (≤ 2 years) |
| Stricter Environmental-Monitoring Regulations Driving Distributed Fiber Sensing in North America | 1.40% | North America, expanding to Europe | Long term (≥ 4 years) |
| Advances in Silicon Photonics Lowering BOM Cost for Integrated Optical Sensors | 2.20% | Global | Medium term (2-4 years) |
| Source: Mordor Intelligence | |||
Miniaturization Demand for Wearable Optics in APAC Consumer Electronics
AR glasses and smart wearables now require sub-millimeter optical stacks that still meet luminous-efficiency targets. Single-layer meta-optics introduced by STMicroelectronics cut lens height by 70%, permitting under-display proximity sensing in flagship smartphones. Indium-phosphide VCSELs are replacing GaAs emitters, delivering tighter beam divergence for space-constrained devices. APAC contract manufacturers leverage these developments to secure design wins from Western brands, reinforcing the region’s 33% revenue share position.
Industrial IoT Adoption Fuelling Fiber-optic Sensors in Harsh Environments
Distributed fiber sensing provides kilometre-scale temperature and strain data immune to electromagnetic interference, enabling predictive maintenance across refineries, pipelines, and high-voltage substations. Rockwell Automation notes that early-warning analytics on such data can eliminate 30% of unplanned downtime in process industries. Coupling AI-based pattern recognition with continuous optical feedback is becoming a cornerstone of Industry 4.0 strategies in North America and Europe. [3]Theresa Houck, “8 Key Industrial Automation Trends in 2025,” Rockwell Automation, rockwellautomation.com
Automotive ADAS & LiDAR Integration Accelerating NIR Image Sensors in Europe
EU mandates for advanced driver-assistance systems are pushing automakers to adopt 905 nm and 1,550 nm NIR sensors built to withstand −40 °C to +125 °C cycles. STMicroelectronics’ automotive-grade global-shutter imagers now achieve 400 cm range with 60 Hz refresh, supporting real-time 3-D mapping. German OEMs are integrating multi-modal sensor fusion that blends NIR cameras with MEMS-LiDAR, opening a high-margin supply avenue for qualified component vendors.
Advances in Silicon Photonics Lowering Bill-of-Materials Cost for Integrated Optical Sensors
Foundry-scale wafer processing unites photodiodes, waveguides, and readout ASICs on a single die, driving optical sensors market unit costs below USD 10 while raising functional consistency. Ayar Labs’ optical interconnect funding round underscores rising confidence in photonic integration for AI servers. These economics encourage mid-tier suppliers to launch highly integrated digital-output modules that directly interface with microcontrollers, narrowing the gap with incumbent multinationals.
Restraints Impact Analysis of Optical Sensor Market*
| Restraint | (~) % Impact on CAGR Forecast | Geographic Relevance | Impact Timeline |
|---|---|---|---|
| Supply-chain Constraints for High-purity Silica Preforms | -1.70% | Global, acute impact in APAC manufacturing | Short term (≤ 2 years) |
| Price Sensitivity in Low-end Smartphones Limiting Advanced Proximity Sensors | -0.90% | APAC & emerging markets | Medium term (2-4 years) |
| Calibration Complexity of Multi-spectral Sensors Deterring SME Uptake | -0.80% | Global, concentrated in Europe & North America SME markets | Long term (≥ 4 years) |
| Data-Privacy Concerns Around Biometric Optical Sensors in EU | -1.10% | Europe, with spillover to privacy-conscious markets | Medium term (2-4 years) |
| Source: Mordor Intelligence | |||
Supply-Chain Constraints for High-Purity Silica Preforms
Quartz mined from a handful of Appalachian deposits accounts for most global preform feedstock; Hurricane-induced outages in 2024 exposed how a single locale can squeeze optical-fiber availability. Coupled with China’s export restrictions on germanium, manufacturers are negotiating long-term contracts at price premiums, delaying large-volume deployments of distributed fiber solutions. Synthetic-silica start-ups are emerging, but commercial scaling remains two to three years out.
Data-Privacy Concerns Around Biometric Optical Sensors in EU
The EU AI Act classifies facial-recognition and iris-scanning systems as high-risk, mandating on-device processing and extensive risk logs. Implementing privacy-preserving edge analytics raises bill-of-materials cost by 20-30%, squeezing margins for mass-market OEMs. Sensor vendors that can embed secure on-chip template generation are gaining preferred-supplier status among compliance-focused integrators. [2]European Commission, “Proposal for a Regulation laying down harmonised rules on artificial intelligence,” europa.eu
*Our forecasts treat driver/restraint impacts as directional, not additive. The impact forecasts reflect baseline growth, mix effects, and variable interactions.
Optical Sensor Market Segment Analysis
By Sensor Type:
Image Sensors Hold Leadership as Fiber-Optic Momentum BuildsImage sensors retained 41.35% share of the optical sensors market in 2025, buoyed by multi-camera smartphones and ADAS roll-outs. Sony’s stacked CMOS technology pushes 120 fps 4-K capture, meeting machine-vision tolerances for factory automation. Fiber-optic sensors, while smaller in absolute revenue, are forecast to post the highest 12.05% CAGR as infrastructure operators shift toward kilometre-scale structural health monitoring. This traction lifts the optical sensors market size for fiber-optic solutions from USD 4.7 billion in 2025 toward USD 9.27 billion by 2031. Distributed acoustic sensing, pipeline security, and perimeter intrusion systems are the chief volume drivers.
Diversification across photoelectric, ambient light, and proximity sensors remains steady, although ASP erosion pressures component suppliers. Ultra-mini proximity modules like Vishay’s 0.5 mm-thick device cater to bezel-less phone designs, while global-shutter industrial cameras eliminate motion blur in robotic pick-and-place. Multi-spectral imagers within the “Others” bucket are gaining double-digit growth, supporting precision agriculture and food-safety fluorescence assays.



By Component:
Photodetectors Drive Performance DifferentiationCutting-edge photodetectors such as single-photon avalanche diodes (SPADs) and avalanche photodiodes (APDs) sell at premium prices even though they ship in lower volumes than standard photodiodes. SPAD arrays deliver picosecond-level time-of-flight data that LiDAR systems rely on for accurate distance readings in self-driving cars. On the emitter side, design teams are moving from LEDs to VCSELs and edge-emitting lasers to gain higher optical power and tighter spectral control; VCSELs also couple easily into fiber while meeting consumer eye-safety rules.
Optics and filters contribute the most value per gram because their precision coatings and tight tolerances are hard for new entrants to match. Meta-optics is shaking up lens design by replacing multi-element stacks with single, patterned layers that keep performance but trim size and weight. Processing electronics are following the same path: more functions now sit on the sensor die, so edge AI can run locally, cutting latency and easing bandwidth demands.
By Sensing Technology:
Intrinsic Integration Closes the Gap with Extrinsic DesignsExtrinsic configurations, where the fiber guides light to an external transducer, controlled 59.30% of 2025 shipments, but intrinsic devices are accelerating at 10.95% CAGR thanks to silicon-photonics wafer bonding that co-locates detection and processing on a monolithic substrate. That trajectory narrows the performance gap and simplifies calibration, enabling integrated solutions for UAV-borne gas analysis and OEM-installed structural monitoring.
The optical sensors market size for intrinsic devices is projected to reach USD 21.06 billion by 2031, supported by wafer-level testing that boosts throughput and curtails per-lot variance. Extrinsic sensors will retain niches in high-temperature oil-and-gas wells and corrosive chemical reactors, where remote sensing heads shield electronics from hostile conditions. Hybrid designs that switch between intrinsic and extrinsic modes via reconfigurable photonic circuits are beginning to surface in prototype deployments.
By Output:
Digital Integration Accelerates System SimplificationDigital-output sensors are growing faster because they drop straight into microcontrollers and need little or no external analog circuitry. Many now house their own analog-to-digital converters plus basic signal processing, cutting parts count and design time. Features such as programmable gain and thresholds let one device cover multiple jobs without hardware tweaks.
Analog options still matter when systems need continuous readings or microsecond-level response, for example in high-speed control loops. In those settings, skipping digital conversion avoids the latency that could upset system stability. Ultimately, whether designers pick analog or digital hinges on the larger system architecture, not on raw sensor capability.
Geography Analysis
APAC Optical Sensor Market
Asia-Pacific accounted for 32.60% of 2025 revenue, reflecting its tight coupling of component fabs, module assembly, and consumer electronics brands. Contract manufacturers in China and Vietnam now produce proximity-sensor die at sub-USD 0.09 ASP, reinforcing the region’s cost leadership. Japan’s precision optics ecosystem supports automotive LiDAR modules meeting AEC-Q102 grade, while South Korea’s foundries push the envelope on stacked-image-sensor yields.
Europe Optical Sensor Market
Europe’s outlook centers on regulatory-driven applications. German Tier-1 suppliers are booking long-term contracts for NIR imaging arrays that comply with Euro NCAP vision-system mandates. Fiber-optic gas-leak monitoring around North Sea platforms is expanding as EU methane-emissions rules tighten. GDPR compliance is steering OEMs toward on-device biometric analysis, supporting intrinsic sensor adoption.
North America and Middle East Optical Sensor Market
North America continues to test emerging concepts ahead of other regions. Venture funding into photonic start-ups exceeded USD 700 million in 2024-2025, with a focus on edge-AI optical links. Environmental agencies deploy distributed fiber networks for methane quantification, often financed through green-bond issuances. Meanwhile, Saudi Arabia and the UAE are installing hyperspectral camera arrays across smart-city projects, driving the Middle East’s 13.05% CAGR outlook.

Regulatory Landscape
Optical sensor design, qualification, and market access are shaped by a mix of safety, quality, and trade rules across end-use sectors. In standards, 2026 updates tightened compliance anchors for optical platforms used in communications and sensing: CENELEC published EN IEC 60825-12:2026 covering safety of laser-based free space optical communication systems (linked to EU Directives 2014/35/EU and 2014/53/EU), and IEC published IEC 61757:2026, updating generic test methods and classification for fibre optic sensors and superseding the 2018 edition. For networking-oriented optical links, ISO/IEC/IEEE 8802-15-7:2025 (short-range optical wireless communications) adds another reference point for suppliers building optical modules around image sensors and short-reach links.
Cross-border supply and medical/biometric use cases add further compliance layers. The US Federal Register action on adjusting imports of semiconductors and derivative products (Proclamation 2026-01052) introduced a 25% ad valorem duty on specified semiconductor imports in January 2026, while USTRs December 2025 Section 301 notice set an initial 0% tariff treatment for certain actions effective December 23, 2025, with a scheduled rate adjustment in June 2027. In healthcare manufacturing, the US FDA implemented the Quality Management System Regulation (QMSR) in February 2026, aligning medical device quality systems with ISO 13485:2016, which raises documentation and process-control expectations for optical sensing components incorporated into regulated medical devices.
Value Chain Analysis
The optical sensor value chain begins with materials and substrates (high-purity silica for fiber and preforms, photonics-grade silicon and silicon-on-insulator wafers, germanium for certain IR components), then moves through device fabrication (CMOS image sensors, photodiodes/APDs/SPADs, VCSELs/laser emitters), optics and filter manufacturing, and module assembly with processing electronics (often integrating ADC and on-die processing for digital-output sensors). It concludes with system integration into end-use platforms across consumer electronics, industrial automation, automotive/transportation, healthcare/medical devices, and energy and environmental monitoring, with distribution split between direct OEM supply, Tier-1 automotive supply chains, industrial automation channel partners, and specialized integrators for fiber sensing deployments.
Supply concentration and packaging capacity are persistent leverage points. Photonics-grade SOI supply is highly concentrated (with Soitec cited as holding more than 90% share), and InP wafer supply is dominated by a small set of producers (Sumitomo Electric, JX Advanced Metals, and AXT collectively controlling most supply), while laser output for AI data center optics is concentrated among a handful of vendors (including Lumentum and Coherent). The midstream is increasingly shaped by foundry and packaging coordination as co-packaged optics and photonic integration scale, raising the importance of advanced manufacturing partners such as Fabrinet for optical/photonics contract manufacturing and packaging, and electronics manufacturing services for volume builds. Recent chain-shaping actions include Sonys May 2026 memorandum of understanding with TSMC for next-generation image sensor development and manufacturing at Sonys Japan fab, and Ousters June 2026 expansion of its manufacturing partnership with Benchmark Electronics to scale production of its lidar sensor family.
Competitive Landscape
The playing field remains moderately fragmented. Sony holds leadership in smartphone imaging, Hamamatsu dominates scientific photomultiplier tubes, and STMicroelectronics is scaling silicon-photonics TOF modules. However, their combined shipments account for less than one-quarter of the optical sensors market, leaving room for niche disruptors. Integrated-photonic start-ups leverage foundry access and AI-acceleration blocks to address emerging needs such as chip-to-chip optical links and in-situ environmental analytics.
Strategic activity favours acquisition over greenfield R&D. Teledyne’s purchase of Excelitas’ aerospace division broadens space-qualified sensing portfolios, while the Hamamatsu-NKT Photonics merger secures laser-source supply continuity. Partnerships between sensor players and AI-edge-compute vendors aim to deliver turnkey modules for autonomous vehicles and industrial robots. Branding now emphasizes security-by-design to satisfy privacy regulations.
Pricing pressure persists at the low end, particularly in analog photoelectric devices, yet the integrated-digital segment enjoys stable margins linked to system-level savings. Suppliers with captive wafer fabs and optics-coating lines retain resilience against raw-material fluctuations, whereas fab-less firms focus on differentiated design IP and flexible supply agreements.
Optical Sensor Industry Leaders
Sony Group Corporation
ams-OSRAM AG
Hamamatsu Photonics K.K.
ON Semiconductor Corp.
Keyence Corporation
- *Disclaimer: Major Players sorted in no particular order
Optical Sensor Market Companies Covered in this Report
- ams-OSRAM AG
- Sony Group Corporation
- Hamamatsu Photonics K.K.
- ON Semiconductor Corp.
- ROHM Co., Ltd.
- SICK AG
- Keyence Corporation
- Teledyne Technologies Inc.
- STMicroelectronics N.V.
- Vishay Intertechnology Inc.
- Honeywell International Inc.
- IFM Electronic GmbH
- Pepperl + Fuchs SE
- Rockwell Automation Inc.
- Samsung Electronics Co. Ltd.
- Cognex Corporation
- FLIR Systems (Teledyne FLIR)
- Omnivision Technologies Inc.
- Lumentum Holdings Inc.
- Excelitas Technologies Corp.
- Thorlabs, Inc.

Market Opportunities and Future Outlook
Opportunities are forming around tighter integration of sensing, processing, and system software, particularly where optical sensors feed real-time perception and analytics. Consolidation and portfolio expansion highlight whitespace in multimodal sensing stacks that combine vision with other modalities and on-device intelligence: indie Semiconductor signed a definitive agreement in May 2026 to acquire the fabless CMOS image sensor group from ams OSRAM (EUR 40 million) to strengthen multimodal sensing for industrial and physical AI applications, and onsemi announced an agreement in June 2026 to acquire Synaptics to expand edge AI compute and intelligent systems capabilities. For suppliers, this raises demand for optical sensors that present calibrated, digital outputs and are designed for tight coupling with embedded AI pipelines, not only discrete components.
Manufacturing capacity and ecosystem tooling are also shifting where new programs can be pursued. Tower Semiconductor announced in July 2026 a USD 3 billion dual-track strategic expansion in Japan, supported by a USD 1 billion grant from the Ministry of Economy, Trade and Industry, targeting 300mm silicon photonics, silicon germanium, and advanced packaging for data center demand, reinforcing a pathway for higher-volume photonic integration and packaging. On the adoption side, Luxonis announced in July 2026 native support for OAK cameras in NVIDIA Isaac Sim and Isaac Lab, accelerating simulation-first development workflows for robotics and physical AI and making virtual sensor integration a nearer-term gate for design wins. Together these moves support clearer entry points for sensor vendors: integrated silicon photonics and advanced packaging capacity, plus developer ecosystems that lower integration friction for machine vision and edge robotics deployments.
Recent Industry Developments in Optical Sensor Market
- July 2026: Tower Semiconductor announced a USD 3 billion dual-track strategic expansion in Japan, supported by a USD 1 billion grant from the Ministry of Economy, Trade and Industry, targeting 300mm silicon photonics, silicon germanium, and advanced packaging. The move adds capacity and packaging capability that directly constrains scaling of integrated optical sensors and optical interconnect building blocks. It also signals deeper alignment between government incentives and photonics-oriented manufacturing roadmaps.
- May 2026: ams-OSRAM signed an agreement to divest its CMOS Image Sensor (CIS) business to indie Semiconductor Inc. for EUR 40 million. The transaction sharpens ams-OSRAMs focus on digital photonics while giving indie a dedicated image-sensor capability to bolster multimodal sensing offerings for industrial and physical AI applications. The asset shift also changes competitive positioning for automotive and industrial imaging supply chains that rely on specialized CIS know-how.
- October 2025: Sony Semiconductor Solutions announced the IMX775 CMOS RGB-IR image sensor for in-cabin monitoring cameras, pairing 2.1 um pixels with about 5 effective megapixels and scheduling mass production for spring 2026. This product direction reinforces the push toward compact, NIR-capable sensors that serve driver and occupant monitoring requirements in automotive. It also tightens performance benchmarks for sensor vendors addressing ADAS-adjacent camera stacks.


Optical Sensor Market Report Scope and Research Methodology
Market Definition and Coverage
This market is defined as revenue generated from optical sensor products that detect light, color, proximity, position, or similar signals and convert them into a usable electrical output for end-use applications.
Scope exclusions: Software-only analytics, general lighting products, and standalone optical components that are not sold as sensors are excluded.
Segments Covered in This Report
- By Sensor Type
- Image Sensor
- Fiber-optic Sensor
- Photoelectric Sensor
- Ambient Light & Proximity Sensor
- Others (Position, Touch, Multi-spectral)
- By Sensing Technology
- Extrinsic Optical Sensor
- Intrinsic Optical Sensor
- By Component
- Photodetectors (Photodiodes, APDs, SPADs)
- Light Sources (LED, VCSEL, Laser)
- Optics and Filters
- ICs and Processing Electronics
- By Wavelength
- Ultraviolet (100-400 nm)
- Visible (400-700 nm)
- Near-Infrared (700-1400 nm)
- Short-Wave IR / Mid-IR (>1400 nm)
- By Output
- Analog
- Digital
- By End-user Application
- Consumer Electronics
- Industrial Automation and Robotics
- Automotive and Transportation
- Healthcare and Medical Devices
- Biometrics and Security
- Aerospace and Defense
- Energy and Environmental Monitoring
- By Geography
- North America
- United States
- Canada
- Mexico
- Europe
- United Kingdom
- Germany
- France
- Italy
- Rest of Europe
- Asia-Pacific
- China
- Japan
- India
- South Korea
- Rest of Asia-Pacific
- Middle East
- Israel
- Saudi Arabia
- United Arab Emirates
- Turkey
- Rest of Middle East
- Africa
- South Africa
- Egypt
- Rest of Africa
- South America
- Brazil
- Argentina
- Rest of South America
- North America
Data Sources, Market Sizing, and Validation
Desk Research
Desk research was used to build the initial demand and supply picture before modeling started, especially around where optical sensors are being adopted and how quickly end markets are growing. We typically begin with public datasets and standards references, and then map them back to application areas such as consumer devices, vehicles, industrial equipment, and medical instruments.
Sources used include US Census and international trade statistics for electronics and sensor-related categories, OECD and World Bank macro indicators, USITC and UN Comtrade style trade series, IEEE and other peer-reviewed journals for technology shifts, and patent databases to understand innovation intensity and direction. Company filings, investor presentations, earnings call notes, and association websites were also reviewed to understand mix changes (for example, image sensors versus fiber optic sensors) and typical pricing movements. In a few places, paid subscriptions for company financials and a patent database view helped speed up verification and cross-check the public trail. The desk sources listed here are indicative and not exhaustive, and many additional public sources were reviewed for data collection, validation, and clarification.
Primary Interviews and Surveys
Primary work was used to pressure-test assumptions that are hard to confirm from public sources, such as the split of demand by application, typical ASP erosion patterns, and the timing of adoption in new device generations. Interviews covered component-side participants, channel stakeholders, and end-user engineering and procurement roles across major regions, so the inputs were not driven by one geography or one use case.
Distribution of primary research fieldwork respondents
| Company type | Respondent position | Region |
|---|---|---|
| Top tier: 38% | CXOs: 12% | APAC: 46% |
| Mid tier: 47% | Functional/Unit leaders: 32% | EMEA: 31% |
| Smaller Players: 15% | Managers: 56% | Americas: 23% |
Market-Sizing & Forecasting
Market sizing was built using top-down and bottom-up logic together, so the totals are anchored to real-world demand signals and then checked from the supply side. The top-down view starts from electronics and device production and trade signals, then reconstructs sensor demand using penetration rates by application (such as proximity sensing in smartphones, optical sensing in industrial automation, and sensing content per vehicle).
To corroborate totals, selective bottom-up approximations were used where public disclosures exist, such as supplier revenue mapping, sampled ASP x shipment volume checks for key sensor families, and channel feedback on run-rate orders. Where full supplier coverage is not visible, gaps were handled by using conservative expansion factors based on application-level adoption and regional manufacturing mix, and then re-tested in primary discussions.
Forecasting uses scenario analysis supported by regression-style relationships between demand drivers and sensor shipments, followed by expert review of inflection points. Inputs tracked include smartphone and wearables unit trends, vehicle production and ADAS feature fitment, industrial automation spending cycles, medical device build rates, and expected ASP movement as volumes scale and integration increases. After assumptions were finalized, yearly values were rolled forward with consistent currency timing to avoid artificial jumps from conversion effects.
Data Validation & Update Cycle
Outputs were validated through multiple checks so outliers are caught early and corrected with evidence. Analysts compared modeled totals against independent signals such as regional electronics output, device shipment direction, and application adoption patterns, and then reviewed variances in a separate pass before sign-off.
When large deviations showed up at a segment or regional level, follow-up outreach was triggered to re-check the input that caused the swing, such as penetration, pricing, or application mapping. Reports are refreshed annually, with interim updates when material events occur that can shift volumes or pricing. Before delivery, a final review is completed so the published view reflects the latest available data and assumptions.
Mordor Intelligence's Optical Sensors Market Size Compared Against Other Published Estimates
Different published values for optical sensors can still be reasonable because the totals depend on what is counted as a sensor, which applications are included, and which year is treated as the starting point. Currency conversion timing and how ASP changes are handled also matter, because even small pricing assumptions can move a revenue-based market noticeably.
Optoelectronic components that are not sold as sensors (such as general emitters used for illumination) sit outside Mordor Intelligence's scope, which is a frequent reason some totals run higher when adjacent components are bundled into the same bucket. Differences also come from whether the model starts from device demand indicators with penetration assumptions, or whether it leans more heavily on supplier roll-ups that can miss private revenue or double-count channel resales in fast-moving consumer electronics cycles.
Benchmark comparison
| Source | Market Size | Gaps in Research Methodology |
|---|---|---|
| Mordor Intelligence | USD 29.38 B (2026) | |
| Global Research Publisher A | USD 28.07 B (2024) | Uses an earlier base year and a different forecast window, and the scope discussion is less explicit on whether adjacent optoelectronic components and modules are excluded from sensor revenue. |
| Industry Research Portal B | USD 26.69 B (2024) | Anchors sizing to a 2024 base and applies broad segment roll-ups by type and region, which can under-state application-driven uptake when penetration changes quickly across devices and vehicles. |
Overall, the spread is mainly explained by scope edges and base-year differences, followed by how pricing and penetration are updated year to year. By tying the model to observable device and industrial demand indicators and then checking totals with targeted supplier and channel inputs, the sizing stays traceable and repeatable even when public disclosures are incomplete.


Key Questions Answered in the Report
What is the current size of the optical sensors market?
The optical sensors market size reached USD 29.38 billion in 2026 and is forecast to hit USD 48.21 billion by 2031.
Which sensor type is growing fastest?
Fiber-optic sensors are projected to grow at 12.05% CAGR through 2031, the highest among all sensor categories.
Why are silicon-photonics-based sensors gaining traction?
Wafer-level photonic integration cuts per-unit cost below USD 10 while combining detection, signal routing, and processing on the same die, enabling affordable high-performance modules.
How is regulation shaping demand in Europe?
EU safety rules accelerate adoption of NIR image sensors for ADAS, and GDPR/AI Act provisions are pushing on-device biometric processing, favouring integrated optical designs.
Which region will grow fastest through 2031?
The Middle East leads regional growth with a 13.05% CAGR, driven by smart-city infrastructure and security deployments.
What is the main supply-chain risks?
High-purity silica and germanium shortages pose short-term constraints, necessitating diversification into synthetic silica and alternative IR detector materials.
Page last updated on:





