Market Overview
| Study Period | 2021 - 2031 |
|---|---|
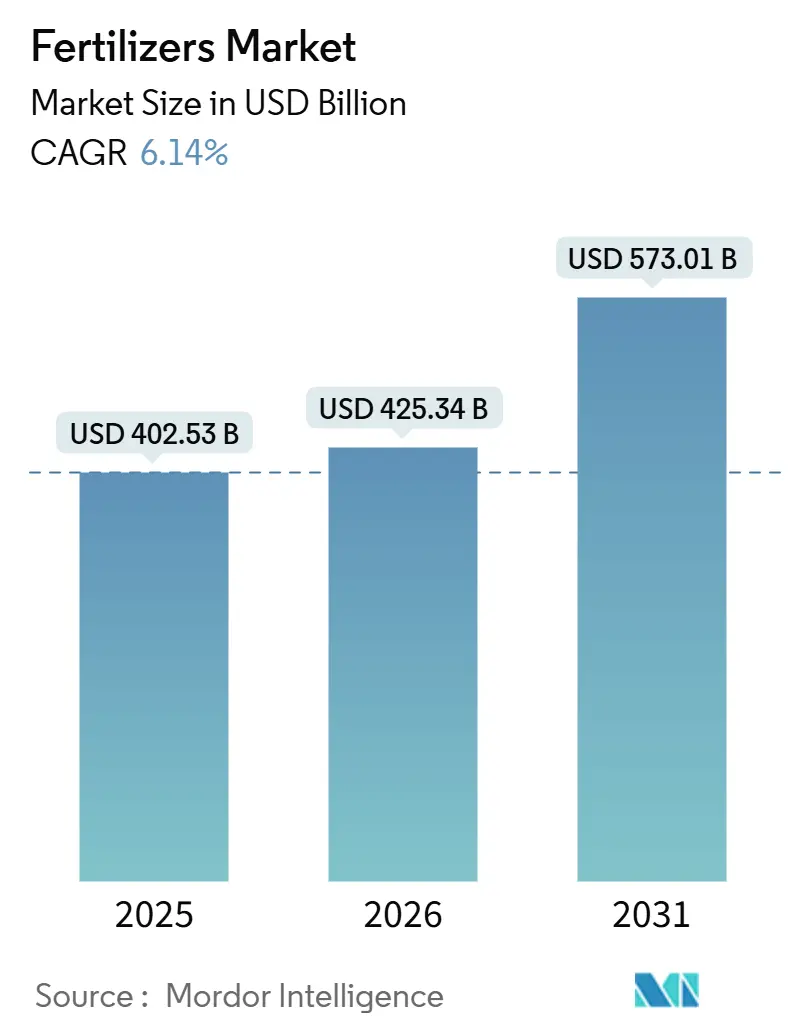
| Market Size (2026) | USD 425.34 Billion |
| Market Size (2031) | USD 573.01 Billion |
| Growth Rate (2026 - 2031) | 6.14% CAGR |
| Fastest Growing Market | Africa |
| Largest Market | Asia-Pacific |
| Market Concentration | Medium |
Major Players*Disclaimer: Major Players sorted in no particular order Image © Mordor Intelligence. Reuse requires attribution under CC BY 4.0. |
|
Fertilizers Market Analysis by Mordor Intelligence
The fertilizers market size is projected to expand from USD 402.53 billion in 2025 and USD 425.34 billion in 2026 to USD 573.01 billion by 2031, registering a CAGR of 6.14% between 2026 and 2031. Steady gains stem from the convergence of precision-agriculture deployment, climate-smart policy mandates, and capacity additions in natural-gas-rich regions that lower production costs. Asia-Pacific continues to anchor global demand on the strength of intensive cereal cultivation in China and India. Meanwhile, Africa records the fastest regional growth as governments subsidize fertilizer access to raise food security. On the supply side, new ammonia and phosphate projects in Saudi Arabia, the United Arab Emirates, and the United States are rebalancing trade flows and intensifying price competition. Digital agronomy is further reshaping competitive strategies because variable-rate platforms lower nutrient waste and document compliance with environmental rules, placing a premium on controlled-release and liquid formulations that integrate seamlessly with precision equipment.
Key Report Takeaways
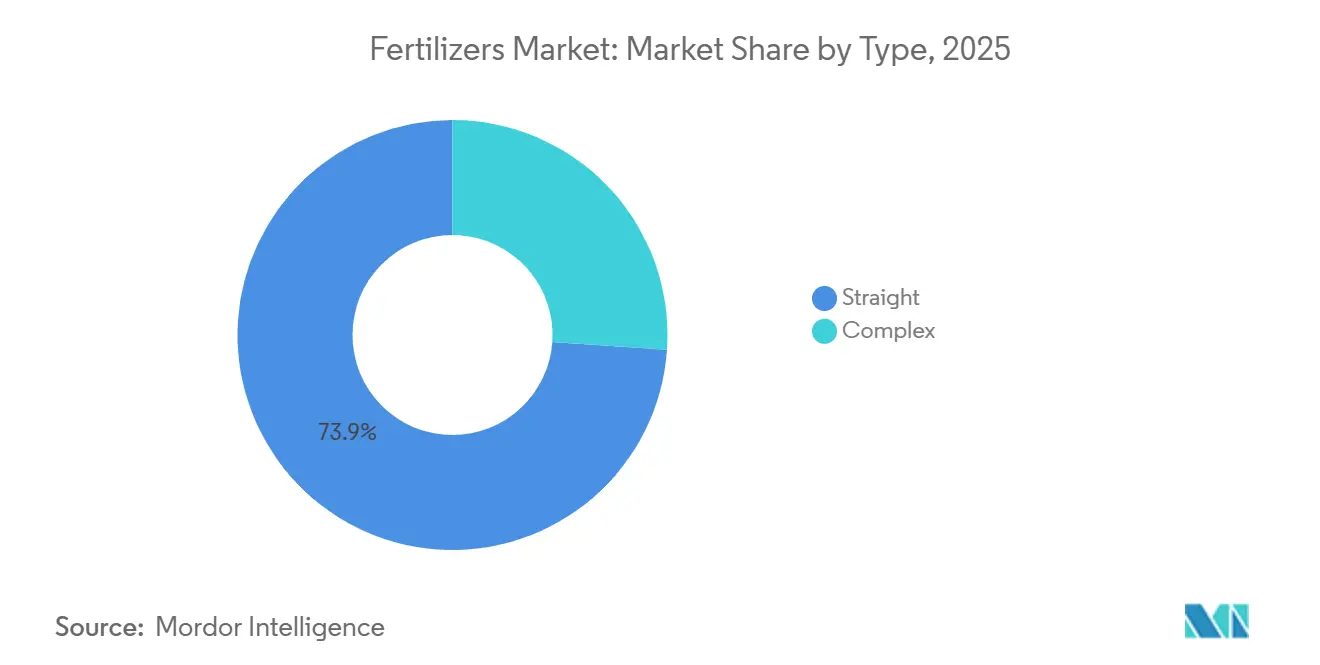
- By type, straight fertilizers commanded 73.9% of the fertilizers market share in 2025 and recorded the fastest growth at a 6.2% CAGR through 2031.
- By form, conventional fertilizers accounted for 88.5% of the fertilizers market size in 2025, while specialty fertilizers are projected to advance at 6.3% CAGR to 2031.
- By application mode, soil application held 89.0% of global use in 2025, whereas fertigation is forecast to register 6.3% CAGR between 2026 and 2031.
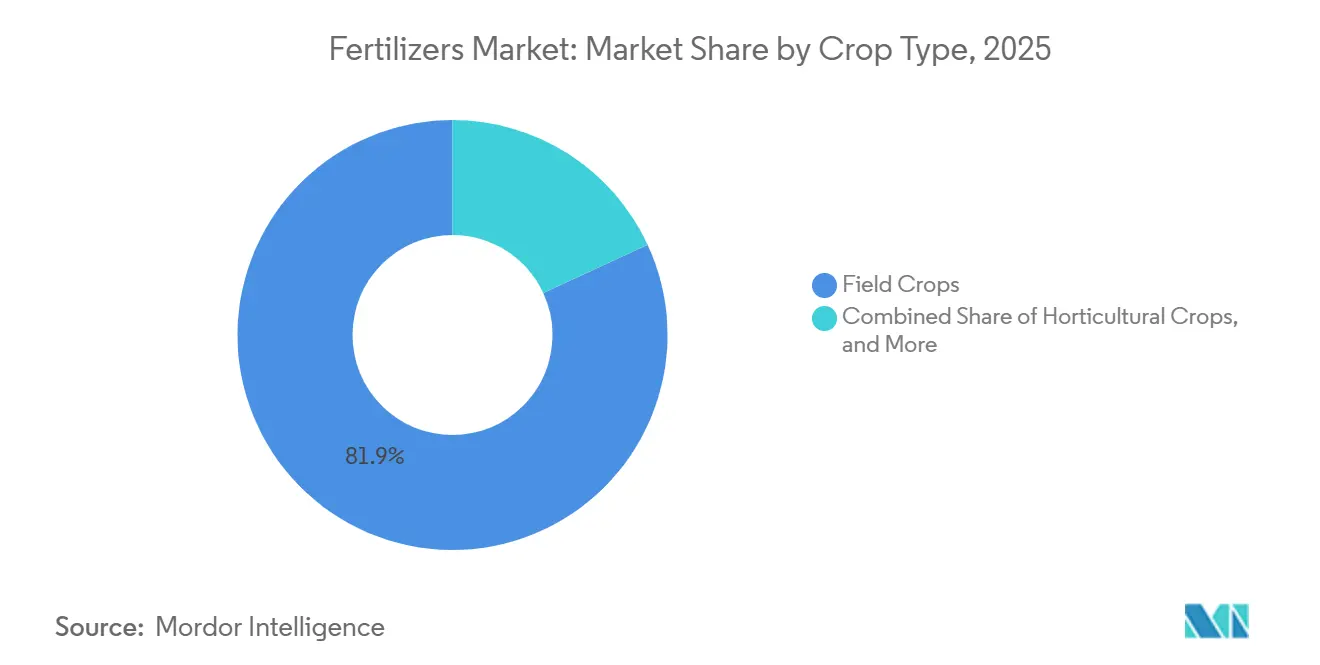
- By crop type, field crops represented 81.9% of 2025 sales, and horticultural crops are projected to post the highest growth at 7.2% CAGR through 2031.
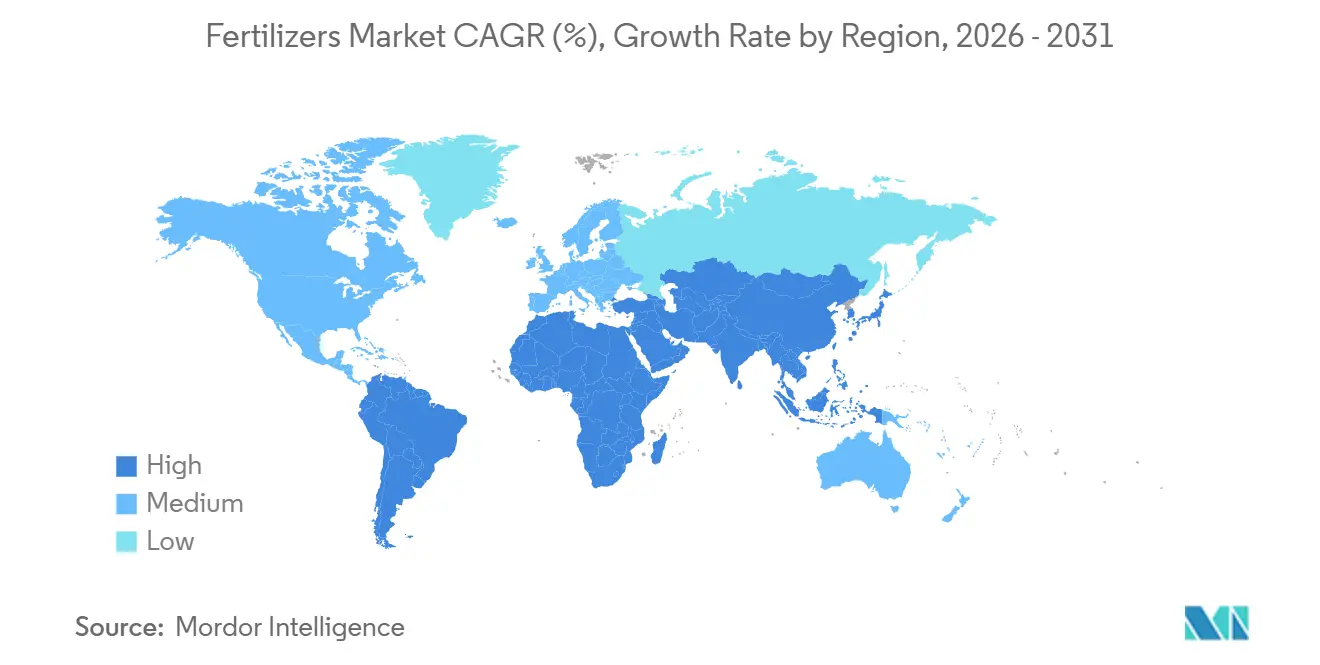
- By geography, Asia-Pacific captured a 43.9% share of the fertilizers market in 2025, while Africa are set to surge at a 7.3% CAGR through 2031.
- Market concentration is medium with top five players Nutrien Ltd., The Mosaic Company, ICL Group Ltd., CF Industries Holdings, Inc., and Yara International ASA holding the significant market share in 2025.
Note: Market size and forecast figures in this report are generated using Mordor Intelligence’s proprietary estimation framework, updated with the latest available data and insights as of January 2026.
Global Fertilizers Market Trends and Insights
Drivers Impact Analysis
| Driver | (~) % Impact on CAGR Forecast | Geographic Relevance | Impact Timeline |
|---|---|---|---|
| Surge in fertilizer demand from precision-agriculture projects | +0.8% | North America, Western Europe, and expanding in Asia-Pacific | Medium term (2-4 years) |
| Transition to climate-smart nutrient-management policies | +0.6% | European Union, North America, and selected Asia-Pacific markets | Long term (≥ 4 years) |
| Rapid adoption of specialty and slow-release formulations | +1.0% | North America, Europe, and high-value crop zones in Asia-Pacific | Medium term (2-4 years) |
| Capacity expansions in low-cost natural-gas regions | +0.5% | Middle East, Gulf Coast United States, and Russia | Short term (≤ 2 years) |
| Carbon-credit incentives for green ammonia production | +0.6% | Europe, North America, and Australia | Long term (≥ 4 years) |
| Artificial intelligence enabled variable-rate application platforms | +0.7% | North America, Europe, and core Asia-Pacific markets | Medium term (2-4 years) |
| Source: Mordor Intelligence | |||
Understand The Key Trends Shaping This Market
Download PDF
Surge in Fertilizer Demand from Precision-Agriculture Projects
Precision agriculture integrates global navigation satellite systems, soil sensors, and machine-learning algorithms to apply nutrients only where and when crops need them. This targeted approach reduces nitrogen use per bushel in United States corn trials, saving money and cutting nitrous oxide emissions. Adoption accelerates where farm consolidation and reliable connectivity support large machinery fleets fitted with variable-rate controllers. As equipment manufacturers embed agronomic software in sprayers and spreaders, growers seek controlled-release and liquid fertilizers that match site-specific prescriptions. The resulting pull effect spurs a steady rise in specialty nutrient demand across North America and Western Europe, with early signs of replication in China and Brazil. Evidence of payback within two seasons strengthens the investment case for smaller producers, widening the total addressable market for digital agronomy and nutrient combinations tailored to micro-zones.
Transition to Climate-Smart Nutrient-Management Policies
Governments embed nutrient stewardship in climate commitments because both fertilizer production and field emissions contribute significantly to agricultural greenhouse gas emissions. The European Union Farm to Fork Strategy targets a 20% cut in fertilizer use by 2030, while India promotes balanced fertilization under the National Mission for Sustainable Agriculture[1]Source: European Commission, “Farm to Fork Strategy,” European Commission, ec.europa.eu. Such mandates elevate demand for nitrification inhibitors, urease inhibitors, and polymer-coated urea that slow nutrient release and curb volatilization. China’s guidelines require soil testing before fertilizer purchase, accelerating the shift from blanket doses to precision prescriptions. Producers capable of supplying enhanced-efficiency products gain pricing power, whereas commodity-grade volume faces downward pressure in regulated regions. Over the long term, harmonized carbon accounting may further differentiate suppliers on embedded emissions, reinforcing the strategic value of low-carbon nitrogen routes.
Rapid Adoption of Specialty and Slow-Release Formulations
Specialty fertilizers combine nutrient efficiency with labor savings, allowing growers to match nutrient availability to crop uptake and to reduce field passes. In 2025, Iowa State University developed a patented biochar-based slow-release nitrogen fertilizer designed to reduce agricultural runoff and enhance crop efficiency. This technology converts biomass into a stable, nutrient-retaining, and durable fertilizer pellet, aiming to align nutrient release with plant growth requirements. Liquid formulations thrive in North America and Europe because they integrate with large sprayer fleets and provide uniform coverage. Water-soluble fertilizers dominate fertigation systems, particularly in arid zones, given their complete dissolution and precise dosing. Rising labor costs and tighter nutrient caps reinforce the shift to controlled-release products despite price premiums. Manufacturers expanding coating, chelation, and dispersion technologies stand to capture margin because such value-added formats resist pure commodity pricing.
Artificial Intelligence Enabled Variable-Rate Application Platforms
Artificial intelligence systems synthesize weather data, soil chemistry, and crop growth models to deliver field-level prescriptions that raise nutrient-use efficiency. In 2025, Ethiopia launched the "Regional Scale Crop Fertilization Response Trial Database for Ethiopia," transitioning from generalized fertilizer recommendations to data-driven, site-specific nutrient management (SSNM). This initiative aimed to improve crop productivity, resulting in wheat yields increasing by 25-38%. By utilizing artificial intelligence and Decision Support Tools (DST), the approach minimizes waste, enhances efficiency, and contributes to higher farmer incomes and improved agricultural sustainability[2]Source: African Plant Nutrition Institute (APNI), "Code in the Crops: How AI Is Revolutionizing Fertilizer Use in Ethiopia," apni.net. The Mosaic Company’s satellite imagery service predicts phosphorus and potassium deficiencies up to a month before visual symptoms appear, enabling proactive treatment that preserves yield. Continuous feedback loops from sensors embedded in machinery generate proprietary data sets, reinforcing user loyalty and informing product refinements. As connectivity extends to mid-scale growers in Brazil and Ukraine, artificial-intelligence tools support incremental demand for specialty blends calibrated to algorithmic rate maps.
Restraints Impact Analysis
| Restraint | (~) % Impact on CAGR Forecast | Geographic Relevance | Impact Timeline |
|---|---|---|---|
| Volatile feedstock prices | −0.7% | Import-dependent regions worldwide | Short term (≤ 2 years) |
| Regulatory caps on nitrogen usage in Europe | −0.5% | European Union and other Organisation for Economic Cooperation and Development markets | Medium term (2-4 years) |
| Growing organic farming acreage | −0.3% | Europe, North America, and selected Asia-Pacific markets | Long term (≥ 4 years) |
| Scarcity of water for fertigation in arid regions | −0.4% | Middle East, North Africa, parts of South Asia and South America | Medium term (2-4 years) |
| Source: Mordor Intelligence | |||
Growing Organic Farming Acreage
The expansion of organic farming acreage is substantially decreasing the demand for synthetic nitrogen-based fertilizers while increasing the demand for organic fertilizers, biofertilizers, and compost. As consumer preference for organic produce rises, certified farmland grows and prohibits synthetic nutrient inputs. The European Union Organic Action Plan (2021–2030) serves as a fundamental component of the Farm to Fork Strategy, aiming to achieve a target of at least 25% of agricultural land under organic farming by 2030[3]Source: European Commission, “Organic Action Plan,” European Commission, ec.europa.eu. Organic agriculture is practiced in 188 countries, with over 96 million hectares of agricultural land managed organically by at least 4.5 million farmers as of 2024[4]Source: Food and Agriculture Organization of the United Nations (FAO), "The World of Organic Agriculture 2024," fao.org. Each converted hectare removes volume from the addressable market for chemical fertilizers, constituting a structural headwind that technology cannot offset. Although organic farms often yield less per hectare, their premium pricing sustains the acreage trend and dampens long-term demand in high-income regions.
Scarcity of Water for Fertigation in Arid Regions
Fertigation success depends on reliable water availability. Israel imposed agricultural water quotas in 2024 after the Sea of Galilee hit multi-decade lows, forcing a shift toward drought-tolerant crops with lower nutrient needs. India’s western states restrict borewell drilling and electricity for pumps, limiting irrigation hours and curbing demand for water-soluble fertilizers. North Africa prioritizes urban and industrial users, leaving agriculture to cope with reduced allocations. These dynamics moderate the otherwise rapid adoption of fertigation systems, constraining the growth potential of specialty fertilizers in the driest geographies.
Segment Analysis
By Type: Straight Fertilizers Anchor Global Volume
Straight fertilizers are the largest type segment and accounted for 73.9% of the fertilizers market share in 2025 and are forecast to grow at a 6.2% CAGR through 2031. Urea, the largest segment within nitrogenous fertilizers, is favored for its high nitrogen content (46%) and versatility in broadcast, fertigation, and foliar applications. This makes it a preferred option for rice, wheat, and maize farmers in the Asia-Pacific and South America. In the phosphatic fertilizer category, diammonium phosphate and monoammonium phosphate dominate due to their balanced nitrogen-phosphorus (N-P) ratios and rapid soil solubility, which promote early-season root development. Indian Farmers Fertiliser Cooperative Limited recorded a 6% rise in urea sales in 2025, following government support programs that capped retail prices. Integrated producers in China and Russia retain scale advantages that ensure a steady supply, especially during seasonal peaks.
Complex fertilizers, which combine multiple nutrients into a single granule, account for the remaining market share and appeal to farmers seeking convenience and balanced nutrition without the need to mix separate products. NPK blends dominate this category, with formulations designed to address regional soil deficiencies and specific crop needs. Micronutrient-fortified complexes are gaining traction in areas with documented deficiencies in zinc, boron, or iron, which can limit yield potential even when macronutrient levels are sufficient. Secondary macronutrients such as calcium, magnesium, and sulfur are increasingly included in complex formulations due to their role in enhancing nitrogen-use efficiency and improving stress tolerance. The adoption of complex fertilizers is particularly notable in regions with fragmented landholdings and limited access to agronomic guidance, where pre-blended solutions help minimize the risk of imbalanced nutrient application and streamline procurement processes.
Note: Segment shares of all individual segments available upon report purchase
Get Detailed Market Forecasts at the Most Granular Levels
Download PDF
By Form: Specialty Formulations Capture Premium Segments
Conventional fertilizers are the largest form and account for 88.5% of the fertilizers market size in 2025, yet growers in regulated regions are gradually shifting to enhanced-efficiency forms that meet environmental targets without sacrificing yield. These products, generally uncoated granules or prills, are applied using broadcast spreaders or incorporated into the soil during tillage. Nutrient availability depends on factors such as soil moisture, temperature, and microbial activity. Their low production cost and compatibility with existing farming equipment support their continued prevalence in price-sensitive markets, including cereals, oilseeds, and sugarcane. Conventional products are increasingly challenged by regulatory restrictions on application rates and by environmental concerns about nutrient runoff. This has led to a gradual shift toward enhanced-efficiency alternatives, even in cost-sensitive segments.
Specialty fertilizers are projected to grow at a compound annual growth rate (CAGR) of 6.3% during the period 2026-2031. This growth is driven by the adoption of controlled-release, slow-release, liquid, and water-soluble formulations, which enhance nutrient-use efficiency and reduce labor requirements. Controlled-release fertilizers, coated with polymers or sulfur, release nutrients based on soil temperature and moisture, aligning nutrient availability with crop demand and reducing leaching losses by 20% to 40% compared to conventional fertilizers. Slow-release fertilizers, formulated with chemicals such as urea-formaldehyde or isobutylidene diurea, provide a cost-effective option with extended nutrient release, making them suitable for turfgrass and ornamental applications. Liquid fertilizers are witnessing significant growth in North America and Europe, where large farms incorporate them into existing sprayer systems for foliar or starter applications, ensuring uniform coverage and rapid nutrient uptake by plants.
By Application Mode: Soil Application Dominates, Fertigation Gains Traction
Soil application is the largest segment and accounts for 89.0% share of the fertilizer market in 2025, confirming its role as the default delivery method for cereal and oilseed growers who value speed and equipment familiarity. The fertilizers market size attributable to soil techniques is projected to expand steadily, driven by large acreage and subsidy support in China and India, even as nutrient-use caps encourage more targeted placement. Incorporation through tillage or injection remains critical for anhydrous ammonia and urea, as burying granules reduces volatilization risk.
Fertigation is projected to grow at a 6.3% compound annual rate from 2026 to 2031 as drip and sprinkler systems spread across water-scarce regions. Liquid and water-soluble specialty grades capture most of this incremental demand because they dissolve completely and can be metered in small, frequent pulses that match crop uptake. Foliar feeding, though still a niche, benefits vineyards, orchards, and greenhouse vegetables that need rapid micronutrient correction late in the growth cycle. Together, fertigation and foliar methods create a premium pocket inside the broader fertilizers market, rewarding suppliers that can formulate products compatible with fine filters and low-volume sprayers.
By Crop Type: Field Crops Anchor Volume, Horticulture Drives Growth
Field crops are the largest crop type and accounted for 81.9% of the fertilizers market in 2025, giving them the largest share among crop groups. High nutrient requirements, especially for nitrogen and potash, keep demand resilient even when commodity prices soften. Government subsidy frameworks in India and price caps in China reduce grower sensitivity to natural gas price swings, sustaining baseline purchases of urea, diammonium phosphate, and muriate of potash. Large farm enterprises in Brazil and the United States increasingly blend inhibitor-coated urea to comply with runoff limits, adding modest value to each metric ton sold.
Horticultural crops are projected to register a 7.2% CAGR over 2026-2031, the fastest among all crop segments. Greenhouse tomatoes, berries, and cut flowers justify higher input costs because visual quality and shelf life directly influence price realization. Water-soluble and controlled-release formulations dominate this space, aligning nutrient release with short growth cycles and strict residue standards. Turf and ornamental landscapes further strengthen specialty demand because golf courses and sports fields require steady color and growth without excessive clippings. Consequently, premium segments within horticulture and turf support margin expansion for suppliers that can tailor micronutrient packages and slow-release coatings to crop, soil, and climate specifics, reinforcing a value-added trajectory in the fertilizers market.
Note: Segment shares of all individual segments available upon report purchase
Get Detailed Market Forecasts at the Most Granular Levels
Download PDF
Geography Analysis
Asia-Pacific is the largest geography segment, accounting for 43.9% of the fertilizers market share in 2025, led by China and India. China's domestic urea production capacity exceeded 80.45 million metric tons in 2024, ensuring a stable supply. However, older coal-based facilities may face stricter emissions regulations, potentially leading to idled operations and creating opportunities for coastal gas-based plants equipped with carbon capture technology. In India, the Ministry of Agriculture reported that total annual fertilizer consumption for 2023–24 was approximately 60.1 million metric tons. Of this, 50.3 million metric tons were produced domestically, while 17.7 million metric tons were imported. In Southeast Asia, demand is driven by palm oil, rice, and rubber plantations. Additionally, Indonesian refiners are testing controlled-release fertilizer blends in large rice paddies to meet sustainability certification requirements.
Africa is projected to record the fastest compound annual growth rate (CAGR) of 7.3% through 2031. Fertilizer demand in Sub-Saharan Africa is shaped by agricultural modernization, population growth, and government efforts to achieve food self-sufficiency. Fertilizer application rates in the region are considerably lower than global averages, indicating significant growth potential as infrastructure improves and affordability challenges are addressed. Nigeria and South Africa, the region's largest economies, are focusing on increasing domestic production capacities to reduce reliance on imports and stabilize prices. Additionally, Ethiopia, Kenya, and Tanzania are expanding blending facilities that import bulk urea and diammonium phosphate (DAP) to create customized NPK ratios tailored to local crops such as coffee, tea, and maize. In the Middle East, countries like Saudi Arabia, the United Arab Emirates, and Turkey combine domestic production capabilities with imports to meet fertilizer demand, as arid climates and limited arable land restrict agricultural growth. Turkey's strategic location positions it as a logistics hub for fertilizer trade across Europe, Asia, and Africa.
Europe confronts stringent nutrient caps and elevated energy costs that curb straight-fertilizer volumes but boost specialty margins. Eastern European markets, particularly Ukraine and Russia, remain key exporters of urea, ammonium nitrate, and potash. However, geopolitical instability and export restrictions have disrupted trade flows, redirecting volumes toward Asia and Africa. In the United Kingdom, post-Brexit agricultural policy focuses on environmental land management, with subsidies transitioning from production support to ecosystem services. This shift has placed additional pressure on conventional fertilizer demand while creating opportunities for organic and biostimulant products. Crop producers in France and Spain invest in precision-spreaders to comply with nitrogen limits without depressing grain output, reinforcing demand for inhibitor-coated products.
Get Analysis on Important Geographic Markets
Download PDF
Competitive Landscape
Market concentration is medium with the top five players, Nutrien Ltd., The Mosaic Company, ICL Group Ltd., CF Industries Holdings, Inc., and Yara International ASA, holding significant market share in 2025. The Mosaic Company is a significant producer of phosphate in North America and possesses substantial potash production capacity in Canada and Brazil. The company utilizes vertical integration, spanning from mining to finished-product blending, to optimize margins across its value chain. Yara International ASA, based in Norway, specializes in nitrogen fertilizers and specialty products, with a global presence in production, distribution, and digital agronomy platforms. These platforms combine nutrient recommendations with sustainability metrics. The company's strategic initiatives focus on backward integration into raw materials, joint ventures for green ammonia production, and the development of digital platforms to improve customer retention and enable premium pricing for value-added services.
Smaller competitors gain ground by blending bulk commodities into region-specific NPKs and by deploying artificial-intelligence platforms that prescribe nutrients at the micro-scale. Emerging disruptors in the market include regional blenders and precision-agriculture startups that bypass traditional distribution channels. They provide direct-to-farmer sales combined with services such as soil testing, variable-rate prescriptions, and sustainability reporting. These companies capture margins by customizing formulations to suit micro-climatic conditions and crop-specific requirements. They often source bulk commodities from established producers and enhance value through customization and agronomic guidance.
Opportunities are present in Sub-Saharan Africa and Southeast Asia due to low application rates and fragmented supply chains. These regions offer opportunities for companies to invest in local blending capacity, agronomic extension services, and credit facilities to address affordability challenges. The competitive landscape is significantly influenced by government policies, including subsidies, import tariffs, and export restrictions. These factors can quickly alter market share between domestic and international suppliers, necessitating agility in sourcing and logistics to manage regulatory changes effectively.
Fertilizers Industry Leaders
-
CF Industries Holdings, Inc.
-
ICL Group Ltd
-
Nutrien Ltd.
-
The Mosaic Company
-
Yara International ASA
- *Disclaimer: Major Players sorted in no particular order
Need More Details on Market Players and Competitors?
Download PDF
Recent Industry Developments
- January 2026: CF Industries Holdings, Inc., a global manufacturer of hydrogen and nitrogen products, and POET, the largest producer of biofuels worldwide, have initiated a pilot project in collaboration with major agricultural cooperatives. The project aims to establish a low-carbon fertilizer supply chain, demonstrating how low-carbon nitrogen fertilizer can significantly reduce the carbon intensity of corn production. This, in turn, facilitates the production of low-carbon ethanol for use in motor fuel and export markets.
- December 2025: India's state-owned companies Rashtriya Chemicals and Fertilisers (RCF), National Fertilisers (NFL), and Indian Potash Limited (IPL) have signed a Memorandum of Understanding (MoU) with Russia's UralChem to develop a urea plant in Russia with an annual production capacity of 2 million metric tons. This USD 1.2 billion joint venture is intended to ensure long-term and stable fertilizer supplies to India, with operations projected to commence by 2027–28.
- December 2025: Coromandel International Limited has introduced 'Fertinex,' a water-soluble fertilizer (WSF) developed for fertigation applications in the Indian market. Utilizing proprietary Smart Signalling Technology, the product enhances nutrient uptake efficiency, supports root development, and helps crops manage biotic and abiotic stress.
- June 2025: Indian Farmers Fertiliser Cooperative Limited (IFFCO) established its first overseas nano-fertilizer production plant in Curitiba, Brazil, through a joint venture with NANOFERT. The facility is designed to produce 4.5 million liters of nano-fertilizers annually, aiming to enhance crop yields for maize, soybean, and sugarcane in Brazil.
Global Fertilizers Market Report Scope
Fertilizer refers to any synthetic material applied to soil or plant tissues to provide essential nutrients required for growth and development. Typically consisting of nitrogen, phosphorus, and potassium (NPK), fertilizers improve soil fertility, enhance water retention, and boost crop yields. The Fertilizers Market Report is Segmented by Type (Complex and Straight), by Form (Conventional and Specialty), by Application Mode (Fertigation, Foliar, and Soil), by Crop Type (Field Crops, Horticultural Crops, and Turf and Ornamental), and by Geography (North America, South America, Europe, Asia-Pacific, Middle East and Africa). The Market Forecasts are Provided in Terms of Value (USD) and Volume (Metric Tons).
By Type
| Complex | ||
| Straight | Micronutrients | Boron |
| Copper | ||
| Iron | ||
| Manganese | ||
| Molybdenum | ||
| Zinc | ||
| Others | ||
| Nitrogenous | Ammonium Nitrate | |
| Anhydrous Ammonia | ||
| Urea | ||
| Others | ||
| Phosphatic | Di-ammonium Phosphate (DAP) | |
| Mono Ammonium Phosphate (MAP) | ||
| Single Super Phosphate (SSP) | ||
| Triple Superphosphate (TSP) | ||
| Others | ||
| Potassic | Muriate of Potash (MoP) | |
| Sulphate of Potash (SoP) | ||
| Others | ||
| Secondary Macronutrients | Calcium | |
| Magnesium | ||
| Sulfur | ||
By Form
| Conventional | |
| Specialty | Controlled-Release Fertilizer (CRF) |
| Liquid Fertilizer | |
| Slow-Release Fertilizer (SRF) | |
| Water Soluble |
By Application Mode
| Fertigation |
| Foliar |
| Soil |
By Crop Type
| Field Crops |
| Horticultural Crops |
| Turf and Ornamental |
By Geography
| North America | Canada |
| Mexico | |
| United States | |
| Rest of North America | |
| Europe | France |
| Germany | |
| Italy | |
| Netherlands | |
| Russia | |
| Spain | |
| Ukraine | |
| United Kingdom | |
| Rest of Europe | |
| Asia-Pacific | Australia |
| Bangladesh | |
| China | |
| India | |
| Indonesia | |
| Japan | |
| Pakistan | |
| Philippines | |
| Thailand | |
| Vietnam | |
| Rest of Asia-Pacific | |
| South America | Argentina |
| Brazil | |
| Rest of South America | |
| Middle East | Turkey |
| Saudi Arabia | |
| Rest of Middle East | |
| Africa | Nigeria |
| South Africa | |
| Rest of Africa |
| By Type | Complex | ||
| Straight | Micronutrients | Boron | |
| Copper | |||
| Iron | |||
| Manganese | |||
| Molybdenum | |||
| Zinc | |||
| Others | |||
| Nitrogenous | Ammonium Nitrate | ||
| Anhydrous Ammonia | |||
| Urea | |||
| Others | |||
| Phosphatic | Di-ammonium Phosphate (DAP) | ||
| Mono Ammonium Phosphate (MAP) | |||
| Single Super Phosphate (SSP) | |||
| Triple Superphosphate (TSP) | |||
| Others | |||
| Potassic | Muriate of Potash (MoP) | ||
| Sulphate of Potash (SoP) | |||
| Others | |||
| Secondary Macronutrients | Calcium | ||
| Magnesium | |||
| Sulfur | |||
| By Form | Conventional | ||
| Specialty | Controlled-Release Fertilizer (CRF) | ||
| Liquid Fertilizer | |||
| Slow-Release Fertilizer (SRF) | |||
| Water Soluble | |||
| By Application Mode | Fertigation | ||
| Foliar | |||
| Soil | |||
| By Crop Type | Field Crops | ||
| Horticultural Crops | |||
| Turf and Ornamental | |||
| By Geography | North America | Canada | |
| Mexico | |||
| United States | |||
| Rest of North America | |||
| Europe | France | ||
| Germany | |||
| Italy | |||
| Netherlands | |||
| Russia | |||
| Spain | |||
| Ukraine | |||
| United Kingdom | |||
| Rest of Europe | |||
| Asia-Pacific | Australia | ||
| Bangladesh | |||
| China | |||
| India | |||
| Indonesia | |||
| Japan | |||
| Pakistan | |||
| Philippines | |||
| Thailand | |||
| Vietnam | |||
| Rest of Asia-Pacific | |||
| South America | Argentina | ||
| Brazil | |||
| Rest of South America | |||
| Middle East | Turkey | ||
| Saudi Arabia | |||
| Rest of Middle East | |||
| Africa | Nigeria | ||
| South Africa | |||
| Rest of Africa | |||
Need A Different Region or Segment?
Customize Now
Market Definition
- MARKET ESTIMATION LEVEL - Market Estimations for various types of fertilizers has been done at the product-level and not at the nutrient-level.
- NUTRIENT TYPES COVERED - Primary Nutrients: N, P and K, Secondary Macronutrients: Ca, Mg and S, Micronutients: Zn, Mn, Cu, Fe, Mo, B, and Others
- AVERAGE NUTRIENT APPLICATION RATE - This refers to the average volume of nutrient consumed per hectare of farmland in each country.
- CROP TYPES COVERED - Field Crops: Cereals, Pulses, Oilseeds, and Fiber Crops Horticulture: Fruits, Vegetables, Plantation Crops and Spices, Turf Grass and Ornamentals
| Keyword | Definition |
|---|---|
| Fertilizer | Chemical substance applied to crops to ensure nutritional requirements, available in various forms such as granules, powders, liquid, water soluble, etc. |
| Specialty Fertilizer | Used for enhanced efficiency and nutrient availability applied through soil, foliar, and fertigation. Includes CRF, SRF, liquid fertilizer, and water soluble fertilizers. |
| Controlled-Release Fertilizers (CRF) | Coated with materials such as polymer, polymer-sulfur, and other materials such as resins to ensure nutrient availability to the crop for its entire life cycle. |
| Slow-Release Fertilizers (SRF) | Coated with materials such as sulfur, neem, etc., to ensure nutrient availability to the crop for a longer period. |
| Foliar Fertilizers | Consist of both liquid and water soluble fertilizers applied through foliar application. |
| Water-Soluble Fertilizers | Available in various forms including liquid, powder, etc., used in foliar and fertigation mode of fertilizer application. |
| Fertigation | Fertilizers applied through different irrigation systems such as drip irrigation, micro irrigation, sprinkler irrigation, etc. |
| Anhydrous Ammonia | Used as fertilizer, directly injected into the soil, available in gaseous liquid form. |
| Single Super Phosphate (SSP) | Phosphorus fertilizer containing only phosphorus which has lesser than or equal to 35%. |
| Triple Super Phosphate (TSP) | Phosphorus fertilizer containing only phosphorus greater than 35%. |
| Enhanced Efficiency Fertilizers | Fertilizers coated or treated with additional layers of various ingredients to make it more efficient compared to other fertilizers. |
| Conventional Fertilizer | Fertilizers applied to crops through traditional methods including broadcasting, row placement, ploughing soil placement, etc. |
| Chelated Micronutrients | Micronutrient fertilizers coated with chelating agents such as EDTA, EDDHA, DTPA, HEDTA, etc. |
| Liquid Fertilizers | Available in liquid form, majorly used for application of fertilizers to crops through foliar and fertigation. |
Need More Details on Market Definition?
Ask a Question
Research Methodology
Mordor Intelligence follows a four-step methodology in all our reports.
- Step-1: IDENTIFY KEY VARIABLES: In order to build a robust forecasting methodology, the variables and factors identified in Step-1 are tested against available historical market numbers. Through an iterative process, the variables required for market forecast are set and the model is built on the basis of these variables.
- Step-2: Build a Market Model: Market-size estimations for the forecast years are in nominal terms. Inflation is not a part of the pricing, and the average selling price (ASP) is kept constant throughout the forecast period for each country.
- Step-3: Validate and Finalize: In this important step, all market numbers, variables and analyst calls are validated through an extensive network of primary research experts from the market studied. The respondents are selected across levels and functions to generate a holistic picture of the market studied.
- Step-4: Research Outputs: Syndicated Reports, Custom Consulting Assignments, Databases & Subscription Platforms

Get More Details On Research Methodology
Download PDF


