Feed Methionine Additive Market Size and Share
Market Overview
| Study Period | 2021 - 2031 |
|---|---|
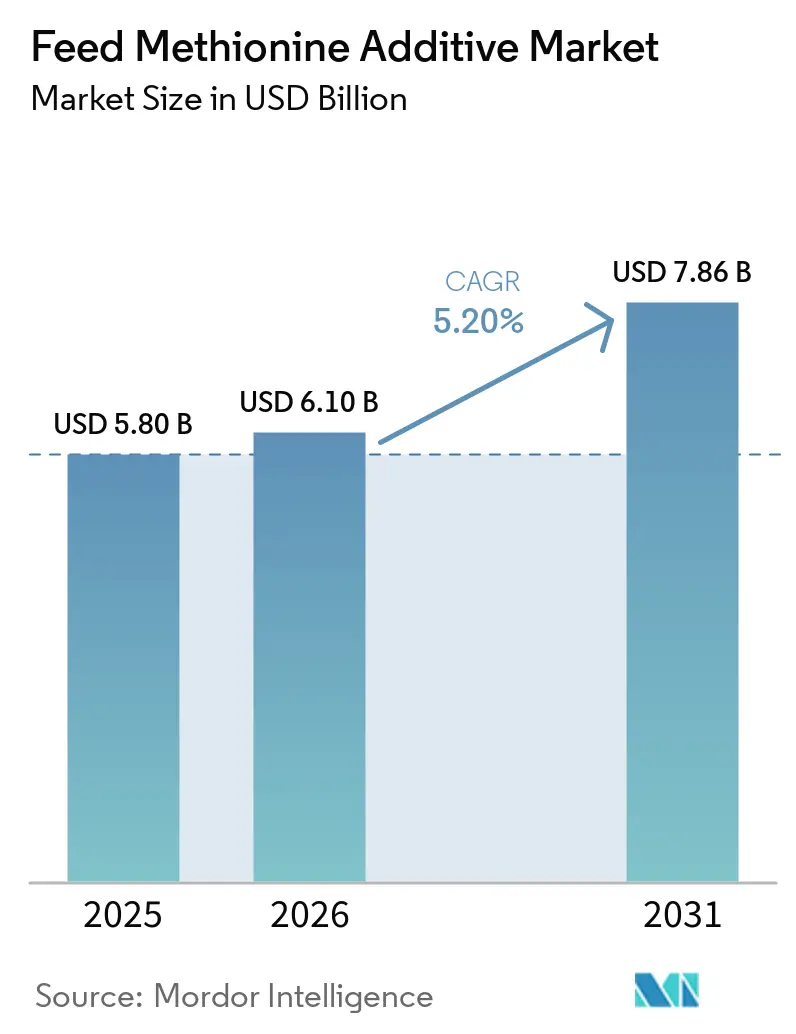
| Market Size (2026) | USD 6.10 Billion |
| Market Size (2031) | USD 7.86 Billion |
| Growth Rate (2026 - 2031) | 5.20% CAGR |
| Fastest Growing Market | Middle East |
| Largest Market | Asia Pacific |
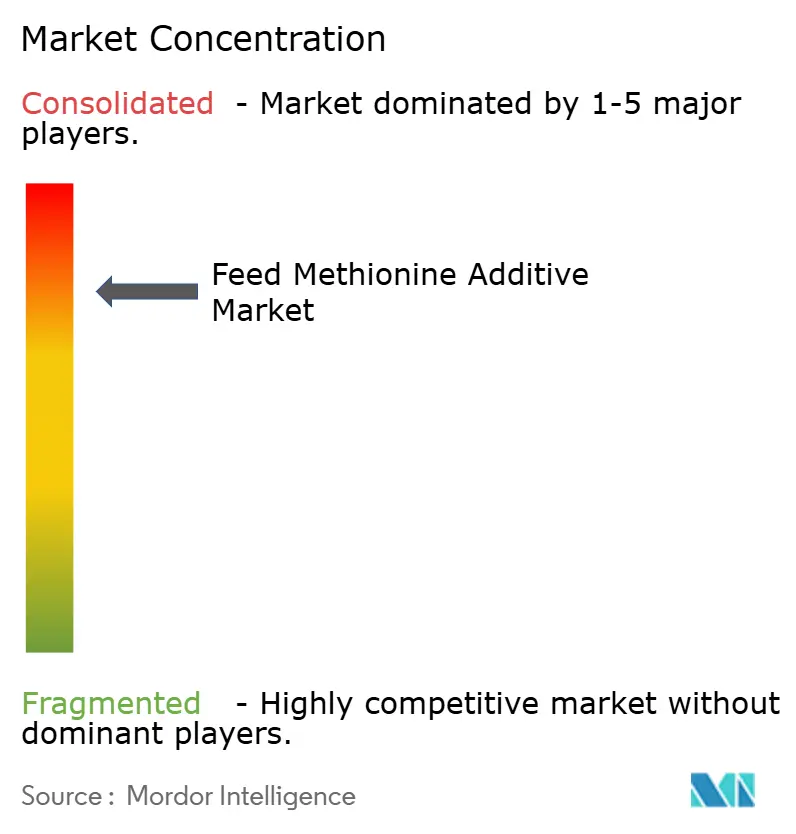
| Market Concentration | High |
Major Players *Disclaimer: Major Players sorted in no particular order Image © Mordor Intelligence. Reuse requires attribution under CC BY 4.0. | |
Feed Methionine Additive Market Analysis by Mordor Intelligence
The feed methionine additive market size is projected to grow from USD 5.80 billion in 2025 to USD 6.10 billion in 2026, reaching USD 7.86 billion by 2031, with a CAGR of 5.2% during 2026-2031. The substitution of antibiotics with synthetic amino acids, the rapid expansion of poultry and shrimp operations in the Asia-Pacific region, and increased scrutiny of carbon footprints by major retailers are driving demand for methionine in the global feed methionine additive market. Regulatory bans on antibiotic growth promoters in regions such as the European Union, China, and the United States are further boosting amino acid inclusion rates. Additionally, the adoption of precision-nutrition software is reducing over-formulation, leading to increased purchases of feed methionine additives. Liquid methionine formats are gaining traction in automated feed mills due to their ability to minimize dust exposure, integrate with dosing software, and enhance worker safety.
Key Report Takeaways
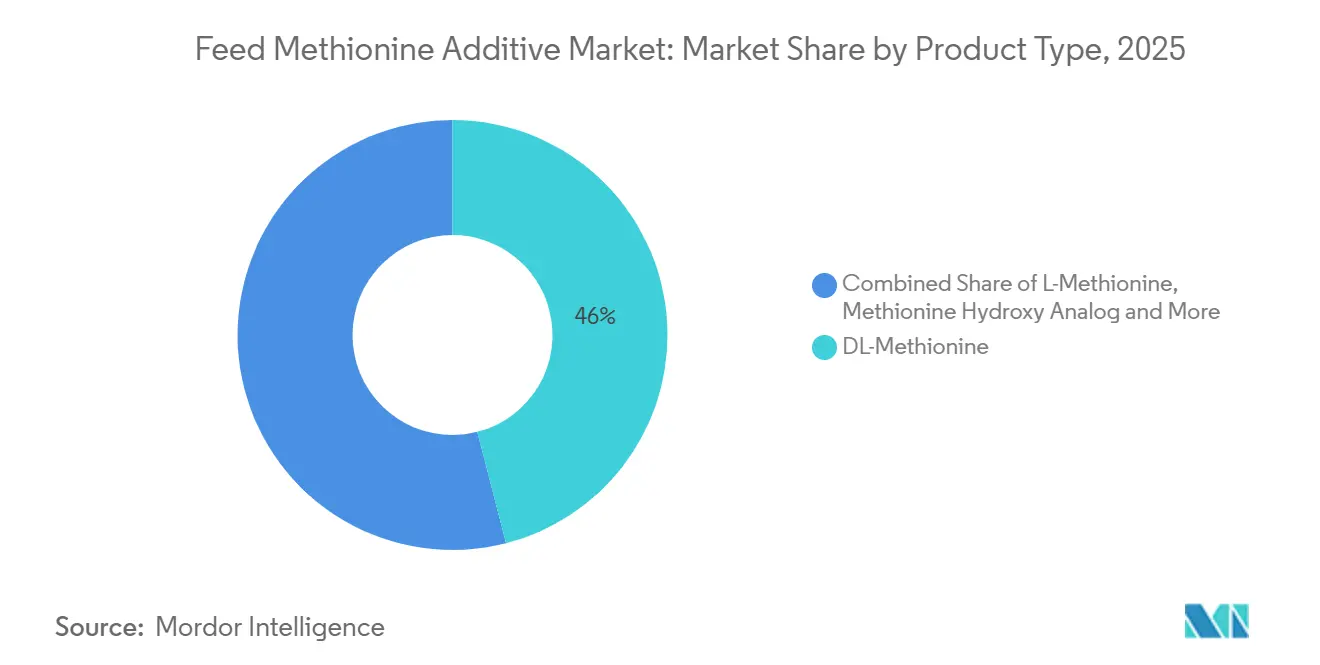
- By product type, DL-Methionine commanded the largest 46% feed methionine additive market share in 2025, while the Methionine Hydroxy Analog market size is forecast to record the fastest CAGR of 7.8% from 2026 to 2031.
- By form, powder and granules account for the largest 64% feed methionine additive market share in 2025, meanwhile, the liquid methionine market size is set to advance at the fastest 7.5% CAGR from 2026 to 2031.
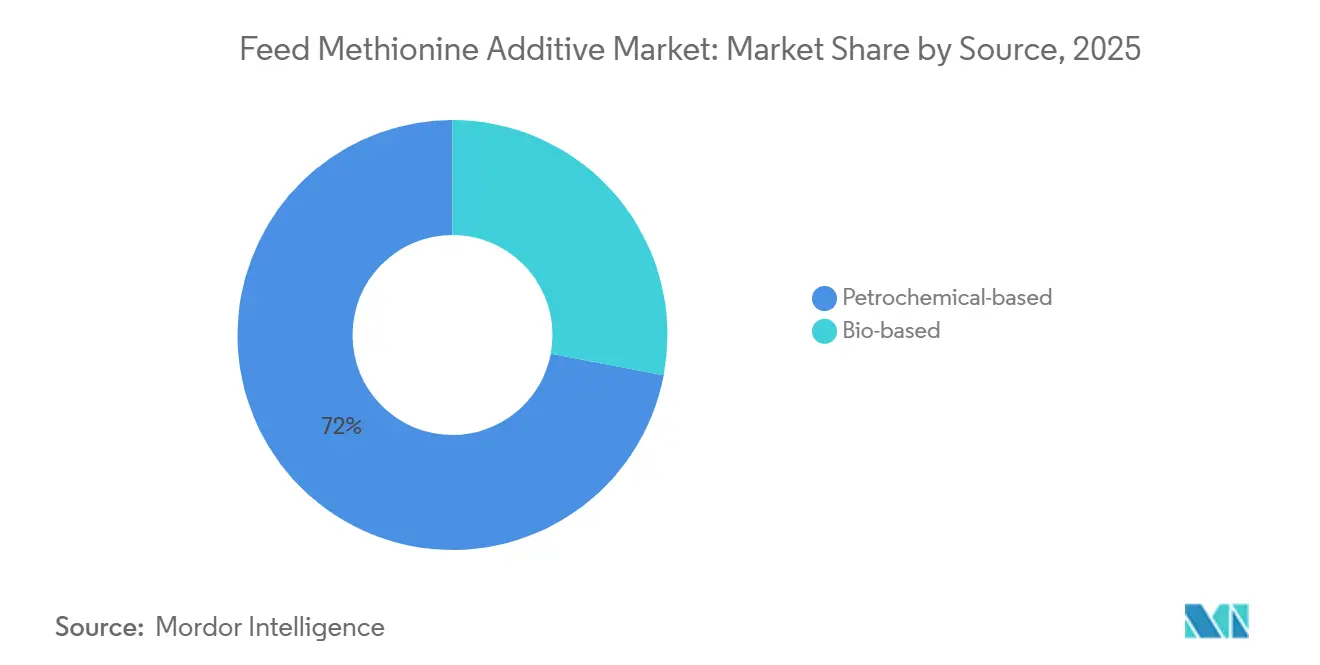
- By source, petrochemical-based methionine held the largest 72% feed methionine additive market share in 2025, and the bio-based alternatives market size is projected to post the fastest 8.9% CAGR from 2026 to 2031.
- By animal type, poultry delivered the largest 49% feed methionine additive market share in 2025, and the aquaculture market size is charting the fastest 9.2% CAGR from 2026 to 2031.
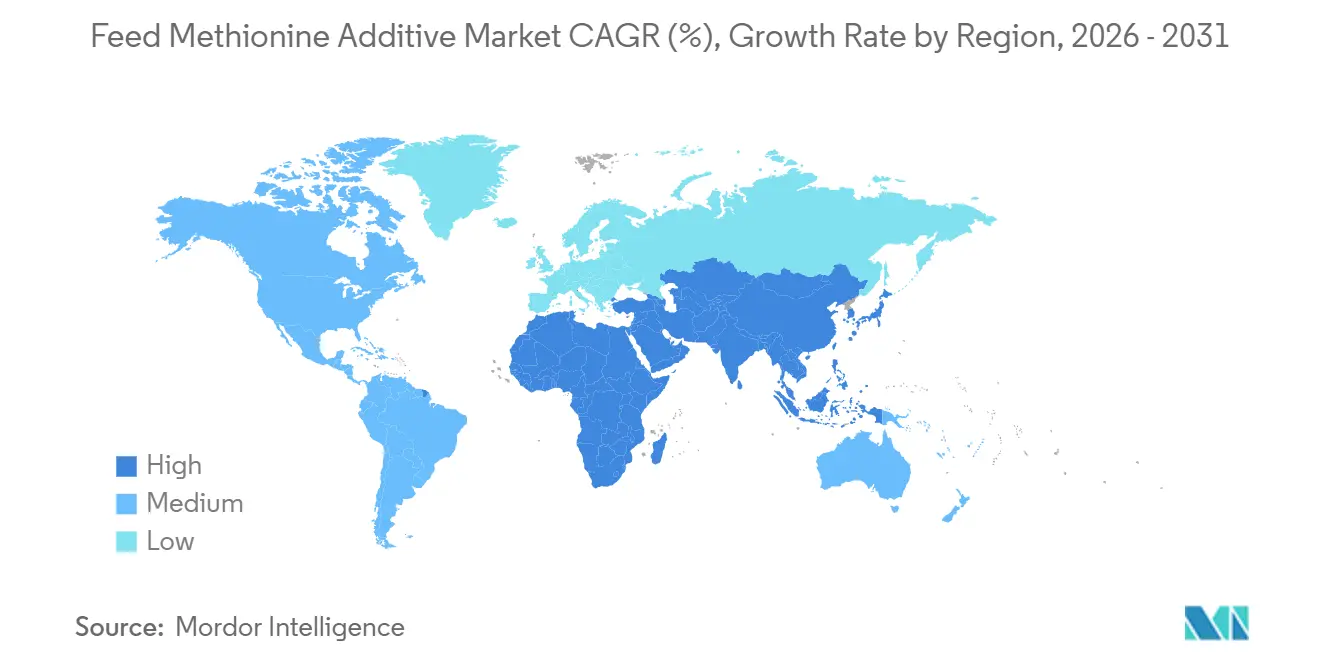
- By geography, Asia-Pacific controlled the largest 38% feed methionine additive market share in 2025, while the Middle East is positioned for the fastest 8.1% CAGR rom 2026 to 2031.
Note: Market size and forecast figures in this report are generated using Mordor Intelligence’s proprietary estimation framework, updated with the latest available data and insights as of January 2026.
Global Feed Methionine Additive Market Trends and Insights
Drivers Impact Analysis*
| Driver | (~) % Impact on CAGR Forecast | Geographic Relevance | Impact Timeline |
|---|---|---|---|
| Escalating global poultry meat production | +1.2% | Asia-Pacific, South America, and Middle East | Medium term (2-4 years) |
| Growth in aquaculture intensification | +1.0% | Asia-Pacific core, South America, and Middle East | Long term (≥ 4 years) |
| Rising demand for premium pet food | +0.6% | North America and Europe | Medium term (2-4 years) |
| Regulatory push for reduced antibiotic usage in feed | +0.9% | European Union, China, and United States | Short term (≤ 2 years) |
| Single-step fermentation reduces capital expenditure | +0.5% | Asia-Pacific and emerging markets | Long term (≥ 4 years) |
| AI-driven algorithms optimize methionine-to-lysine ratios | +0.4% | North America, Europe, and advanced Asia-Pacific | Medium term (2-4 years) |
| Source: Mordor Intelligence | |||
Escalating Global Poultry Meat Production
Global chicken production continues to rise, driven by urban consumers' demand for affordable animal protein. The Food and Agriculture Organization (FAO) forecasts steady growth in Asia-Pacific and South America, linking broiler facility expansion to higher methionine usage. Facility upgrades prioritize cost-effective plant proteins low in sulfur amino acids, prompting increased methionine supplementation to maintain feed-conversion ratios. In 2024, Evonik Operations GmbH commissioned a 40,000 metric ton per annum DL-Methionine line in Singapore[1]Source: Evonik Industries AG, “Evonik Expands Methionine Capacity in Singapore,” evonik.com. Integrators rely on real-time software to meet daily methionine targets.
Growth in Aquaculture Intensification
Fish and shrimp farms are replacing fishmeal with soy and rapeseed, creating methionine deficits that must be addressed. A 2022-2023 study on Pacific white shrimp showed that 0.69-0.82% dietary methionine reduced fishmeal from 18% to 6% without affecting performance, yielding a 33.2% ROI[2]Source: Wiley Online Library, “Optimal Methionine Supplementation in Pacific White Shrimp Diets,” wiley.com. Shrimp ponds in Vietnam and salmon cages in Norway now use coated or liquid methionine variants to resist leaching. Suppliers are offering micro-encapsulated grades that dissolve upon ingestion, helping the feed methionine additive market expand into high-density recirculating systems.
Rising Demand for Premium Pet Food
Pet owners in North America and Europe are increasingly choosing functional pet food formulas that promote joint health and improve coat quality. Methionine supports taurine synthesis, liver detoxification, and hair quality, making it essential in novel protein and grain-free diets. The global pet food ingredient market is supported by the increasing demand for specialty amino acids. Suppliers now offer companion-animal-specific grades, meeting strict palatability and odor requirements while diversifying revenue streams.
Regulatory Push for Reduced Antibiotic Usage in Feed
The European Union banned prophylactic antibiotics in 2022, followed by China, which reduced veterinary drug consumption. Viet Nam introduced similar regulations in 2026[3]Source: Zheng S. et al., “Solutions to the Dilemma of Antibiotics Use,” mdpi.com. Without antibiotic growth promoters, producers are adopting amino-acid balancing, acidifiers, and probiotics. Methionine, essential for protein synthesis and immune modulation, sees rising demand as integrators maintain performance while meeting antibiotic-free labeling requirements. Immediate compliance deadlines amplify this driver’s short-term impact, sustaining the feed methionine additive market through policy cycles.
Restraints Impact Analysis*
| Restraint | (~) % Impact on CAGR Forecast | Geographic Relevance | Impact Timeline |
|---|---|---|---|
| Volatile petrochemical feedstock prices | -0.7% | Asia-Pacific, and Europe | Short term (≤ 2 years) |
| Strict regulations impact sulfur emissions in production | -0.4% | Europe, China, and United States | Medium term (2-4 years) |
| Global supply chains increase exposure to anti-dumping penalties | -0.5% | China, European Union, and United States corridors | Short term (≤ 2 years) |
| Electrolytic oxidation waste management adds significant costs | -0.3% | Europe and North America | Long term (≥ 4 years) |
| Source: Mordor Intelligence | |||
Volatile Petrochemical Feedstock Prices
Sulfur and acrolein increase in early 2025 due to shipping disruptions in the Red Sea. Methionine margins were affected as contract formulas incorporate raw material price changes with a delay. Fertilizer revenue from ammonium sulfate helps offset such impacts. However, when both sulfur and methionine prices decline simultaneously, smaller producers encounter difficulties. Large integrated companies, such as Bluestar Adisseo Company, manage feedstock risks internally to sustain production levels, whereas independent processors often postpone maintenance or lower operating rates, restricting new supply additions to the feed methionine additive market.
Strict Regulations Impact Sulfur Emissions in Production
Stringent environmental regulations on sulfur emissions are significantly influencing cost structures in the feed methionine additive market, particularly for conventional synthetic production methods that depend on sulfur-based chemical processes. Policies such as the Industrial Emissions Directive in the European Union and China’s ultra-low-emission framework require manufacturers to implement emission control systems and continuous monitoring, leading to increased capital and compliance costs for methionine producers. As methionine is a sulfur-containing amino acid, its production inherently involves sulfur handling, which heightens regulatory oversight.
*Our forecasts treat driver/restraint impacts as directional, not additive. The impact forecasts reflect baseline growth, mix effects, and variable interactions.
Segment Analysis
By Product Type: Liquid MHA Gains on Handling Ease
DL-Methionine is accounted for 46% of the feed methionine additive market by 2025. The Methionine Hydroxy Analog (MHA) market size is projected to grow at a CAGR of 7.8% from 2026 to 2031, driven by the adoption of liquid grades that facilitate dosing in high-density broiler and shrimp systems. L-Methionine is particularly effective in specialty aquaculture diets due to its natural isomer, which enhances digestibility. However, its high production cost limits its market share.
As automation continues to expand, the demand is shifting toward liquid products that integrate with supervisory control software. Bluestar Adisseo Company has increased the capacity of its Nanjing liquid production line to align with this trend. DL-Methionine remains essential in regions without liquid infrastructure, as it can be transported in sacks and big bags alongside other feed additives via mixed freight. However, for feed mills with higher annual output, the return on investment for a liquid system encourages adoption and increases MHA penetration in the feed methionine additive market. Encapsulated or coated variants remain significant for aquatic species requiring slow nutrient release, creating niche but stable revenue opportunities for producers capable of customizing particle morphology.


By Form: Automation Drives Liquid Uptake
Powder and granules accounted for the largest share, 64%, of the feed methionine additive market size in 2025. However, liquid methionine market size is projected to grow at the fastest rate, with a CAGR of 7.5% from 2026 to 2031, driven by its adoption in automated mills. These mills favor inline pumps that deliver precise micron-level volumes without interrupting production. Liquid methionine minimizes respirable dust, a critical factor in occupational safety audits in the United States and European Union, enhancing its appeal as a compliance solution.
Powders remain prevalent in regions with fragmented infrastructure, where feed trucks supply multiple small farms. Bagged powders enable mills to align batch sizes with demand fluctuations without concerns about shelf life or pump maintenance. Long-haul maritime transport favors powders due to lower freight costs per active kilogram compared to the refrigerated drums required for certain liquid forms. However, as industry consolidation shifts more production to large-scale mills, the operational advantages increasingly favor liquids, gradually increasing their share in the global feed methionine additive market.
By Source: Bio-Based Gains on Carbon Scrutiny
Petrochemical-based formulations accounted for the largest market share, 72% of the feed methionine additive market in 2025. This dominance is attributed to large integrated complexes that utilize captive hydrogen cyanide and methanethiol streams. In contrast, the bio-based formulations market size is projected to grow at the fastest CAGR of 8.9% from 2026 to 2031. CJ CheilJedang’s Malaysian complex avoids the use of harmful intermediates, reduces plant permitting time, and utilizes palm-based biomass energy, resulting in cradle-to-gate emissions of less than 4 kilograms of carbon dioxide equivalent per kilogram of product.
Established chemical companies are actively adapting to changes in the market. Evonik Operations GmbH is testing the use of green hydrogen to replace fossil-based hydrogen and has collaborated with renewable energy providers to reduce indirect emissions. Upcoming carbon border-adjustment legislation in the European Union could increase compliance costs for petrochemical production methods, potentially impacting their traditional cost advantage. However, oil-based feedstock prices may decline significantly during periods of oversupply, leading to fluctuating cost differences.
By Animal Type: Poultry Leads, Aquaculture Rising Fast
Poultry accounted for the largest market share, at 49%, in the feed methionine additive market in 2025, whereas the aquaculture market size is projected to grow at the fastest CAGR of 9.2% from 2026 to 2031, driven by the increasing demand for supplemental methionine in shrimp and salmon farming systems to offset reduced fishmeal inclusion. Trials in Vietnam's white-leg shrimp ponds show methionine improves survival during Vibrio outbreaks. Swine and dairy cattle segments also utilize methionine for optimized production efficiency.
Ruminant nutrition constitutes a specialized segment within the feed methionine additive market. Rumen-protected methionine is utilized to improve milk yield and protein efficiency in dairy cattle, though its overall demand is lower compared to its use in monogastric animals such as poultry and aquaculture. In the pet food segment, methionine is incorporated into premium formulations to support urinary health and provide antioxidant benefits, making it a high-margin application. These species-specific nutritional requirements are driving advancements in formulation technologies, fostering the development of targeted and value-added methionine products.
Geography Analysis
Asia-Pacific accounted for the largest 38% market share of the feed methionine additive market in 2025. Zhejiang NHU Co., Ltd. and Sinopec announced a joint venture for liquid methionine in 2023, ensuring acrolein supply and reflecting long-term confidence despite anti-dumping challenges. In Thailand, rapid automation in shrimp feed mills and India’s shift toward compound dairy rations have expanded the customer base. While environmental regulations are becoming stricter, local governments are offering tax incentives to biotechnology, helping offset compliance costs and reinforcing Asia-Pacific’s position as the manufacturing hub for feed methionine additives.
The Middle East is projected to achieve the fastest growth, with a CAGR of 8.1% from 2026 to 2031, as Gulf Cooperation Council countries invest sovereign funds in food-security initiatives. Large vertically integrated poultry complexes in Saudi Arabia and full-recirculation aquaculture systems in the United Arab Emirates are securing offtake agreements before plant construction, reducing risks for methionine suppliers. Freight cost spikes during the 2025 Red Sea disruptions highlighted the vulnerability of long supply chains, accelerating discussions on establishing regional methionine formulation hubs.
In North America and Europe, growth remains moderate due to mature livestock inventories, but premium segments and antibiotic-free mandates continue to support consistent demand. In 2026, the United States Department of Commerce’s investigation into Spanish and Chinese methionine imports created uncertainty, prompting some feed integrators to secure multi-year domestic contracts with fixed spreads to mitigate tariff risks. In Europe, producers are focusing on incremental debottlenecking rather than new greenfield projects, constrained by land-use limitations and stringent sulfur regulations.

Competitive Landscape
The feed methionine additive market is highly concentrated in 2025, with the top five companies including Evonik Industries AG, Adisseo Animal Nutrition Private Limited, CJ CheilJedang Corporation, Novus International, Inc., and Sumitomo Chemical Co., Ltd. For example, Meihua Holdings Group Co., Ltd. has announced a lysine project that utilizes shared utilities with methionine production, highlighting its strategy to diversify its amino acid portfolio. Additionally, Novus International Inc. has established a dedicated Methionine Business Unit to enhance its focus on liquid methionine technologies and improve responsiveness to customized feed formulations.
Technology is becoming a critical competitive factor in the feed methionine additive market. Leading producers are adopting digital twin technologies to optimize reactor performance and reduce energy consumption. Furthermore, advancements in enzyme engineering have enabled fermentation yields to improve significantly. Strategic collaborations are also reshaping the competitive landscape. For instance, Sumitomo Chemical Co., Ltd. has partnered with ITOCHU Corporation in 2025 to manage logistics for its production facility, demonstrating how supply chain integration can expand market reach without requiring significant capital investment.
Regulatory pressures, including anti-dumping measures, sulfur emission restrictions, and heavy metal discharge standards, are driving up compliance costs across the industry. These challenges tend to favor large, well-capitalized companies. However, fermentation-based startups with modular production systems offer greater operational flexibility and adaptability to evolving regulations. The market is projected to see increased merger and acquisition activity, particularly partnerships that combine petrochemical expertise with biotechnology innovation to address feedstock volatility. Overall, the speed of innovation and regulatory adaptability will remain key factors influencing competitive dynamics in the feed methionine additive market.
Feed Methionine Additive Industry Leaders
Evonik Industries AG
Adisseo Animal Nutrition Private Limited
CJ CheilJedang Corporation
Novus International, Inc.
Sumitomo Chemical Co., Ltd.
- *Disclaimer: Major Players sorted in no particular order

Recent Industry Developments
- February 2025: Sumitomo Chemical Co., Ltd. has expanded its methionine distribution partnership with ITOCHU Corporation by agreeing to supply all feed-grade methionine produced at its Ehime facility through ITOCHU’s global distribution network. This initiative enhances Sumitomo Chemical’s position in the feed methionine additive market by utilizing ITOCHU’s extensive supply chain and sales network spanning over 70 countries.
- August 2024: Evonik Industries AG has completed the expansion of its MetAMINO (DL-methionine) plant in Singapore, increasing its capacity by 40,000 metric tons to approximately 340,000 metric tons per year to meet the growing global demand for feed additives.


Global Feed Methionine Additive Market Report Scope
Feed methionine additives are nutritional supplements added to animal feed to support growth, improve feed efficiency, and enhance livestock productivity. Methionine is essential for protein synthesis, metabolism, and nutrient absorption, particularly in poultry, swine, and aquaculture diets. The feed methionine additive market report is segmented by product type (DL-methionine, L-methionine, methionine hydroxy analog (MHA), and other product types), by form (powder and granules, and liquid), by source (petrochemical-based, and bio-based), by animal type (poultry, swine, ruminants, aquaculture, and pet foods), and by geography (North America, Europe, Asia-Pacific, South America, Middle East and Africa). The market forecasts are provided in terms of value (USD).
| DL-Methionine |
| L-Methionine |
| Methionine Hydroxy Analog (MHA) |
| Other Product Types |
| Powder and Granules |
| Liquid |
| Petrochemical-based |
| Bio-based |
| Poultry |
| Swine |
| Ruminants |
| Aquaculture |
| Pet Food |
| North America | United States |
| Canada | |
| Mexico | |
| Rest of North America | |
| Europe | Germany |
| France | |
| United Kingdom | |
| Spain | |
| Russia | |
| Rest of Europe | |
| Asia-Pacific | China |
| India | |
| Japan | |
| Indonesia | |
| Rest of Asia-Pacific | |
| South America | Brazil |
| Argentina | |
| Rest of South America | |
| Middle East | Saudi Arabia |
| United Arab Emirates | |
| Rest of Middle East | |
| Africa | South Africa |
| Egypt | |
| Rest of Africa |
| By Product Type | DL-Methionine | |
| L-Methionine | ||
| Methionine Hydroxy Analog (MHA) | ||
| Other Product Types | ||
| By Form | Powder and Granules | |
| Liquid | ||
| By Source | Petrochemical-based | |
| Bio-based | ||
| By Animal Type | Poultry | |
| Swine | ||
| Ruminants | ||
| Aquaculture | ||
| Pet Food | ||
| By Geography | North America | United States |
| Canada | ||
| Mexico | ||
| Rest of North America | ||
| Europe | Germany | |
| France | ||
| United Kingdom | ||
| Spain | ||
| Russia | ||
| Rest of Europe | ||
| Asia-Pacific | China | |
| India | ||
| Japan | ||
| Indonesia | ||
| Rest of Asia-Pacific | ||
| South America | Brazil | |
| Argentina | ||
| Rest of South America | ||
| Middle East | Saudi Arabia | |
| United Arab Emirates | ||
| Rest of Middle East | ||
| Africa | South Africa | |
| Egypt | ||
| Rest of Africa | ||


Key Questions Answered in the Report
What is the market size of feed methionine additive market in 2026 and how fast it anticipated to grow in 2031?
The feed methionine additive market size is projected to grow from USD 6.10 billion in 2026, reaching USD 7.86 billion by 2031, with a CAGR of 5.2% during 2026-2031.
Which region leads methionine demand?
Asia-Pacific holds 38% share owing to China’s export scale and intensifying livestock production.
How fast is liquid methionine growing?
Liquid formats post a 7.5% CAGR from 2026-2031 because automated feed mills favor pump dosing and lower dust exposure.
What is the role of bio-based methionine?
Bio-based methionine is projected to grow at fastest CAGR of 8.9% from 2026-2031, offering lower carbon footprints that appeal to retailers with net-zero targets.
Page last updated on:


