Market Overview
| Study Period | 2018 - 2031 |
|---|---|
| Forecast Data Period | 2026 - 2031 |
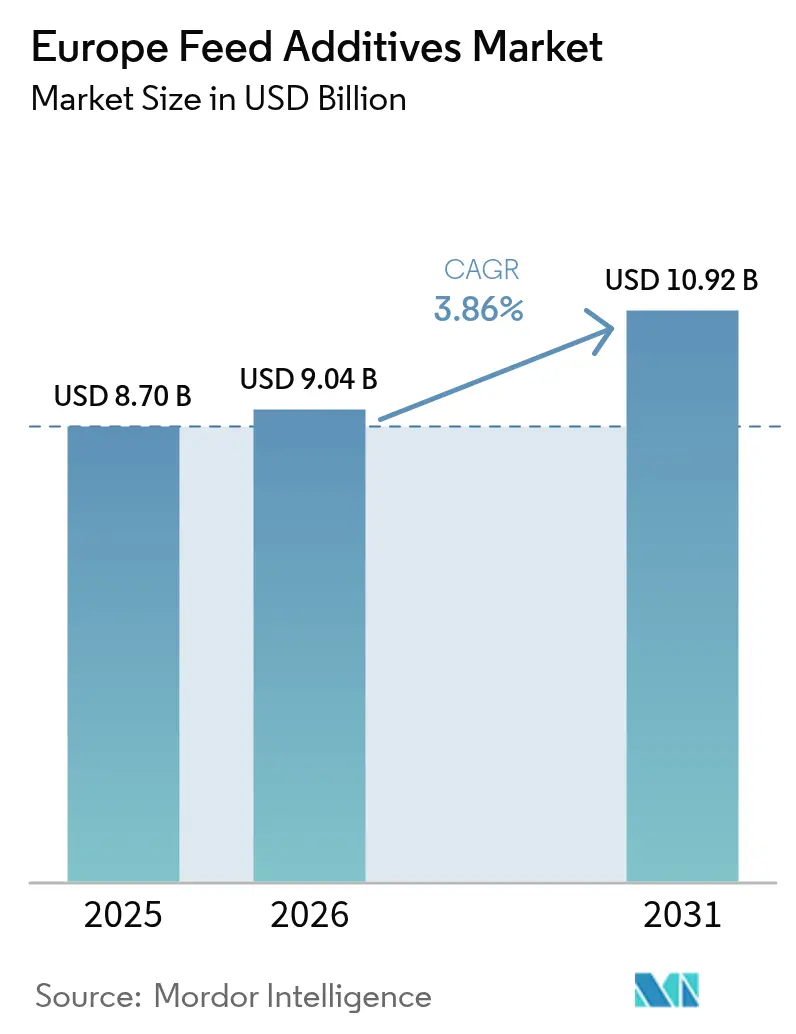
| Base Year Market Size (2025) | USD 8.7 Billion |
| Market Size (2026) | USD 9.04 Billion |
| Market Size (2031) | USD 10.92 Billion |
| Growth Rate (2026 - 2031) | 3.86% CAGR |
| Market Concentration | Medium |
Major Players *Disclaimer: Major Players sorted in no particular order Image © Mordor Intelligence. Reuse requires attribution under CC BY 4.0. | |
Europe Feed Additives Market Analysis by Mordor Intelligence
The Europe animal feed additives market size is expected to grow from USD 8.7 billion in 2025 to USD 9.04 billion in 2026 and is forecast to reach USD 10.92 billion by 2031 at 3.86% CAGR over 2026-2031. The figures highlight steady momentum built on regulatory change, stronger protein demand, and rapid technology uptake. A complete ban on antibiotic growth promoters has pushed producers toward precision-engineered probiotics, enzymes, acidifiers, and phytogenic compounds that keep animal performance high without antimicrobial inputs. Digital feeding tools and micro-encapsulation improve nutrient delivery and cut waste while retailer scorecards on carbon footprints drive farms to prove efficiency gains. Although Chinese capacity cuts send methionine and lysine costs swinging by as much as 30%, faster European Food Safety Authority approvals shorten time-to-market for new biological solutions. Spain, Germany, and France anchor regional volume, yet Eastern Europe supplies the sharpest growth in swine and poultry, which raises the long-term opportunity curve for amino acid and enzyme suppliers.
Key Report Takeaways
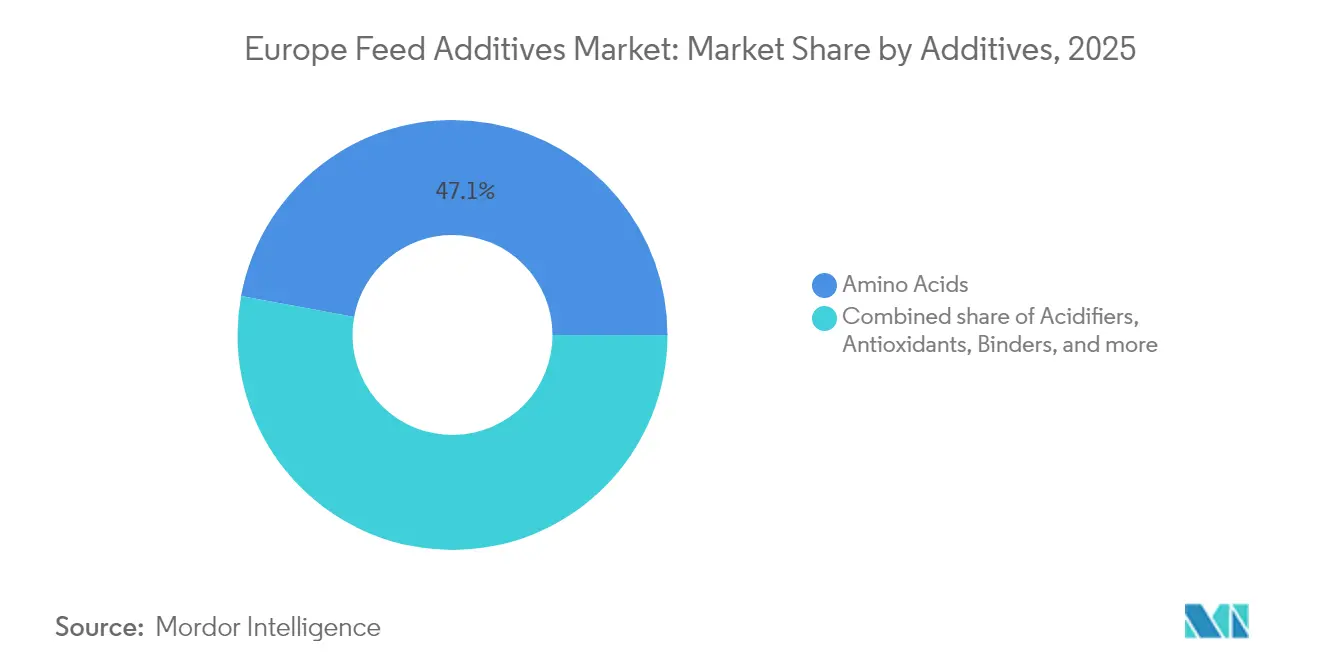
- By additive type, amino acids captured 47.10% of the European animal feed additives market share in 2025, and antioxidants show the fastest 4.21% CAGR through 2031.
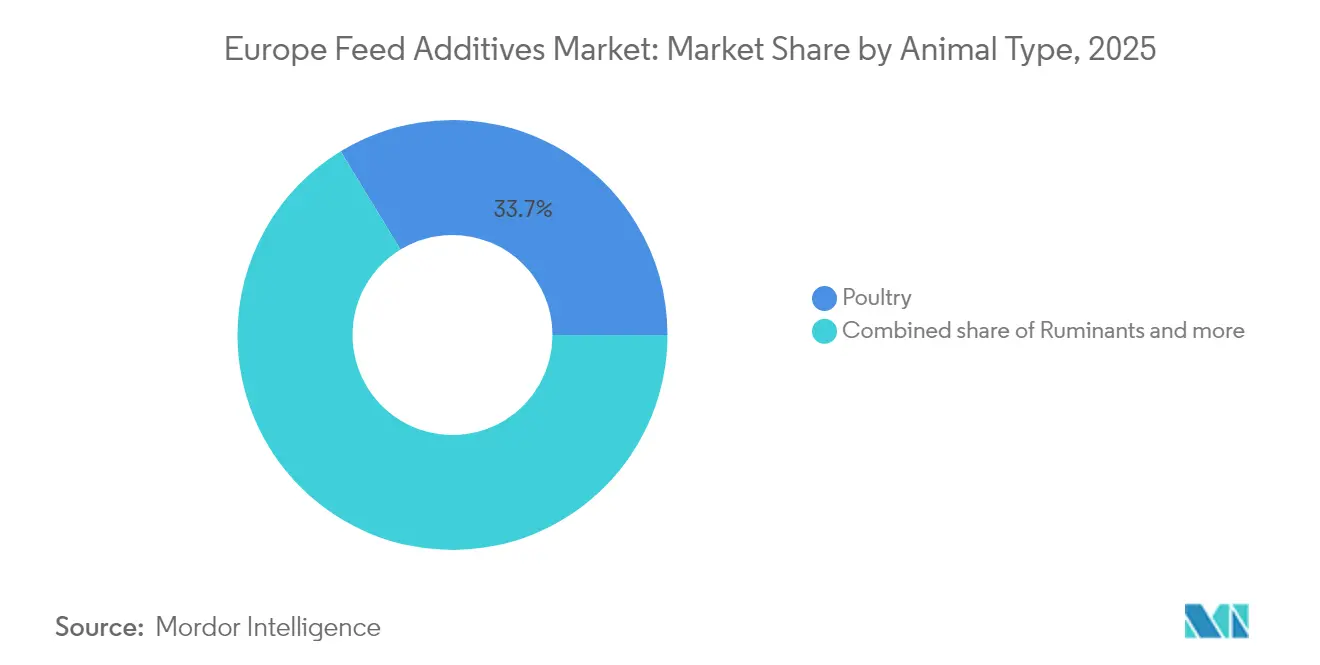
- By animal type, poultry held 33.70% of the European animal feed additives market size in 2025, while swine posted the strongest 4.06% CAGR between 2026 and 2031.
- By Geography, Spain led with a 15.65% share of the European animal feed additives market in 2025, and France recorded the highest 4.73% CAGR over the same period.
Note: Market size and forecast figures in this report are generated using Mordor Intelligence’s proprietary estimation framework, updated with the latest available data and insights as of 2026.
Europe Feed Additives Market Trends and Insights
Drivers Impact Analysis*
| Driver | (~) % Impact on CAGR Forecast | Geographic Relevance | Impact Timeline |
|---|---|---|---|
| EU (European Union) ban on antibiotic growth promoters | +0.8% | Germany, France, the Netherlands, region-wide | Medium term (2-4 years) |
| Rising meat consumption in Eastern Europe | +0.6% | Poland, the Czech Republic, Hungary, and Romania | Long term (≥ 4 years) |
| Precision-feeding and micro-encapsulation tech | +0.5% | Germany, Netherlands, Denmark, Nordic cluster | Medium term (2-4 years) |
| Accelerated EFSA (European Food Safety Authority) approvals for novel additives | +0.4% | EU27 except the United Kingdom and Switzerland | Short term (≤ 2 years) |
| Carbon-footprint labeling by retailers | +0.3% | Germany, the United Kingdom, and France | Long term (≥ 4 years) |
| Blockchain traceability in aqua-feed chains | +0.2% | Norway, Scotland, Ireland | Medium term (2-4 years) |
| Source: Mordor Intelligence | |||
EU Ban on Antibiotic Growth Promoters
The 2022 prohibition removed long-standing antimicrobial feed additives from commercial rations, forcing every European livestock segment to seek equally effective yet non-antibiotic solutions[1]Source: European Medicines Agency, “Guidelines on Antimicrobial Resistance,” ema.europa.eu. In the first six months after the rule took effect, average feed-conversion ratios slipped 3-5%, highlighting the efficiency gap created by the ban. Producers responded by rapidly trialing organic acids, probiotics, and phytogenic blends that stabilize gut flora and curb pathogens without triggering antimicrobial resistance. National extension services in Germany and the Netherlands now publish best-practice guides that rank acidifier blends by efficacy under different housing conditions. The change has permanently shifted research budgets toward biological performance enhancers, setting the tone for future product development across the region.
Rising Meat Consumption in Eastern Europe
Consumer purchasing power in Poland, the Czech Republic, Hungary, and Romania rose between 15% and 25% per year from 2020 to 2024, lifting demand for poultry and pork to levels approaching Western norms[2]Source: Polish Ministry of Agriculture, “Livestock Production 2024,” gov.pl . Poland alone reached 47 kg of poultry per capita in 2024, up 18% in four years and supported by modern, vertically integrated production complexes. The surge in volume requires tighter nutrient density and higher additive inclusion to maintain growth rates without proportionally expanding livestock head counts. Swine operations in Romania and Bulgaria use amino acid-rich premixes, propionic acid, and mycotoxin detoxifiers to support 35% herd expansion while meeting EU welfare rules. Feed mills across the region, therefore, invest in precision dosers and enzyme packages that extract more usable energy from local grain varieties.
Precision-Feeding and Micro-Encapsulation Tech
Precision feeding links sensor-based animal monitoring with automatic micro-dosing equipment, allowing real-time adjustments to lysine, enzymes, and probiotics that lift feed efficiency 8 to 12% in large barns. Micro-encapsulation shields heat-sensitive compounds during pelleting and extends shelf life from under eight months to as long as two years, cutting waste and safeguarding potency. German equipment suppliers supply spray-dry and fluid-bed coaters that release nutrients at specific digestive tract pH levels, which lowers inclusion rates by up to 25% without compromising performance. French dairy herds use rumen-protected amino acids that bypass pre-gastric breakdown, while Nordic broiler farms favor coated essential oils that reach the small intestine intact. Combined, these innovations turn feed from a bulk input into a data-driven performance lever that fits retail sustainability scorecards.
Accelerated EFSA Approvals for Novel Additives
The European Food Safety Authority revised its guidance in early 2024, clarifying efficacy endpoints and accepting alternative test methods; as a result, dossier review times fell from about 18 months to roughly 12 months for many probiotic and phytogenic products[3]Source: European Food Safety Authority, “Feed Additives Overview,” efsa.europa.eu. Faster clearance has already brought new Bacillus subtilis strains for broilers and essential-oil blends for methane reduction to market, broadening the toolbox for antibiotic-free production. Smaller biotechnology firms now see a clearer path to commercial payback, prompting a 45% jump in additive-focused R&D spending across Europe. Switzerland and Norway voluntarily align their national processes with EFSA to ensure smooth trade into the European Union, enlarging the potential customer base for each newly approved product. The streamlined pipeline ensures producers gain quicker access to cutting-edge solutions while regulators maintain rigorous safety and efficacy standards.
Restraints Impact Analysis*
| Restraint | (~) % Impact on CAGR Forecast | Geographic Relevance | Impact Timeline |
|---|---|---|---|
| Volatile amino-acid raw-material prices | −0.7% | Germany, Netherlands, region-wide | Short term (≤ 2 years) |
| High REACH and additive registration costs | −0.5% | EU27 | Long term (≥ 4 years) |
| Slow farmer adoption of phytogenics | −0.3% | Italy, Spain, Greece | Medium term (2-4 years) |
| Rare-earth trace-mineral supply disruptions | −0.2% | Europe-wide specialty premix hubs | Medium term (2-4 years) |
| Source: Mordor Intelligence | |||
Volatile Amino-Acid Raw Material Prices
Methionine and lysine spot prices swung 30% and 25% respectively during 2024 as Chinese producers idled plants for environmental upgrades and energy costs spiked, leaving European premix blenders exposed to quarterly price resets they could not immediately pass along to livestock customers. Forward contracts offered only partial shelter because suppliers retained escalation clauses tied to raw-material indices, so manufacturers absorbed margin hits for one to two production cycles before renegotiating feed formulas. Smaller regional mills, which lack hedging desks or long-term take-or-pay deals, responded by lowering synthetic inclusion rates and adding soybean meal or rapeseed cake, a shift that cut performance consistency and raised nitrogen output per animal. Volatility also discouraged inventory buildup; premix makers trimmed safety stocks to conserve cash, which in turn heightened supply-chain risk whenever Asian shipments slipped. The financial pressure has intensified calls for on-shore methionine and lysine capacity in Europe and pushed nutritionists to trial precision-coated amino acids that require lower dosages yet hold bioavailability.
High REACH and Feed-Additive Registration Costs
Securing a full Registration, Evaluation, Authorization, and Restriction of Chemicals file often costs EUR 0.5 to 1.0 million (USD 0.55 to 1.09 million) and demands ongoing annual monitoring outlays near EUR 100,000 (USD 109,000), a burden that quickly absorbs the cash reserves of many start-up biotechnology firms. Each active ingredient in a multi-component blend requires its own dossier, so innovative composite products face multiplied paperwork and testing cycles that can stretch beyond two years. The expense favors multinational incumbents with dedicated regulatory teams and global safety labs, thereby narrowing the competitive field and slowing the flow of niche solutions aimed at gut health, mycotoxin binding, or methane reduction. Smaller inventors increasingly license intellectual property to large feed companies instead of launching independent brands, trading upside potential for regulatory certainty. While the system preserves high safety standards, it also concentrates market power and limits farmers’ access to diverse additive choices—an unintended consequence that industry groups have begun to flag in consultations with Brussels policymakers.
*Our forecasts treat driver/restraint impacts as directional, not additive. The impact forecasts reflect baseline growth, mix effects, and variable interactions.
Segment Analysis
By Additives: Amino Acids Anchor Leadership while Probiotics Accelerate
Amino acids held 47.10% of 2025 revenue in the European animal feed additives market. Antioxidants recorded the highest CAGR of 4.21% during the forecast period. Propionic acid heads the list because it preserves feed and fights Salmonella. Minerals, binders, vitamins, and antioxidants keep rations balanced and stable, with each component experiencing strong yet steady growth. Probiotics and prebiotics are anticipated to account for a combined good share percentage in 2025, drawing attention with their antibiotic-free claims.
Phytogenics still account for a low market share, yet round out methane and welfare programs, while pigments handle fish color and egg yolk tone. The next wave of value comes from micro-encapsulated carriers that trim dosage without compromising performance. Enzyme makers bundle technical support and digital dashboards to demonstrate return on investment, which underpins premium prices amid fluctuations in raw materials.


By Animal: poultry leads, while swine shows the strongest growth
Poultry consumed 33.70% of additives in 2025 within the European animal feed additives market. Broiler integrators rely on lysine-rich, probiotic-enhanced diets to support rapid growth. Layer complexes need coated methionine to keep shell strength. Swine records the highest 4.06% CAGR as Eastern Europe scales modern barns. Acidifiers lower post-wean scour, and carbohydrases unlock energy from high-fiber rations.
Ruminants keep a modest share, fueled by dairy herds that adopt methane-cutting phytogenics and rumen-protected amino acids. Aquaculture, with a minor share percentage, is represented by Nordic salmon and Mediterranean sea bream. Specialty categories such as pet food and equine lines make up a low market share yet carry premium price points that spark formulation research.
Geography Analysis
Spain sits at the top of the European animal feed additives market with a 15.65% share in 2025. Integrated pork chains in Catalonia and Castile-León adopt high-spec premixes that push feed efficiency and carcass yield. Spain also pioneers propionic acid in wet-feed systems that thrive in its warm climate. Collaboration among universities in Zaragoza and Valencia speeds lab-to-farm trials and keeps adoption curves steep. Germany is second owing to the domestic suppliers like BASF and Evonik shorten lead times and tailor blends to regulatory targets on nutrient excretion and greenhouse gas. Bavaria’s dairy corridor uses rumen-protected choline and methionine, and Lower Saxony’s pig barns deploy sensor-based feeders that align additive dosing with growth curves. Subsidies for circular agriculture encourage mills to pick enzymes that lower phosphorus runoff, giving phytase a solid foothold.
France stands out with a 4.73% CAGR to 2031. Brittany’s pasture plus concentrate model demands methane-cutting phytogenics. Normandy dairy herds incorporate algae-based beta-carotene that lifts fertility. The government ties carbon audits to low-interest loans, so farms demonstrate measurable reductions by adopting enzyme and probiotic stacks. The United Kingdom occupies a modest share percentage, driven by regulatory independence that lets the Food Standards Agency rubber-stamp new strains ahead of EU approval. Scottish salmon sites order blockchain-logged feeds heavy in pigment and omega-3 additives, while English broiler units integrate weight cameras that sync with automatic probiotic dosing.
Eastern Europe remains the volume engine. Poland grows poultry faster than any neighbor, raising lysine demand. Hungary and the Czech Republic retrofit mills with smart blenders that meter carbohydrases. Romania and Bulgaria channel rural development grants into modern swine barns and aqua farms. Each step lifts additive penetration and moves the European animal feed additives market farther into precision nutrition territory.
Competitive Landscape
The Europe animal feed additives market shows moderate concentration with majority of sales held by the top five firms. Evonik helds the leading share thanks to deep methionine output and bulk shipping links. BASF rules antioxidants and organic acids, now that its Ludwigshafen expansion boosts vitamin E by 30%. Novonesis has taken full control of DSM-Firmenich’s enzyme business deal and now integrates the Danish and Chinese plants under one label. Adisseo opened a methionine factory in Burgos to reduce its reliance on Asian supply and promote renewable energy.
Niche innovators thrive in acidifier, phytogenic, and blockchain-verified organic lines. EW Nutrition snapped up Austria’s Green Innovation to own essential oil IP, while Kemin set up a Belgium lab that trims antioxidant development time by 40%. Alltech and Ynsect target salmon feed with insect protein that carries a smaller carbon stamp than fishmeal. Digital partnerships join additive companies with sensor and software firms, embedding dose algorithms inside barn hardware.
Supply resilience ranks high. Firms lock dual methionine sources and store rare-earth minerals inside bonded warehouses. Intellectual property stays guarded, yet suppliers share anonymized data to validate carbon cuts, which cements customer loyalty despite volatile raw-material pricing.
Europe Feed Additives Industry Leaders
Evonik Industries AG
SHV (Nutreco NV)
Cargill Inc.
Archer Daniel Midland Co.
BASF SE
- *Disclaimer: Major Players sorted in no particular order


Recent Industry Developments
- March 2025: EW Nutrition finalized the acquisition of Green Innovation, an Austrian phytogenic specialist, integrating a suite of essential-oil formulas proven to lower pathogenic bacteria counts in poultry while improving weight gain. The deal expands EW Nutrition’s natural additive line and adds a dedicated R&D center in Vienna for accelerated product customization.
- February 2025: Novonesis purchased DSM-Firmenich’s remaining 50% stake in Feed Enzyme Alliance, gaining full ownership of Danish and Chinese production hubs. Control of proprietary phytase and xylanase strains allows unified branding and cross-application research to optimize enzyme cocktails for low-protein diets.


Europe Feed Additives Market Report Scope
By Additives
| Acidifiers | By Sub Additive | Fumaric Acid |
| Lactic Acid | ||
| Propionic Acid | ||
| Other Acidifiers | ||
| Amino Acids | By Sub Additive | Lysine |
| Methionine | ||
| Threonine | ||
| Tryptophan | ||
| Other Amino Acids | ||
| Antibiotics | By Sub Additive | Bacitracin |
| Penicillins | ||
| Tetracyclines | ||
| Tylosin | ||
| Other Antibiotics | ||
| Antioxidants | By Sub Additive | Butylated Hydroxyanisole (BHA) |
| Butylated Hydroxytoluene (BHT) | ||
| Citric Acid | ||
| Ethoxyquin | ||
| Propyl Gallate | ||
| Tocopherols | ||
| Other Antioxidants | ||
| Binders | By Sub Additive | Natural Binders |
| Synthetic Binders | ||
| Enzymes | By Sub Additive | Carbohydrases |
| Phytases | ||
| Other Enzymes | ||
| Flavors and Sweeteners | By Sub Additive | Flavors |
| Sweeteners | ||
| Minerals | By Sub Additive | Macrominerals |
| Microminerals | ||
| Mycotoxin Detoxifiers | By Sub Additive | Binders |
| Biotransformers | ||
| Phytogenics | By Sub Additive | Essential Oil |
| Herbs and Spices | ||
| Other Phytogenics | ||
| Pigments | By Sub Additive | Carotenoids |
| Curcumin and Spirulina | ||
| Prebiotics | By Sub Additive | Fructo Oligosaccharides |
| Galacto Oligosaccharides | ||
| Inulin | ||
| Lactulose | ||
| Mannan Oligosaccharides | ||
| Xylo Oligosaccharides | ||
| Other Prebiotics | ||
| Probiotics | By Sub Additive | Bifidobacteria |
| Enterococcus | ||
| Lactobacilli | ||
| Pediococcus | ||
| Streptococcus | ||
| Other Probiotics | ||
| Vitamins | By Sub Additive | Vitamin A |
| Vitamin B | ||
| Vitamin C | ||
| Vitamin E | ||
| Other Vitamins | ||
| Yeast | By Sub Additive | Live Yeast |
| Selenium Yeast | ||
| Spent Yeast | ||
| Torula Dried Yeast | ||
| Whey Yeast | ||
| Yeast Derivatives |
By Animal
| Ruminants |
| Poultry |
| Swine |
| Aquaculture |
| Other Animals |
By Geography
| Germany |
| United Kingdom |
| France |
| Spain |
| Russia |
| Italy |
| Netherlands |
| Turkey |
| Rest of Europe |
| By Additives | Acidifiers | By Sub Additive | Fumaric Acid |
| Lactic Acid | |||
| Propionic Acid | |||
| Other Acidifiers | |||
| Amino Acids | By Sub Additive | Lysine | |
| Methionine | |||
| Threonine | |||
| Tryptophan | |||
| Other Amino Acids | |||
| Antibiotics | By Sub Additive | Bacitracin | |
| Penicillins | |||
| Tetracyclines | |||
| Tylosin | |||
| Other Antibiotics | |||
| Antioxidants | By Sub Additive | Butylated Hydroxyanisole (BHA) | |
| Butylated Hydroxytoluene (BHT) | |||
| Citric Acid | |||
| Ethoxyquin | |||
| Propyl Gallate | |||
| Tocopherols | |||
| Other Antioxidants | |||
| Binders | By Sub Additive | Natural Binders | |
| Synthetic Binders | |||
| Enzymes | By Sub Additive | Carbohydrases | |
| Phytases | |||
| Other Enzymes | |||
| Flavors and Sweeteners | By Sub Additive | Flavors | |
| Sweeteners | |||
| Minerals | By Sub Additive | Macrominerals | |
| Microminerals | |||
| Mycotoxin Detoxifiers | By Sub Additive | Binders | |
| Biotransformers | |||
| Phytogenics | By Sub Additive | Essential Oil | |
| Herbs and Spices | |||
| Other Phytogenics | |||
| Pigments | By Sub Additive | Carotenoids | |
| Curcumin and Spirulina | |||
| Prebiotics | By Sub Additive | Fructo Oligosaccharides | |
| Galacto Oligosaccharides | |||
| Inulin | |||
| Lactulose | |||
| Mannan Oligosaccharides | |||
| Xylo Oligosaccharides | |||
| Other Prebiotics | |||
| Probiotics | By Sub Additive | Bifidobacteria | |
| Enterococcus | |||
| Lactobacilli | |||
| Pediococcus | |||
| Streptococcus | |||
| Other Probiotics | |||
| Vitamins | By Sub Additive | Vitamin A | |
| Vitamin B | |||
| Vitamin C | |||
| Vitamin E | |||
| Other Vitamins | |||
| Yeast | By Sub Additive | Live Yeast | |
| Selenium Yeast | |||
| Spent Yeast | |||
| Torula Dried Yeast | |||
| Whey Yeast | |||
| Yeast Derivatives | |||
| By Animal | Ruminants | ||
| Poultry | |||
| Swine | |||
| Aquaculture | |||
| Other Animals | |||
| By Geography | Germany | ||
| United Kingdom | |||
| France | |||
| Spain | |||
| Russia | |||
| Italy | |||
| Netherlands | |||
| Turkey | |||
| Rest of Europe | |||


Market Definition
- FUNCTIONS - For the study, feed additives are considered to be commercially manufactured products that are used to enhance characteristics such as weight gain, feed conversion ratio, and feed intake when fed in appropriate proportions.
- RESELLERS - Companies engaged in reselling feed additives without value addition have been excluded from the market scope, to avoid double counting.
- END CONSUMERS - Compound feed manufacturers are considered to be end-consumers in the market studied. The scope excludes farmers buying feed additives to be used directly as supplements or premixes.
- INTERNAL COMPANY CONSUMPTION - Companies engaged in the production of compound feed as well as the manufacturing of feed additives are part of the study. However, while estimating the market sizes, the internal consumption of feed additives by such companies has been excluded.
| Keyword | Definition |
|---|---|
| Feed additives | Feed additives are products used in animal nutrition for purposes of improving the quality of feed and the quality of food from animal origin, or to improve the animals’ performance and health. |
| Probiotics | Probiotics are microorganisms introduced into the body for their beneficial qualities. (It maintains or restores beneficial bacteria to the gut). |
| Antibiotics | Antibiotic is a drug that is specifically used to inhibit the growth of bacteria. |
| Prebiotics | A non-digestible food ingredient that promotes the growth of beneficial microorganisms in the intestines. |
| Antioxidants | Antioxidants are compounds that inhibit oxidation, a chemical reaction that produces free radicals. |
| Phytogenics | Phytogenics are a group of natural and non-antibiotic growth promoters derived from herbs, spices, essential oils, and oleoresins. |
| Vitamins | Vitamins are organic compounds, which are required for normal growth and maintenance of the body. |
| Metabolism | A chemical process that occurs within a living organism in order to maintain life. |
| Amino acids | Amino acids are the building blocks of proteins and play an important role in metabolic pathways. |
| Enzymes | Enzyme is a substance that acts as a catalyst to bring about a specific biochemical reaction. |
| Anti-microbial resistance | The ability of a microorganism to resist the effects of an antimicrobial agent. |
| Anti-microbial | Destroying or inhibiting the growth of microorganisms. |
| Osmotic balance | It is a process of maintaining salt and water balance across membranes within the body's fluids. |
| Bacteriocin | Bacteriocins are the toxins produced by bacteria to inhibit the growth of similar or closely related bacterial strains. |
| Biohydrogenation | It is a process that occurs in the rumen of an animal in which bacteria convert unsaturated fatty acids (USFA) to saturated fatty acids (SFA). |
| Oxidative rancidity | It is a reaction of fatty acids with oxygen, which generally causes unpleasant odors in animals. To prevent these, antioxidants were added. |
| Mycotoxicosis | Any condition or disease caused by fungal toxins, mainly due to contamination of animal feed with mycotoxins. |
| Mycotoxins | Mycotoxins are toxin compounds that are naturally produced by certain types of molds (fungi). |
| Feed Probiotics | Microbial feed supplements positively affect gastrointestinal microbial balance. |
| Probiotic yeast | Feed yeast (single-cell fungi) and other fungi used as probiotics. |
| Feed enzymes | They are used to supplement digestive enzymes in an animal’s stomach to break down food. Enzymes also ensure that meat and egg production is improved. |
| Mycotoxin detoxifiers | They are used to prevent fungal growth and to stop any harmful mold from being absorbed in the gut and blood. |
| Feed antibiotics | They are used both for the prevention and treatment of diseases but also for rapid growth and development. |
| Feed antioxidants | They are used to protect the deterioration of other feed nutrients in the feed such as fats, vitamins, pigments, and flavoring agents, thus providing nutrient security to the animals. |
| Feed phytogenics | Phytogenics are natural substances, added to livestock feed to promote growth, aid in digestion, and act as anti-microbial agents. |
| Feed vitamins | They are used to maintain the normal physiological function and normal growth and development of animals. |
| Feed flavors and sweetners | These flavors and sweeteners help to mask tastes and odors during changes in additives or medications and make them ideal for animal diets undergoing transition. |
| Feed acidifiers | Animal feed acidifiers are organic acids incorporated into the feed for nutritional or preservative purposes. Acidifiers enhance congestion and microbiological balance in the alimentary and digestive tracts of livestock. |
| Feed minerals | Feed minerals play an important role in the regular dietary requirements of animal feed. |
| Feed binders | Feed binders are the binding agents used in the manufacture of safe animal feed products. It enhances the taste of food and prolongs the storage period of the feed. |
| Key Terms | Abbreviation |
| LSDV | Lumpy Skin Disease Virus |
| ASF | African Swine Fever |
| GPA | Growth Promoter Antibiotics |
| NSP | Non-Starch Polysaccharides |
| PUFA | Polyunsaturated Fatty Acid |
| Afs | Aflatoxins |
| AGP | Antibiotic Growth Promoters |
| FAO | The Food And Agriculture Organization of the United Nations |
| USDA | The United States Department of Agriculture |


Research Methodology
Mordor Intelligence follows a four-step methodology in all our reports.
- Step-1: IDENTIFY KEY VARIABLES: In order to build a robust forecasting methodology, the variables and factors identified in Step-1 are tested against available historical market numbers. Through an iterative process, the variables required for market forecast are set and the model is built on the basis of these variables.
- Step-2: Build a Market Model: Market-size estimations for the forecast years are in nominal terms. Inflation is not a part of the pricing, and the average selling price (ASP) is kept constant throughout the forecast period.
- Step-3: Validate and Finalize: In this important step, all market numbers, variables and analyst calls are validated through an extensive network of primary research experts from the market studied. The respondents are selected across levels and functions to generate a holistic picture of the market studied.
- Step-4: Research Outputs: Syndicated Reports, Custom Consulting Assignments, Databases & Subscription Platforms


