Fault Circuit Indicator Market Size and Share
Market Overview
| Study Period | 2019 - 2030 |
|---|---|
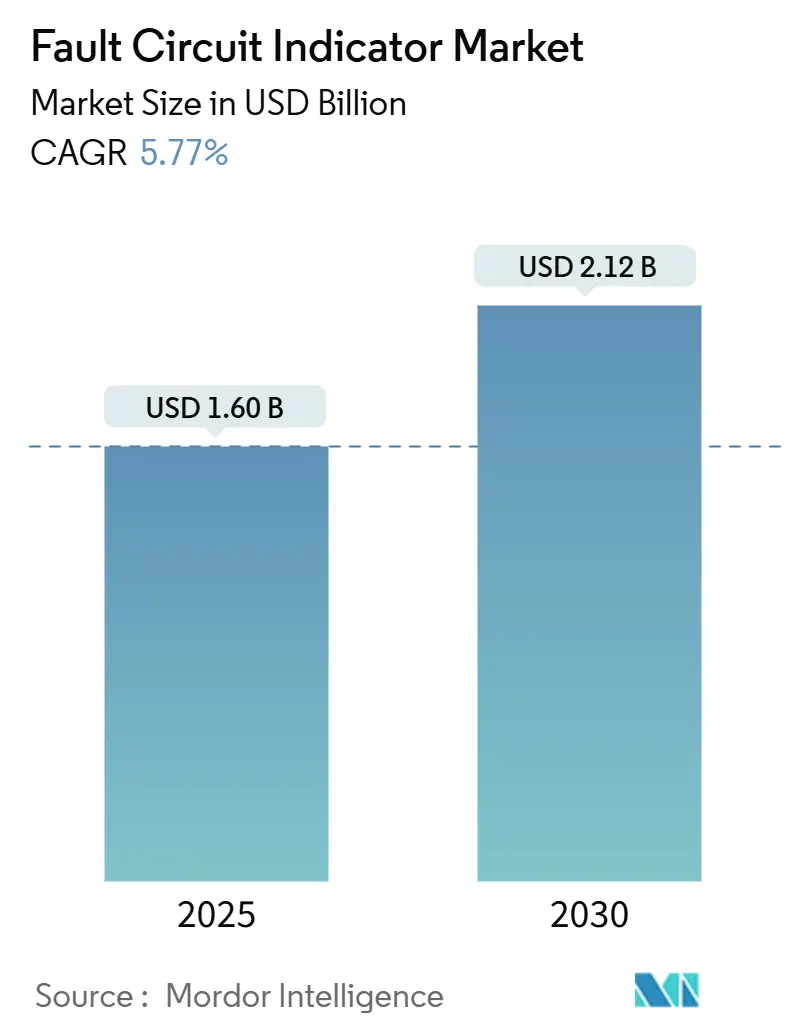
| Market Size (2025) | USD 1.60 Billion |
| Market Size (2030) | USD 2.12 Billion |
| Growth Rate (2025 - 2030) | 5.77% CAGR |
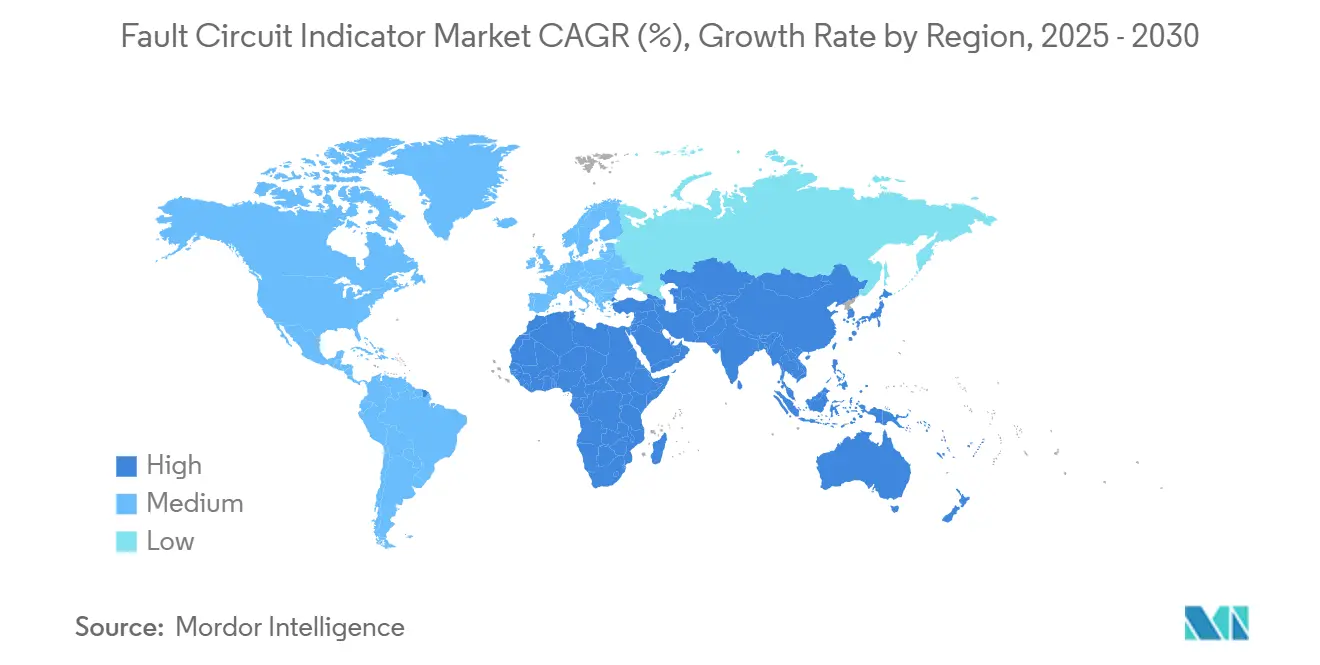
| Fastest Growing Market | Asia Pacific |
| Largest Market | Asia Pacific |
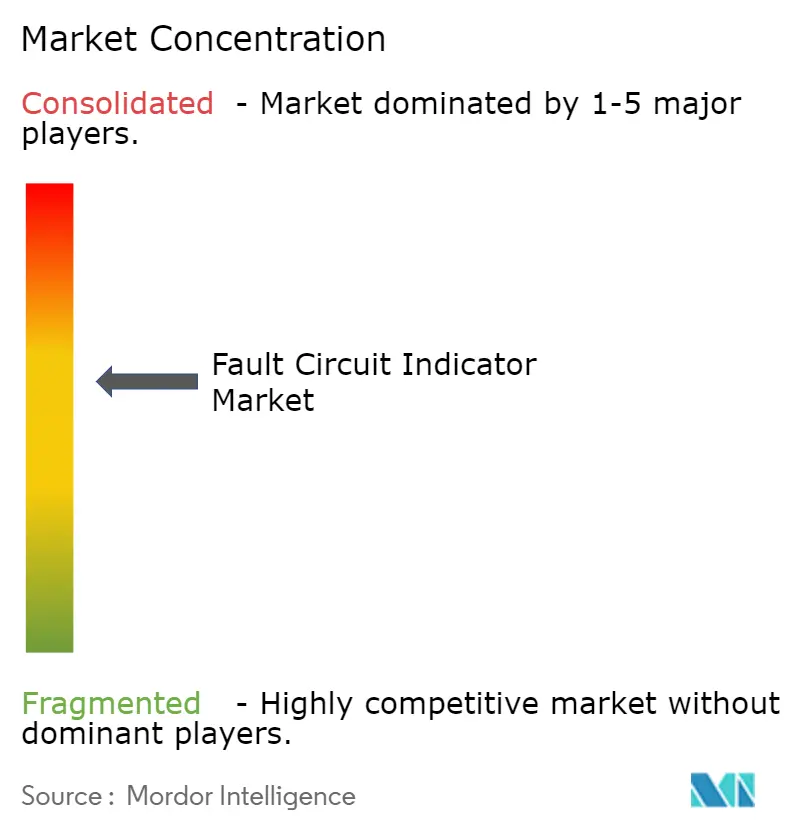
| Market Concentration | Medium |
Major Players *Disclaimer: Major Players sorted in no particular order Image © Mordor Intelligence. Reuse requires attribution under CC BY 4.0. | |
Fault Circuit Indicator Market Analysis by Mordor Intelligence
The fault circuit indicator market size reached USD 1.6 billion in 2025 and is projected to increase to USD 2.12 billion by 2030, growing at a steady 5.77% CAGR. Rising grid modernization funding, reliability mandates, and the rapid integration of distributed energy continue to push utilities toward intelligent fault-detection systems that shorten outage durations and improve resilience. Annual global grid-modernization outlays already top USD 100 billion, and fault indicators often deliver payback within a single year. [1]European Commission, “Grids, the Missing Link – An EU Action Plan for Grids,” Europa.eu
Key Report Takeaways
- By product type, overhead line fault indicators held 45.00% of the fault circuit indicator market share in 2024, while sensor-integrated devices are projected to post a 5.90% CAGR through 2030.
- By voltage class, medium-voltage solutions accounted for 57.00% of the fault circuit indicator market size in 2024; low-voltage systems are projected to grow at a 6.01% CAGR through 2030.
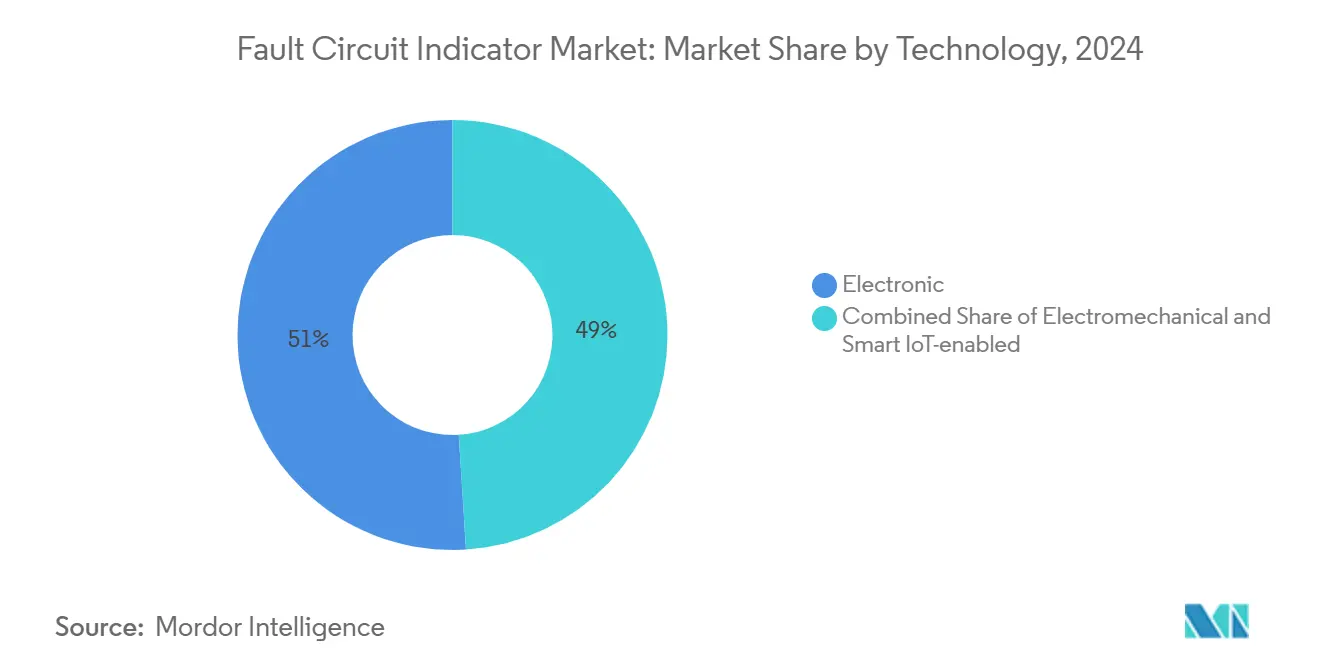
- By technology, electronic designs accounted for 50.20% of 2024 revenue, whereas smart IoT-enabled offerings are projected to advance at a robust 7.20% CAGR.
- By end user, electric utilities commanded 64.23% of the fault circuit indicator market share in 2024, while renewable power plants are projected to achieve a 6.50% CAGR through 2030.
- By region, the Asia-Pacific region accounted for 37.34% of 2024 revenues and is forecast to grow at a 5.82% CAGR through 2030.
Global Fault Circuit Indicator Market Trends and Insights
Drivers Impact Analysis*
| DRIVER | (~) % IMPACT ON CAGR FORECAST | GEOGRAPHIC RELEVANCE | IMPACT TIMELINE |
|---|---|---|---|
| Rapid grid-modernisation and smart-grid roll-outs | +1.8% | Global; Asia-Pacific and EU lead | Medium term (2-4 years) |
| Reliability mandates to cut SAIDI/SAIFI | +1.2% | North America and EU, expanding to Asia-Pacific | Short term (≤ 2 years) |
| Urban underground-cabling boom | +0.9% | Asia-Pacific core, spill-over to MEA | Long term (≥ 4 years) |
| NB-IoT / LTE-M self-powered FCIs | +0.7% | Global, early adoption in developed markets | Medium term (2-4 years) |
| Predictive analytics using high-resolution FCI data | +0.6% | North America and EU, expanding globally | Long term (≥ 4 years) |
| Wildfire-mitigation sensor mandates | +0.5% | Western North America, Australia | Short term (≤ 2 years) |
| Source: Mordor Intelligence | |||
Rapid Grid-Modernisation and Smart-Grid Roll-Outs
Unprecedented grid investments make fault circuit indicators core elements of digital distribution projects. State Grid Corporation of China earmarked CNY 600 billion (USD 83 billion) in 2024 for ultra-high-voltage lines and digital upgrades, instantly lifting procurement for intelligent fault-location equipment.[2] 新浪财经, “国家电网投资规模创新高,” Sina.com.cn The European Action Plan for Grids allocates EUR 584 billion to reinforce resilience, creating parallel demand for self-healing architectures. Utilities increasingly link fault indicators to Advanced Distribution Management Systems that automate location, isolation, and service restoration. Alabama Power reported shorter restoration times once model-based FISR tied in live fault data. As each new sensor boosts network intelligence, incremental value rises, prompting utilities to scale deployments faster.
Reliability Mandates to Cut SAIDI/SAIFI
Regulators intensify pressure on utilities to limit service interruptions, triggering systematic roll-outs of fault indicators. California’s wildfire-safety framework obliges utilities to deploy detection gear across high-threat zones, accelerating sensor orders.[3]California Public Utilities Commission, “Wildfire Safety and Enforcement Branch,” Cpuc.ca.gov IEEE Standard 1366, used by many commissions, quantifies outage metrics, and shortfalls can result in penalties. Eugene Water and Electric Board achieved 99.44% reliability after upgrading detection across feeders, underscoring payback potential. European network codes mirror this scrutiny, obligating high-voltage operators to log every disturbance above 100 kV.[4]ENTSO-E, “Grid Disturbance Definitions for the Power System Above 100 kV,” Entso-e.eu The financial upside of avoiding penalties strengthens ROI cases even where capital budgets are tight.
Urban Underground-Cabling Boom
As cities bury more feeders to enhance aesthetics and resilience, specialized cable indicators gain traction. Partial-discharge detection on London’s 11 kV circuits proved continuous monitoring indispensable for early-fault warnings. In dense metros, excavation costs make outage avoidance critical; PacifiCorp earned a 15-times return after AI-based cable scanning averted failures. Integrating cable sensors with IoT gateways allows predictive maintenance that cuts emergency crew calls and traffic disruptions. These benefits resonate in Asia’s megacities, where public tolerance for outages is low and rerouting options are limited.
NB-IoT / LTE-M Self-Powered FCIs
Low-power cellular protocols reshape connectivity economics for remote fault indicators. NB-IoT and LTE-M deliver long-range coverage with minimal energy draw, supporting multi-year battery life in pole-top units. Because devices piggyback on public networks, utilities avoid constructing private backhauls, speeding deployments. Field trials show smooth firmware updates and two-way control, paving the way for dynamic protection settings. As chipsets mature, module costs fall, making mass instrumentation of secondary feeders feasible even for small cooperatives.
Restraint Impact Analysis*
| RESTRAINT | (~) % IMPACT ON CAGR FORECAST | GEOGRAPHIC RELEVANCE | IMPACT TIMELINE |
|---|---|---|---|
| High retrofit CAPEX for legacy feeders | -0.8% | Global, especially mature systems | Medium term (2-4 years) |
| Accuracy limits under low-load faults | -0.4% | Global, rural and industrial sites | Long term (≥ 4 years) |
| Cyber-security certification delays | -0.3% | North America and EU, spreading globally | Short term (≤ 2 years) |
| Core-material supply constraints | -0.2% | Global, supply-chain dependent | Medium term (2-4 years) |
| Source: Mordor Intelligence | |||
High Retrofit CAPEX for Legacy Feeders
Installing modern fault circuit indicators on older lines often requires de-energizing circuits, crane access, and new communications gear. Total installed cost can top USD 10,000 per location. Dense urban grids push costs higher when underground feeders need street permits and traffic control. Budget cycles at investor-owned utilities extend evaluations, delaying large-scale roll-outs. Rural cooperatives serving sparse loads face steeper economics, as recovery per customer drops sharply.
Accuracy Limits Under Low-Load Faults
Traditional electromechanical designs struggle with high-impedance or low-current faults common on rural laterals and some industrial loops. PG&E has documented cases where legacy devices missed dangerous faults that later sparked fires, prompting reassessments of detection thresholds. Even electronic models exhibit physics-based limits when voltage remains high but current barely rises. Distributed energy resources further distort waveforms, complicating signature recognition. Utilities thus hesitate to rely solely on indicators in these settings, tempering adoption speed.
*Our forecasts treat driver/restraint impacts as directional, not additive. The impact forecasts reflect baseline growth, mix effects, and variable interactions.
Segment Analysis
By Product Type: Overhead Deployment Remains the Anchor Segment
Overhead line indicators accounted for 45.00% of 2024 revenue, reflecting the vast installed base of aerial conductors worldwide that still lacks automated visibility. The fault circuit indicator market size for overhead applications is expected to rise steadily as utilities retrofit legacy feeders to cut patrol time. Sensor-integrated models, which pair fault detection with temperature and vibration sensing, are projected to expand at a 5.90% CAGR, demonstrating how multipurpose hardware strengthens investment cases.
Growth momentum is strongest where rural electrification continues and line patrol costs are high. TE Connectivity’s IKI-Overhead unit, now compliant with IEEE 495 and cellular-ready, demonstrates how vendors address both detection accuracy and remote reporting challenges. Customizable thresholds enable engineers to calibrate devices without requiring code changes, thereby reducing commissioning time. As cloud dashboards gain traction, field technicians receive alerts in minutes, shaving outage durations and improving reliability metrics.


Medium-Voltage Controls Majority Share While Low-Voltage Surges
Medium-voltage feeders, ranging from 1 kV to 36 kV, dominated demand, accounting for 57.00% of 2024 spending and serving as the backbone of utility business cases. Utilities install indicators on these circuits to drive automated switching, directly improving customer-minute lost metrics. Low-voltage networks, those below 1 kV, are growing at the fastest rate, with a 6.01% CAGR, as industrial electrification and rooftop solar create new protection gaps. The fault circuit indicator market share gains in low-voltage reflect tighter power-quality tolerances and growing safety scrutiny around EV chargers.
Advanced disturbance recorders help validate that low-voltage indicators detect faults in complex load environments. Industrial users, such as Tenaris, rely on ABB’s continuous monitoring to maintain high uptime for 460 motors. These case studies reinforce payback claims and encourage broader adoption across the manufacturing sector.
Electronic Units Hold Lead While IoT-Based Solutions Pace Future Sales
Electronic FCIs held 50.20% of the Fault Circuit Indicator market size in 2024, replacing older electromechanical flags with solid-state current sensors and LED status displays. Rural distribution companies still purchase electromechanical units where budget overrides intelligence needs, but new procurement is shifting sharply toward smart IoT-enabled devices, which are forecast to post a 7.20% CAGR.
The fault circuit indicators embed microcontrollers that run edge analytics algorithms to distinguish between transient and permanent faults, reducing false-truck rolls by 35-40%. Compliance with IEC 62443 cybersecurity standards has become a baseline requirement for bids, ensuring secure authentication and encrypted telemetry.
Renewable Plants Drive Fastest Adoption
Electric utilities retained 64.23% of their 2024 revenue because reliability metrics and associated penalties are directly reflected on their balance sheets. Investor-owned utilities in mature markets systematically deploy FCIs along every feeder section, whereas municipal and cooperative counterparts prioritize high-risk circuits where budgets permit.
Renewable power plants represent the fastest-growing cohort, with a 6.50% CAGR, spurred by interconnection rules that require continuous ground-fault supervision on collector systems. Solar farms fit indicators inside combiner boxes to detect DC ground faults, and wind farms place devices along buried medium-voltage cables that connect turbines to substations. Industrial facilities and commercial campuses also expand adoption to support predictive-maintenance programs that curb unplanned downtime.
Geography Analysis
Asia-Pacific commanded 37.34% of 2024 revenue and is projected to outpace all regions with a 5.82% CAGR through 2030. China’s State Grid earmarked USD 27 billion for smart-grid upgrades in 2024, with fault detection systems forming a core component of distribution-automation budgets. India directed USD 12 billion toward transmission and distribution improvements, prioritizing automated isolation functions in rural electrification schemes. Advanced economies, such as Japan and South Korea, are rapidly adopting IoT-enabled designs that integrate with existing AMI and ADMS platforms, thereby extracting greater value from their prior digital investments.
North America follows, driven by wildfire-mitigation rules that mandate rapid fault detection along high-risk corridors. PG&E’s USD 5.96 billion, three-year mitigation plan cements California as a sensor hotspot. Mature grids across the continent present opportunities for retrofitting; Oncor’s integrated analytics roadmap in Texas illustrates how legacy utilities merge new sensors with outage-management suites to enhance service restoration. High retrofit CAPEX tempers the pace, but rising reliability penalties keep projects moving forward.
Europe benefits from the EU’s EUR 584 billion grid-funding program. Strict ENTSO-E reporting standards and national energy-transition agendas create fertile ground for IoT-enabled devices that support bidirectional flows. Nordic utilities pioneer smart fault handling with directional earth-fault indicators, proving interoperability across multivendor networks. As smart-meter mandates accelerate digital infrastructure, indicators gain additional communication pathways, lifting ROI for full-service deployments.

Competitive Landscape
The market sits in moderate fragmentation. Veterans such as Schweitzer Engineering Laboratories, Siemens, and ABB use long-standing utility relationships and certified performance histories to protect their share. Specialized IoT entrants emphasize AI-driven analytics delivered via cloud platforms, thereby lowering entry barriers associated with communication infrastructure. AURA Technologies’ GroundFaultInsight system pinpoints faults within 3 meters, demonstrating how AI can outperform legacy patrol techniques.
Patent data indicate a surge in filings for synthetic fault injection tools and multi-channel sensing, indicating sustained R&D investment. Copper shortages pose cost risks, prompting vendors to adopt material-light designs or explore alternative alloys. Partnerships emerge between hardware OEMs and software analytics firms to combine detection hardware with predictive maintenance services. Utilities are increasingly awarding contracts that bundle long-term data services, favoring suppliers capable of providing full-stack offerings. Competitive intensity is expected to increase as cloud-native entrants win pilot programs that demonstrate total-cost advantages over incumbent solutions.
Fault Circuit Indicator Industry Leaders
Schweitzer Engineering Laboratories, Inc.
Siemens AG
ABB Ltd.
Eaton Corporation plc
Schneider Electric SE
- *Disclaimer: Major Players sorted in no particular order

Recent Industry Developments
- January 2025: State Grid Corporation of China completed 30,000 km of new ultra-high-voltage lines incorporating advanced fault detection.
- November 2024: Siemens rolled out Electrification X Overhead Line Fault Management, a mobile-first cloud service.
- October 2024: ABB finalized condition-monitoring deployment on 460 motors at Tenaris’s Dalmine facility.
- July 2024: European Commission endorsed a EUR 584 billion grids action plan emphasizing smart fault detection.


Global Fault Circuit Indicator Market Report Scope
| Overhead Line Fault Indicator |
| Underground Cable Fault Indicator |
| Panel-mounted Fault Indicator |
| Sensor-integrated FCI |
| Low Voltage (Less than1 kV) |
| Medium Voltage (1 to 36 kV) |
| High Voltage (Above36 kV) |
| Electromechanical |
| Electronic |
| Smart IoT-enabled |
| Electric Utilities |
| Industrial Facilities |
| Commercial and Institutional |
| Renewable Power Plants |
| North America | United States | |
| Canada | ||
| Mexico | ||
| South America | Brazil | |
| Argentina | ||
| Chile | ||
| Rest of South America | ||
| Europe | Germany | |
| United Kingdom | ||
| France | ||
| Italy | ||
| Spain | ||
| Rest of Europe | ||
| Asia-Pacific | China | |
| Japan | ||
| India | ||
| South Korea | ||
| Australia | ||
| Singapore | ||
| Malaysia | ||
| Rest of Asia-Pacific | ||
| Middle East and Africa | Middle East | Saudi Arabia |
| United Arab Emirates | ||
| Turkey | ||
| Rest of Middle East | ||
| Africa | South Africa | |
| Nigeria | ||
| Rest of Africa | ||
| By Product Type | Overhead Line Fault Indicator | ||
| Underground Cable Fault Indicator | |||
| Panel-mounted Fault Indicator | |||
| Sensor-integrated FCI | |||
| By Voltage Class | Low Voltage (Less than1 kV) | ||
| Medium Voltage (1 to 36 kV) | |||
| High Voltage (Above36 kV) | |||
| By Technology | Electromechanical | ||
| Electronic | |||
| Smart IoT-enabled | |||
| By End User | Electric Utilities | ||
| Industrial Facilities | |||
| Commercial and Institutional | |||
| Renewable Power Plants | |||
| By Geography | North America | United States | |
| Canada | |||
| Mexico | |||
| South America | Brazil | ||
| Argentina | |||
| Chile | |||
| Rest of South America | |||
| Europe | Germany | ||
| United Kingdom | |||
| France | |||
| Italy | |||
| Spain | |||
| Rest of Europe | |||
| Asia-Pacific | China | ||
| Japan | |||
| India | |||
| South Korea | |||
| Australia | |||
| Singapore | |||
| Malaysia | |||
| Rest of Asia-Pacific | |||
| Middle East and Africa | Middle East | Saudi Arabia | |
| United Arab Emirates | |||
| Turkey | |||
| Rest of Middle East | |||
| Africa | South Africa | ||
| Nigeria | |||
| Rest of Africa | |||


Key Questions Answered in the Report
What is the projected value of the fault circuit indicator market by 2030?
The market is forecast to reach USD 2.12 billion by 2030.
Which region is expected to grow the fastest through 2030?
Asia-Pacific is set to expand at a 5.82% CAGR through 2030 due to large-scale smart-grid investments.
Why are sensor-integrated indicators gaining momentum?
They consolidate current, voltage, and temperature sensing into one unit, enabling predictive maintenance and regulatory reporting.
How do NB-IoT and LTE-M benefit fault-indicator deployments?
Low-power cellular protocols provide sub-second fault alerts and long battery life, reducing maintenance costs.
Page last updated on:


