Factoring Market Size and Share
Market Overview
| Study Period | 2020 - 2031 |
|---|---|
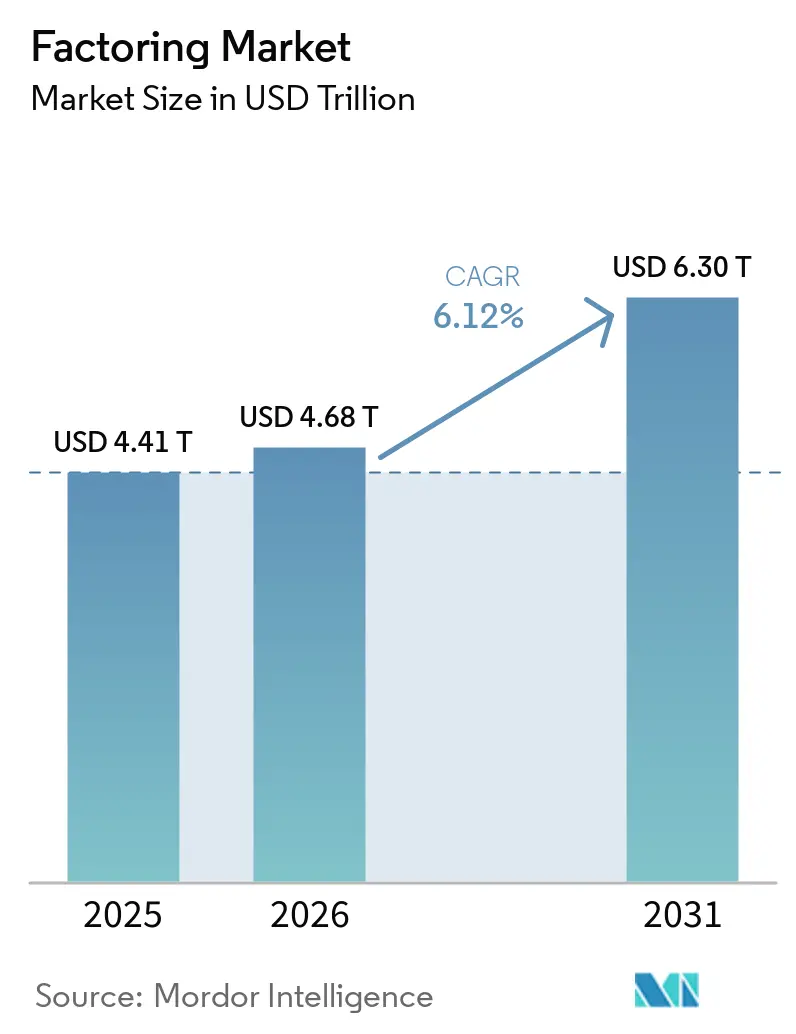
| Market Size (2026) | USD 4.68 Trillion |
| Market Size (2031) | USD 6.30 Trillion |
| Growth Rate (2026 - 2031) | 6.12% CAGR |
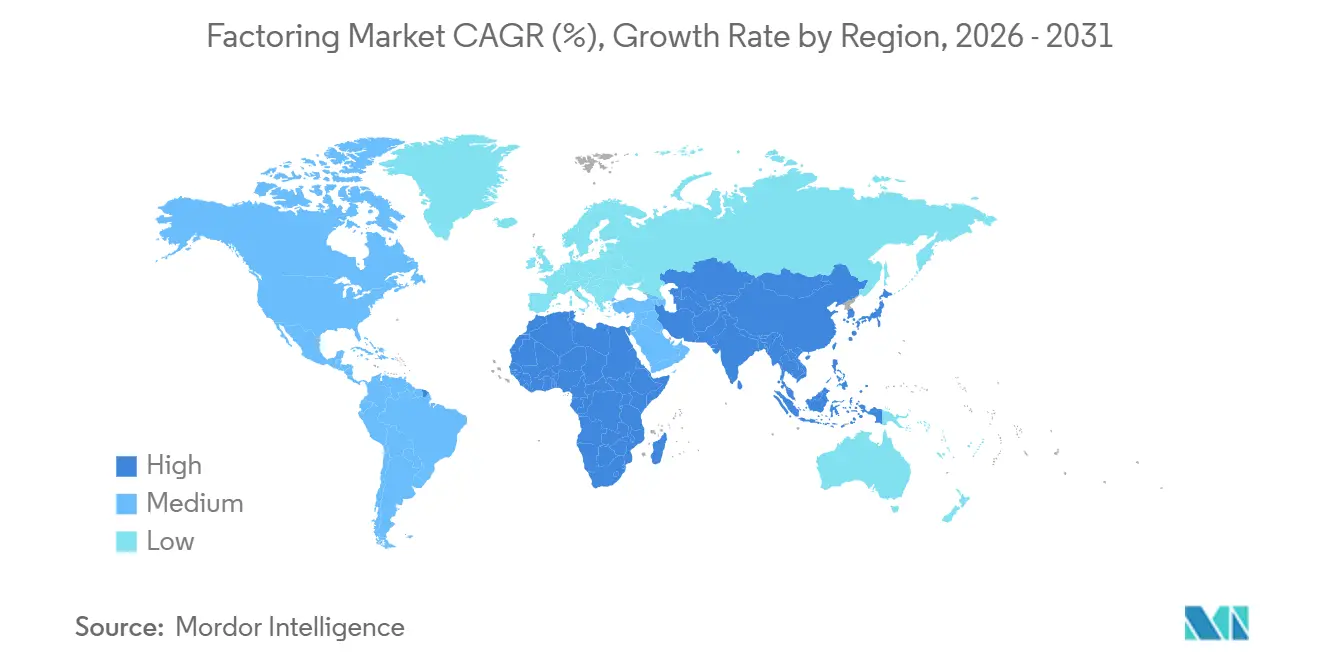
| Fastest Growing Market | Middle East and Africa |
| Largest Market | Europe |
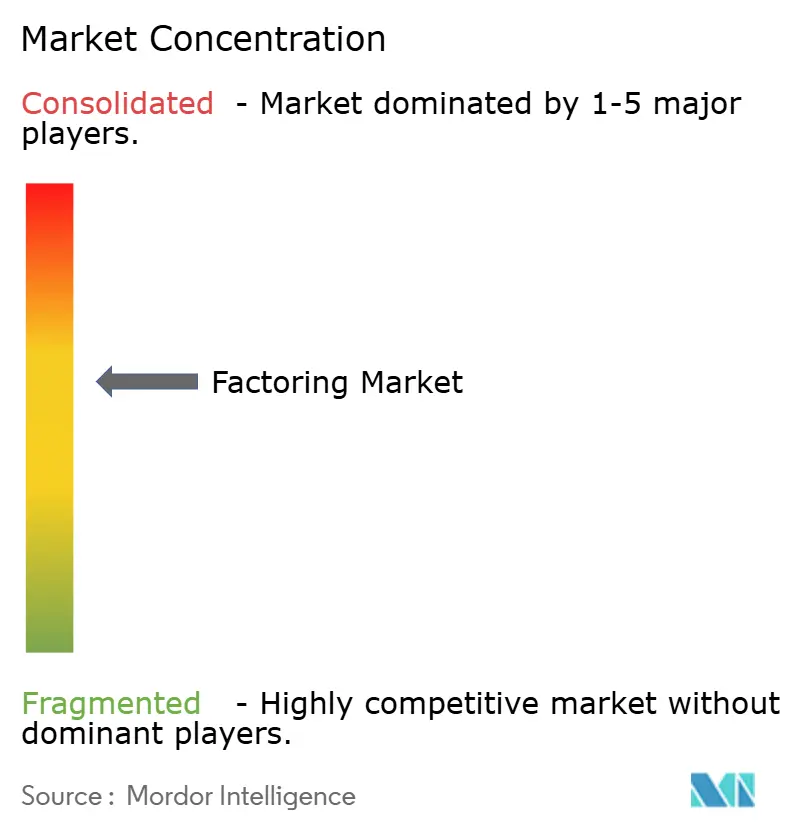
| Market Concentration | Medium |
Major Players *Disclaimer: Major Players sorted in no particular order Image © Mordor Intelligence. Reuse requires attribution under CC BY 4.0. | |
Factoring Market Analysis by Mordor Intelligence
The Factoring Market size is projected to expand from USD 4.41 trillion in 2025 and USD 4.68 trillion in 2026 to USD 6.30 trillion by 2031, registering a CAGR of 6.12% between 2026 to 2031.
Working-capital tightening and the European Union’s 60-day cap on business-to-business payment terms are increasing supplier demand for receivables-based liquidity, which supports broader adoption across the factoring market. [1]European Parliament, “European Parliament legislative resolution of 23 April 2024 on combating late payment in commercial transactions,” Official Journal of the European Union, europa.eu Europe remains the centre of activity by share, while the Middle East and Africa corridor shows the fastest growth outlook as digital platforms and payment innovations expand distribution for small firms. Banks still anchor the ecosystem, but non-bank platforms that embed underwriting into enterprise software and marketplaces are gaining ground, which is shaping competition in the factoring market. Domestic factoring continues to dominate volumes, yet cross-border e-commerce integrations and improved settlement options are helping international receivables financing scale within the market.
Key Report Takeaways
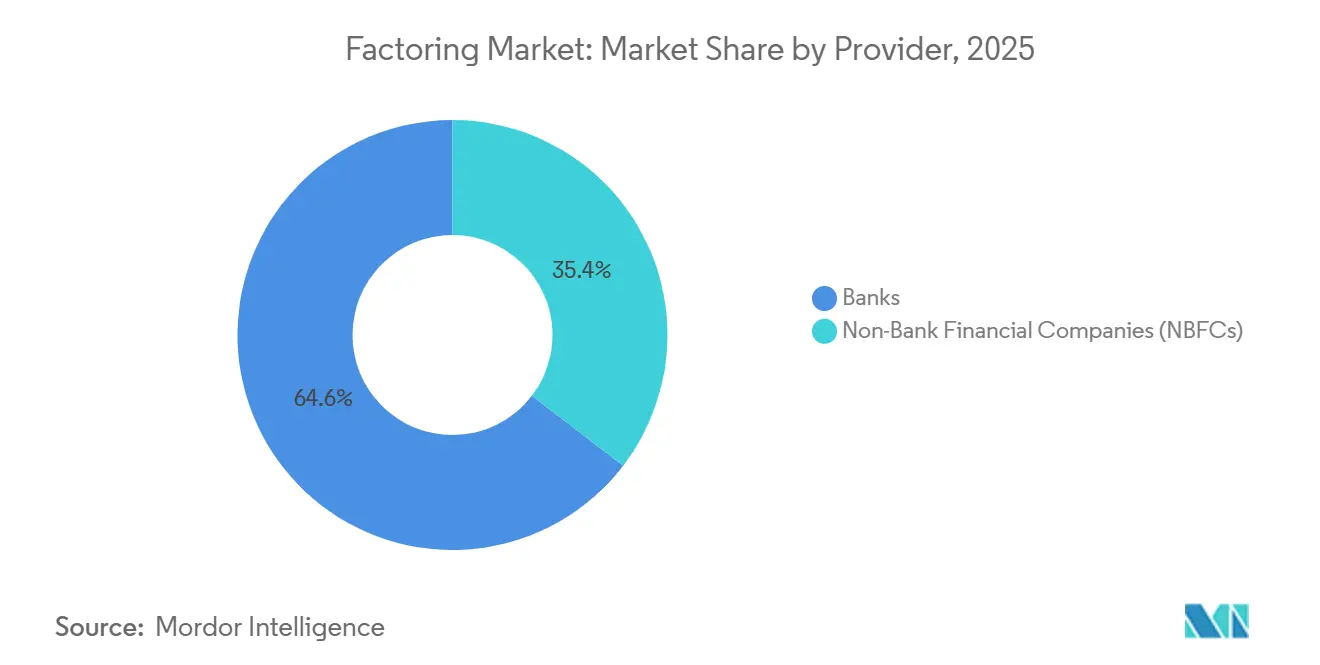
- By provider, banks led with 64.59% of the factoring market share in 2025, while non-bank financial companies are projected to grow at an 8.92% CAGR through 2031.
- By enterprise size, small and medium-sized enterprises held 68.42% of the market share in 2025, and the segment is projected to expand at a 7.76% CAGR through 2031.
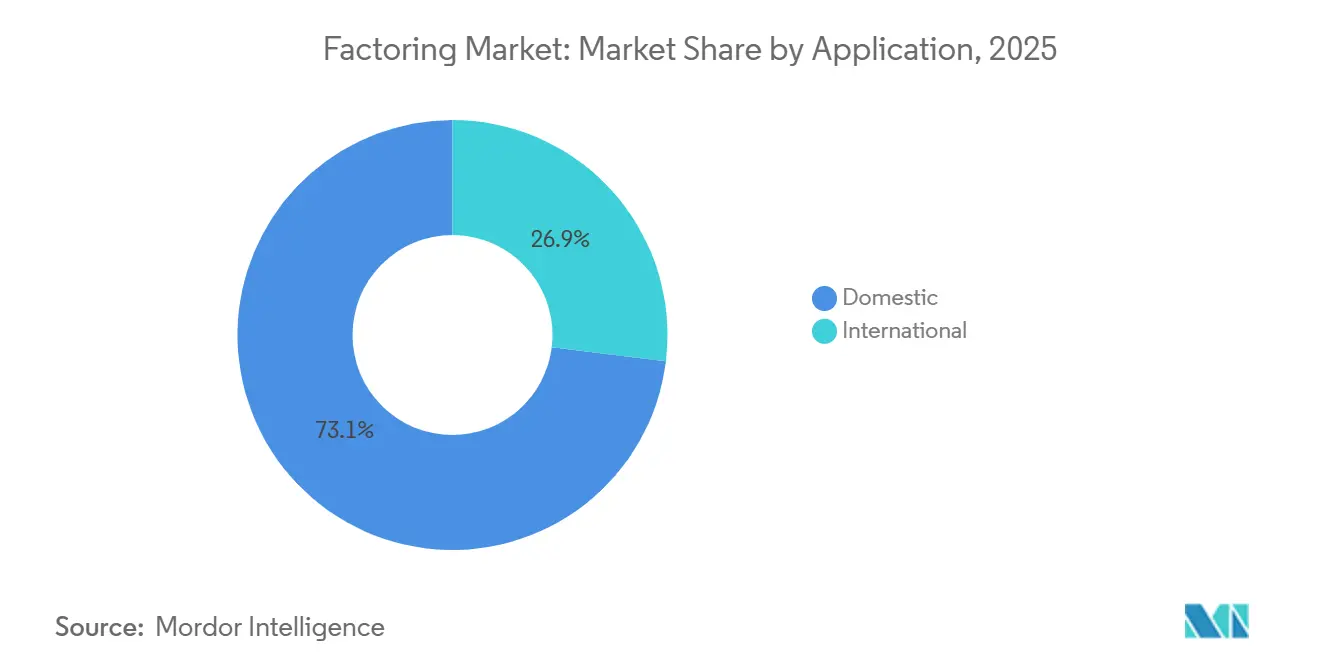
- By application, domestic transactions accounted for 73.06% of the factoring market share in 2025, while international factoring is projected to grow at a 9.33% CAGR through 2031.
- By end-use industry, manufacturing accounted for 29.22% of the market share in 2025, while retail and e-commerce are projected to record the fastest growth at a 9.59% CAGR through 2031.
- By geography, Europe held 58.56% of the factoring market share in 2025, while the Middle East and Africa are projected to record a 10.21% CAGR through 2031.
Note: Market size and forecast figures in this report are generated using Mordor Intelligence’s proprietary estimation framework, updated with the latest available data and insights as of January 2026.
Global Factoring Market Trends and Insights
Drivers Impact Analysis*
| Driver | (~) % Impact on CAGR Forecast | Geographic Relevance | Impact Timeline |
|---|---|---|---|
| Rising adoption of fintech platforms among SMEs | +1.2% | Global, with early gains in the Netherlands, the United Kingdom, and Germany | Medium term (2-4 years) |
| Expansion of cross-border trade & e-commerce | +1.5% | Asia-Pacific core, spill-over to MEA | Long term (≥ 4 years) |
| EU late-payment regulation intensifying working-capital demand | +0.9% | Europe (France, Germany, Benelux, Nordics) | Short term (≤ 2 years) |
| Supply-chain finance programs led by global corporates | +1.1% | North America & EU, emerging in Latin America | Medium term (2-4 years) |
| Embedded-finance & B2B-BNPL APIs enabling “in-cart” factoring | +0.8% | Global, concentrated in North America, Western Europe, and Singapore | Medium term (2-4 years) |
| Real-time payment rails unlocking micro-factoring | +0.6% | North America, the EU, Australia, and India | Long term (≥ 4 years) |
| Source: Mordor Intelligence | |||
Rising Adoption of Fintech Platforms Among SMEs
Small and medium-sized enterprises are adopting digital factoring solutions to stabilize cash flow and reduce time to funding, which is improving the reach of the factoring market among underserved borrowers. Triumph Financial reported that it could purchase 75% of small-carrier invoices without manual review using a machine-learning engine, which shows how automation shortens underwriting cycles and lowers operating costs. Its LoadPay virtual wallet provides instant 24/7 funding through bank-licensed subledger accounts, which tightens the loop between invoice purchase and supplier liquidity. Banks are also streamlining access through digital portals and integrated workflows, as seen in HSBC Indonesia’s TradePay solution that merged digital payments and working capital in one platform. [2]PT Bank HSBC Indonesia, “Annual Report 2024,” PT Bank HSBC Indonesia, about.hsbc.co.id Deep integration into cloud enterprise software is improving straight-through processing as eligible receivables can flow into embedded receivables programs with accurate journal posting and bank funding, which reduces operational friction for SMEs. These technical and distribution shifts are pulling more SMEs into the factoring market by reducing onboarding burden and connecting credit to everyday business systems.
Expansion of Cross-Border Trade & E-Commerce
Cross-border e-commerce adoption and open-account trade are lifting demand for international receivables financing, which is widening the application set addressed by the factoring market. International factoring is expected to outpace domestic activity with a 9.33% CAGR through 2031 as platform integrations make cross-border funding more seamless for sellers. In 2025, HSBC expanded solutions to support e-commerce sellers with near-real-time data, enabling same-day or next-day currency settlement that cut foreign-exchange costs, which encourages more merchants to export on open-account terms. J.P. Morgan embedded supply-chain finance tools into Oracle Fusion Cloud ERP for FedEx vendors, which allows early payments priced to the buyer’s credit and makes adoption easier for suppliers that sell into global markets. [3]J.P. Morgan, “J.P. Morgan Payments Launches Cutting-Edge Supply Chain Finance Solution with Oracle,” JPMorgan Chase & Co., jpmorgan.com These programs strengthen seller confidence because pricing reflects large buyers’ credit quality rather than smaller suppliers’ balance sheets, which supports international scaling. Leading platforms that accelerate large volumes of invoices and pay suppliers early also underpin cross-border workflows by standardizing documentation and funding routines.
EU Late-Payment Regulation Intensifying Working-Capital Demand
In April 2024, the European Parliament adopted its first-reading position on a proposed regulation to address late payments. Key amendments included a 60-day cap on B2B payment terms, deviating from the European Commission's 30-day proposal, and provisions nullifying clauses that restrict receivables assignment, removing barriers for suppliers to factor invoices. Late-payment interest under the regulation is set at the European Central Bank's main refinancing rate plus 8 percentage points, and the flat recovery fee ranges from USD 58.3 (EUR 50.0) to USD 175.0 (EUR 150.0), depending on invoice size, which increases the cost of paying late. This framework is strengthening the case for early-payment solutions and supports the factoring market by clarifying suppliers’ ability to assign receivables. Providers are updating products and documentation to align with the new rules, which eases adoption for smaller vendors that previously faced contractual barriers. The regulation also catalyzes more systematic cash management among buyers and suppliers, which lifts visibility and predictability in payment cycles. These changes are expected to drive near-term demand for receivables finance across Europe as suppliers seek faster, enforceable remedies within the factoring market.
Supply-Chain Finance Programs Led by Global Corporations
Large buyers are expanding programs that connect supplier invoices to funding priced on the buyer’s credit quality, which draws more vendors into bank-led receivables solutions and supports the factoring market. J.P. Morgan’s 2025 launch with Oracle integrated supply-chain finance choices directly into Oracle Cloud ERP for FedEx vendors, enabling early payment with rates linked to FedEx’s rating and reducing deployment time to a simple activation inside Oracle B2B. In Indonesia, HSBC combined digital payments and working-capital features and signed a sustainability supply-chain finance agreement with Saint-Gobain Indonesia, which shows how corporate programs can reward improved supplier practices while delivering liquidity. Societe Generale highlights core verticals like automotive, aerospace, telecommunications, energy, and food retail as focal points for deep-tier finance solutions in Europe, which encourages broader supplier participation beyond tier one. [4]Societe Generale Wholesale Banking, “From Crisis to Opportunity: Unlocking the Power of Supply Chain Finance in a Volatile World,” Societe Generale, wholesale.banking.societegenerale.com These programs standardize onboarding, reinforce data quality, and improve pricing, which accelerates adoption for suppliers and strengthens the factoring market’s role in enterprise cash management.
Restraints Impact Analysis*
| Restraint | (~) % Impact on CAGR Forecast | Geographic Relevance | Impact Timeline |
|---|---|---|---|
| High cost of factoring relative to bank credit | -1.4% | Global, particularly acute in Germany and Canada | Short term (≤ 2 years) |
| Rising cyber-risk & data-privacy breaches | -0.7% | Global, concentrated in Europe, North America | Medium term (2-4 years) |
| Patchy licensing & prudential rules in emerging markets | -0.9% | Sub-Saharan Africa, Southeast Asia, Latin America | Long term (≥ 4 years) |
| Algorithmic-risk models excluding thin-file SMEs | -0.6% | UK, North America, fragmented EU markets | Medium term (2-4 years) |
| Source: Mordor Intelligence | |||
Rising Cyber-Risk & Data-Privacy Breaches
Higher fraud sophistication and data exposure elevate risk in receivables verification and collateral monitoring, which adds cost to operations across the factoring market. BNP Paribas disclosed that a specific receivables-financing fraud case contributed to an almost EUR 1.5 billion rise in doubtful loans during the third quarter of 2025, which highlighted the need for deeper controls and real-time checks. Transportation factors in North America reported rising attempts at identity compromise and false documentation during 2024 and 2025, which shows how fraud rings target fast-growing niches. The European Union’s Digital Operational Resilience Act took effect in January 2025 and requires enhanced information and communications technology risk management for financial entities, which widens compliance scope for providers handling invoice and payment data. Providers have responded with tighter onboarding checks, multi-source invoice verification, and secure payment instruction controls, which improve resilience but increase unit costs. As cyber controls intensify, margins can be squeezed even as transaction volumes grow in the factoring market.
Patchy Licensing & Prudential Rules in Emerging Markets
Gaps in receivables transferability, priority rules, and formalities limit legal certainty in several jurisdictions, which reduces the willingness of financiers to extend credit at scale and slows the spread of the factoring market. The UNIDROIT Draft Guide to Enactment notes uneven frameworks for defining receivables, setting transfer requirements, and ranking priorities between competing transfers, which complicates cross-border enforcement and asset sales. Regulatory capital adds to the burden where banks must recognize dilution risk and hold capital against it under internal ratings approaches, which raises costs for smaller deposit-takers. These constraints fragment product design and documentation, which lengthens time to market for new entrants. As policymakers update secured transactions and digital registries, harmonization can lower transaction frictions, yet the current variability keeps adoption uneven across regions. Until rules converge, prudential requirements and legal uncertainty will remain notable drags on the factoring market.
*Our forecasts treat driver/restraint impacts as directional, not additive. The impact forecasts reflect baseline growth, mix effects, and variable interactions.
Segment Analysis
By Provider: Non-Bank Lenders Capture Share Through Embedded APIs
Banks retained 64.59% of provider-type share in 2025 and continue to leverage balance-sheet depth and cross-product relationships, while non-bank financial companies are projected to expand faster at 8.92% CAGR through 2031 as embedded finance spreads across the factoring market. Providers are reinforcing scale by wiring solutions into enterprise software so suppliers can trigger early payments from familiar systems, which reduces implementation time and boosts adoption. J.P. Morgan’s 2025 launch with Oracle allows vendors to select early payment at rates linked to the buyer’s credit with activation inside Oracle Cloud ERP, which shortens deployment cycles and supports supplier uptake. Meanwhile, Triumph is using machine learning to purchase most small-carrier invoices without manual review and fund them instantly via digital wallets, which shows how non-banks can build on real-time payment rails. These shifts, along with bank portals and APIs, are improving speed and experience across the factoring market.
Banks are modernizing to protect core relationships, while non-banks focus on speed and integration that meet specific sector needs in the factoring industry. HSBC Indonesia introduced a digital invoice and payment solution that puts working capital and payouts in one place, which reflects how bank platforms are adapting to client expectations. SAP Taulia’s receivables solution integrates natively with SAP Cloud ERP and automates journal posting, which gives finance teams tighter control and audit-ready records while maintaining access to bank funding networks. These integrated experiences compress onboarding time and training needs, which helps both bank and non-bank providers scale with fewer manual touchpoints. As non-banks grow, partnerships with licensed banks and large platforms continue to provide balance-sheet capacity and distribution. The result is a competitive mix that supports wider access to receivables funding across the factoring market.


By Enterprise Size: SMEs Command Share Yet Face Elevated Default Risk
Small and medium-sized enterprises held 68.42% share in 2025 and are projected to grow at a 7.76% CAGR through 2031 as digital origination, embedded portals, and faster settlement make receivables finance more accessible across the factoring market. SMEs tend to experience more variable cash conversion cycles, so the ability to monetize invoices quickly is a strong fit for working-capital needs. Corporate-led programs that price early payment to a large buyer’s credit rating are especially helpful for small vendors that sell to global brands. J.P. Morgan’s integration with Oracle Cloud ERP is one example of how supplier enrollment and usage can be simplified to reduce the burden on smaller finance teams. Digital bank offerings like HSBC Indonesia’s TradePay also show how banks are packaging flow-of-funds tools for smaller firms in growing markets.
Access remains uneven in places where credit models depend on backward-looking bureau data rather than live cash-flow telemetry, which narrows eligibility for young, thin-file firms in the factoring market. The CFPB’s proposed rule excluding factoring from small-business lending data collection and reporting reduces visibility into approval outcomes, which makes it harder to assess model fairness. At the same time, embedded solutions and real-time payment rails are enabling micro-factoring for very small invoices, which supports micro and small businesses with faster access to funds when traditional lines are not available. As banks and non-banks expand data sources to include buyer performance and invoice-level behaviour, more SMEs can qualify with limits that match their cash cycles. These advances balance inclusion with risk control and expand the supplier base served by the factoring market.
By Application: International Factoring Surges on E-Commerce Integration
Domestic transactions accounted for 73.06% share in 2025, yet international factoring is projected to grow at 9.33% CAGR through 2031 as cross-border platforms integrate credit at the point of sale and in ERP workflows across the factoring market. The new late-payment regulation in Europe eliminates contractual restrictions, enabling suppliers to transfer receivables. This change facilitates invoice factoring or selling, enhancing immediate cash flow and supporting domestic and international financing arrangements. The factoring market size for cross-border transactions is projected to expand as embedded links tighten buyer-supplier funding loops. Programs with same-day or next-day currency settlement and real-time data further reduce friction for exporters and online sellers. These features are helping international flows close the gap with domestic activity in the market.
Banks and platforms are building offerings that put receivables finance where sellers already run their businesses, which lowers the hurdle for cross-border adoption. J.P. Morgan’s integration with Oracle Cloud ERP lets vendors choose early payment within the workflow they already use for orders and invoices, which reduces change management. HSBC Indonesia’s solutions show how digital working-capital tools can spread in fast-growing markets with export exposure, which encourages more suppliers to rely on predictable cash timing. As same-day settlement in key currency pairs becomes more common, exporters can minimize foreign-exchange frictions and convert sales into cash with less delay. These improvements make cross-border receivables financing more repeatable and scalable in the factoring market.
By End-User Industry: Retail Outpaces Manufacturing on Payment-Term Extensions
Manufacturing held a 29.22% share in 2025, which reflects the use of invoice discounting to bridge extended terms and production cycles that tie up working capital across the factoring market. Retail and e-commerce are projected to be the fastest-growing verticals at a 9.59% CAGR through 2031 as merchant platforms integrate receivables finance for seller liquidity. Suppliers in the manufacturing sector utilized factoring to align cash flow with shipment schedules and term extensions, securing a significant share of the factoring market. Transport and logistics, information technology, and healthcare each present distinct risk profiles and documentation flows, which shape how providers design underwriting and servicing models. These dynamics set a baseline for steady usage across sectors in the market.
Technology and data are improving sector-specific workflows that support adoption. SAP Taulia has documented large-scale dynamic discounting outcomes for corporates, which show how integrated payables and receivables tools can deliver savings and liquidity in tandem. HSBC Indonesia’s sustainability-linked program with Saint-Gobain Indonesia adds performance-based incentives that align financing with supplier improvements, which helps strengthen supply chains while delivering funds. Triumph’s machine-learning models and instant funding make transportation invoices easier to monetize at small ticket sizes, which removes bottlenecks for carriers and brokers. European banks highlight growth in deep-tier finance and defence-adjacent manufacturing, which suggests more suppliers across tiers will access early payments. These advances support continued adoption across diverse verticals in the factoring market.
Geography Analysis
Europe retained 58.56% of global share in 2025, which reflects a deep base of bank platforms, active corporate programs, and supportive regulation that protects suppliers’ right to assign receivables across the factoring market. The European Union’s late-payment rules cap terms at 60 days and prohibit anti-assignment clauses, which directly reduces barriers to factoring and encourages early-payment arrangements at scale. Banks and corporates are aligning technology and data to speed enrollment and funding, which enables suppliers to adopt solutions inside the systems they already use. European institutions also continue to expand sustainability-linked programs and deep-tier finance, which extends liquidity further down multi-tier supply chains. These conditions underpin Europe’s outsized role in the factoring market while creating room for further gains as digital workflows mature.
North America features scaled platforms and fast-moving fintechs that emphasize automation and real-time funding, which strengthens the region’s profile in the global factoring market. Triumph’s commitment to machine learning in invoice purchasing and its LoadPay wallet illustrate how technology and proprietary rails can compress decision cycles and support 24/7 liquidity for carriers and other small suppliers. eCapital upsized its asset-based lending facility to USD 1.38 billion in June 2025 and expanded total banking capacity toward USD 2.6 billion, which signals continued investment in working-capital programs across healthcare and commercial operations. First Citizens BancShares announced plans in October 2025 to acquire 138 BMO branches, with closing expected in mid-2026, which is aimed at expanding deposits and credit capacity that can backstop receivables finance. Monetary policy easing has progressed since 2024 in Canada, which influences funding benchmarks even as risk pricing remains firm for higher-volatility segments. These structural and cyclical forces together shape the North American trajectory within the factoring market.
Asia-Pacific benefits from export-driven supply chains, enterprise digitization, and fast-growing embedded solutions, which broaden the base for receivables finance in the factoring market. HSBC Indonesia launched TradePay and signed a sustainability supply-chain finance agreement with Saint-Gobain Indonesia, which underscores local momentum in digital working capital and supplier incentives. Mizuho expanded universal banking capabilities in the European Union and enhanced private assets partnerships, which support cross-border trade offers for Asia-headquartered clients with global operations. Embedded receivables tools inside ERP systems and marketplaces reduce the need for standalone onboarding and allow quicker funding against approved invoices. The Middle East and Africa corridor is projected to be the fastest-growing geography at a 10.21% CAGR through 2031, which reflects rising digitization and expanding fintech infrastructure that supports working-capital distribution. Across South America, providers are aligning digital invoicing and secure data exchange with bank capacity, which supports steady adoption as policy frameworks evolve and corporate programs expand supplier reach.

Competitive Landscape
Competitive intensity in the factoring market is moderate, with leading global banks and several scaled non-banks shaping standards for onboarding, documentation, and funding that support an oligopoly structure. The market concentration reflects the balance between bank-led platforms and fast-growing embedded models, with room for consolidation as digital distribution expands. J.P. Morgan has deepened integration with enterprise systems by launching a supply-chain finance solution with Oracle Cloud ERP for FedEx vendors, which shortens deployment and adds buyer-linked pricing that small suppliers can access. Banks are also advancing sustainability-linked programs and deep-tier financing in Europe as corporates target supplier decarbonization alongside liquidity. Providers that integrate receivables finance with digital payments, FX, and treasury workflows are securing a larger share of wallet among multinational clients, which reinforces bank relevance in the factoring market.
Non-bank specialists are scaling through technology, partnerships, and targeted acquisitions, which increases competitive pressure and extends coverage in niche segments of the factoring market. Triumph Financial announced the acquisition of Greenscreens.ai for USD 160 million to enhance freight-pricing intelligence and also formed a strategic partnership with C.H. Robinson to power Robinson Financial’s Factoring as a Service and LoadPay, which channels volume through Triumph’s balance sheet and technology stack. eCapital upsized its asset-based lending facility to USD 1.38 billion and increased total banking capacity, which supports continued expansion of healthcare and commercial working-capital programs. First Citizens BancShares plans to acquire 138 BMO branches in the United States, with closing targeted for mid-2026, which is designed to expand its funding base and distribution. These moves show how non-banks and regional banks are consolidating capabilities to serve more clients within the market.
Risk management and data are central to competitive differentiation as providers respond to fraud incidents and new operational resilience standards, which shape service design in the factoring market. BNP Paribas disclosed a receivables-financing fraud case that increased doubtful loans in the third quarter of 2025, which has pushed providers to intensify continuous collateral monitoring, identity verification, and payment instruction checks. SAP Taulia’s integrated receivables product supports accurate ledgering and bank-network access, which strengthens accounting control and cash predictability for clients. Societe Generale highlights that deep-tier finance, distributed ledger innovations, and standardized documentation can extend reach while lowering risk and cost in supply chains. Mizuho’s buildout of European capabilities also signals continued investment by universal banks to support cross-border clients across trade and working capital. As platforms converge transaction banking, FX, and credit analytics, the factoring market continues to shift toward integrated, data-rich services.
Factoring Industry Leaders
Barclays PLC
BNP Paribas Factoring
Deutsche Factoring Bank
Mizuho Financial Group
Eurobank Ergasias SA
- *Disclaimer: Major Players sorted in no particular order

Recent Industry Developments
- October 2025: First Citizens BancShares announced an agreement to acquire 138 branches from BMO Bank N.A., assuming approximately USD 5.7 billion in deposit liabilities and acquiring approximately USD 1.1 billion in loans located throughout the Midwest, Great Plains, and West regions of the United States, with closing expected mid-2026. The transaction is intended to expand the company's footprint and enhance its liquidity position to support strategic initiatives.
- July 2025: J.P. Morgan Payments launched a supply-chain finance solution integrated with Oracle Fusion Cloud Enterprise Resource Planning, developed in collaboration with Oracle and implemented by FedEx, allowing vendors to choose between extended terms or early payment at financing rates based on FedEx's credit rating. Activation occurs directly within Oracle Cloud ERP via Oracle B2B.
- February 2025: Triumph Financial, Inc. announced the acquisition of Greenscreens.ai for USD 160 million, consisting of USD 140 million in cash and USD 20 million in TFIN stock, with closing expected in the second quarter of 2025. The transaction expands Triumph's Intelligence segment into freight-pricing intelligence, building upon the recent acquisition of Isometric Technologies and leveraging machine learning to deliver short-term freight market insights that help customers make data-informed pricing and purchasing decisions.
- February 2025: BAWAG Group finalized the acquisition of Barclays Consumer Bank Europe, enhanced customer loan growth, and planned to expand working-capital facilities. Regulatory approvals were secured on January 9th, 2025. The business will operate under the Barclays brand during a transitional phase, with rebranding expected in 2026. Existing customer products and terms remain unchanged post-transaction.


Research Methodology Framework and Report Scope
Market Definitions and Key Coverage
Our study defines the global factoring market as the total annual value of invoices legally sold or assigned to bank or non-bank factors, whether through recourse or non-recourse arrangements, for immediate liquidity against a service fee. Factoring linked to receivables securitization platforms or embedded-finance APIs is included because the underlying legal transfer of receivables remains identical to classic factoring.
Scope exclusion: solutions such as forfaiting, dynamic discounting, and pure supply-chain finance programs that do not involve the outright sale of receivables are not counted.
Segmentation Overview
- By Provider
- Banks
- Non-Bank Financial Companies (NBFCs)
- By Enterprise Size
- Large Enterprises
- Small & Medium-sized Enterprises (SMEs)
- By Application
- Domestic
- International
- By End-Use Industry
- IT & Telecommunication
- Manufacturing
- Retail And E-Commerce
- Healthcare And Pharmaceuticals
- Travel & Hospitality
- Transportation & Logistics
- Other Industry Verticals
- By Region
- North America
- United States
- Canada
- Mexico
- South America
- Brazil
- Argentina
- Chile
- Colombia
- Rest of South America
- Europe
- United Kingdom
- Germany
- France
- Spain
- Italy
- Benelux (Belgium, Netherlands, and Luxembourg)
- Nordics (Sweden, Norway, Denmark, Finland, and Iceland)
- Rest of Europe
- Asia-Pacific
- China
- India
- Japan
- South Korea
- Australia
- South-East Asia (Singapore, Indonesia, Malaysia, Thailand, Vietnam, and Philippines)
- Rest of Asia-Pacific
- Middle East and Africa
- United Arab Emirates
- Saudi Arabia
- South Africa
- Nigeria
- Rest of Middle East and Africa
- North America
Detailed Research Methodology and Data Validation
Primary Research
Senior analysts interviewed factor-house executives, SME finance heads, trade-credit insurers, and fintech platform architects across Europe, Asia, North America, and the Gulf. These conversations validated discount-fee corridors, cross-border demand spikes, and the realistic pace at which e-invoicing mandates translate into factoring volumes.
Desk Research
We began by harvesting publicly available data on factoring turnover and discount rates from credible bodies such as Factors Chain International, the World Bank's Enterprise Surveys, European Central Bank payment statistics, and national banking regulators. These sources offered country-level invoice volumes, SME credit-gap indicators, and late-payment indices that frame demand. Our team then mined corporate filings, IFRS 9 disclosures, and investor decks from leading banks to benchmark average advance rates and fee spreads. Subscription databases, D&B Hoovers for company financials and Dow Jones Factiva for news flow, helped us trace market shares and new product launches. The sources listed above are illustrative; many others informed intermediate checks and clarifications.
A second sweep tapped academic journals on working-capital finance, customs shipment records for trade-driven receivables, and patent archives (via Questel) on AI-based risk engines that influence service adoption costs.
Market-Sizing & Forecasting
A top-down reconstruction converts national factoring turnover and accounts-receivable days into annual funded value, which is then cross-checked through selective bottom-up roll-ups of leading factor portfolios and sampled average service fees. Key variables like SME credit-gap ratio, cross-border trade value, average days-sales-outstanding, fintech penetration index, and regional late-payment regulation scores feed a multivariate regression that projects demand to 2030. Where bottom-up coverage is thin, we apply variance caps derived from historical penetration ceilings to avoid over-extension.
Data Validation & Update Cycle
Outputs pass a three-layer review: automated anomaly flags, peer analyst audit, and senior sign-off. Reports refresh yearly, and we reopen models whenever regulatory shocks or greater than 10% swings in quarterly turnover emerge.
Why Our Global Factoring Baseline Commands Reliability
Published estimates often differ; the gaps usually stem from how firms slice receivable types, pick growth drivers, or refresh currency and inflation inputs.
Key gap drivers here include whether forfaiting and supply-chain finance pools are folded in, how aggressively service-fee inflation is layered, and the cadence at which new fintech entrants are captured. Mordor's disciplined scope and annual re-benchmarking curb such drift.
Benchmark comparison
| Market Size | Anonymized source | Primary gap driver |
|---|---|---|
| USD 4.41 Tn | Mordor Intelligence | |
| USD 5.69 Tn | Global Consultancy A | Includes forfaiting and assumes uniform 9% fee inflation |
| USD 4.31 Tn | Regional Consultancy B | Omits non-bank factors and freezes FX at 2024 rates |
| USD 4.49 Tn | Trade Journal C | Uses conservative SME adoption rates but no cross-border premium |
The comparison shows that once disparate scopes and price assumptions are stripped away, Mordor's baseline emerges as a balanced, transparent midpoint that decision-makers can trace back to observable variables and repeatable steps.


Key Questions Answered in the Report
What is the current size and growth outlook of the factoring market?
The factoring market size is USD 4.68 trillion in 2026 and is projected to reach USD 6.30 trillion by 2031 at a 6.12% CAGR, supported by digital adoption and regulatory clarity for receivables assignment.
Which regions lead and grow fastest in the factoring market?
Europe leads by share with 58.56% in 2025, while the Middle East and Africa are projected to be the fastest-growing region with a 10.21% CAGR through 2031.
Which segments are gaining the most momentum within applications and industries?
Domestic transactions hold 73.06% share in 2025, while international factoring is projected to grow at a 9.33% CAGR through 2031; manufacturing holds 29.22% share in 2025, and retail and e-commerce are projected to lead growth at a 9.59% CAGR through 2031.
How are banks and non-banks competing in the factoring market?
Banks still anchor share at 64.59% with integrated portals and balance sheets, while non-bank financial companies are projected to grow faster at an 8.92% CAGR through 2031 by embedding underwriting into ERP and marketplace workflows.
What regulations are shaping demand for receivables finance in Europe?
The European Union capped payment terms at 60 days and prohibited anti-assignment clauses, which strengthens suppliers’ ability to factor invoices and supports broader adoption.
What innovations are expanding access for small suppliers?
Embedded finance in ERP systems, Factoring as a Service partnerships, real-time payment rails, and continuous risk controls are reducing time to funding and enabling viable micro-factoring for small invoices.
Page last updated on:


