
Tissue Engineered Skin Substitute Market Size and Share
Market Overview
| Study Period | 2020 - 2031 |
|---|---|
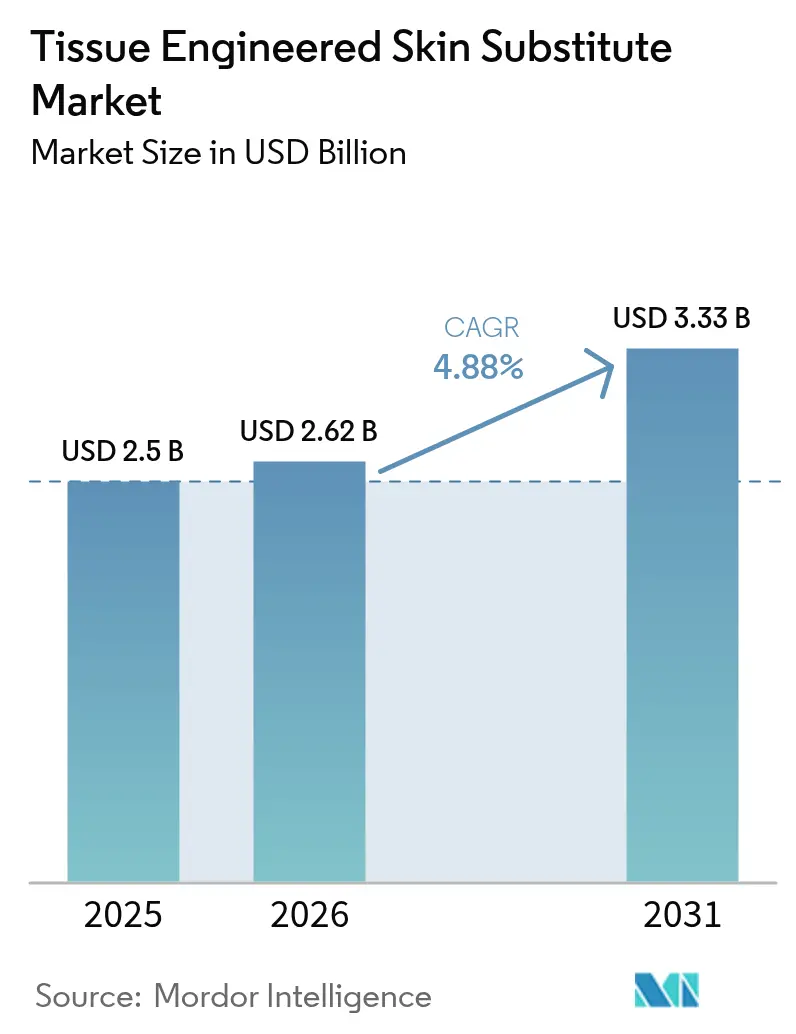
| Market Size (2026) | USD 2.62 Billion |
| Market Size (2031) | USD 3.33 Billion |
| Growth Rate (2026 - 2031) | 4.88 % |
| Fastest Growing Market | Asia Pacific |
| Largest Market | North America |
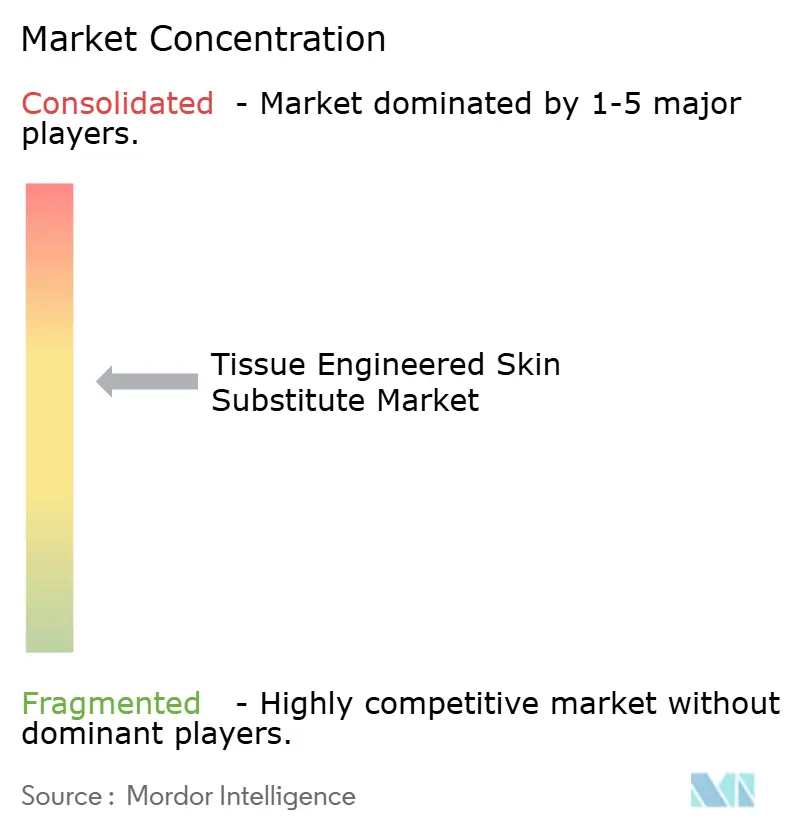
| Market Concentration | Medium |
Major Players *Disclaimer: Major Players sorted in no particular order Image © Mordor Intelligence. Reuse requires attribution under CC BY 4.0. | |
Tissue Engineered Skin Substitute Market Analysis by Mordor Intelligence
tissue-engineered skin substitutes market size in 2026 is estimated at USD 2.62 billion, growing from 2025 value of USD 2.5 billion with 2031 projections showing USD 3.33 billion, growing at 4.88% CAGR over 2026-2031. Adoption has moved beyond pilot studies into routine care as reimbursement becomes predictable and clinical guidelines mature. Integrating 3D bioprinting with traditional tissue-engineering expands therapeutic scope yet forces manufacturers to modernize quality-control systems. Biosynthetic scaffolds gain momentum because they unite biologic compatibility with the consistency of synthetic chemistry, addressing batch-to-batch variability. Investors fund automated, closed-loop manufacturing lines that promise lower contamination risk and faster release times, anchoring long-run cost advantages. Across regions, North America keeps volume leadership through robust insurance coverage, while Asia Pacific records the steepest unit gains on the back of government hospital upgrades and demographic shifts that elevate chronic-wound incidence.
Key Report Takeaways
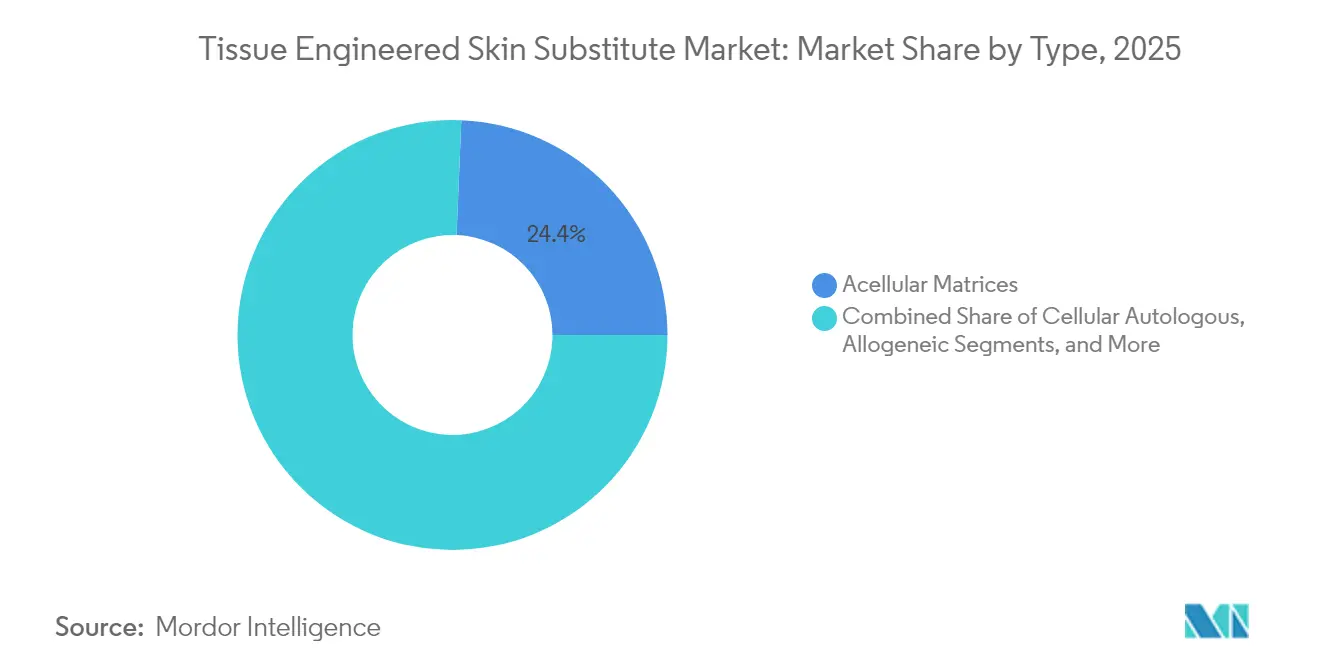
- By construct type, acellular matrices led with a 24.35% market share of tissue-engineered skin substitutes in 2025; cellular autologous constructs are forecast to post the fastest 13.10% CAGR through 2031.
- By product material, natural and biological substances captured 32.85% revenue in 2025, whereas biosynthetic variants are expanding at an 11.05% CAGR.
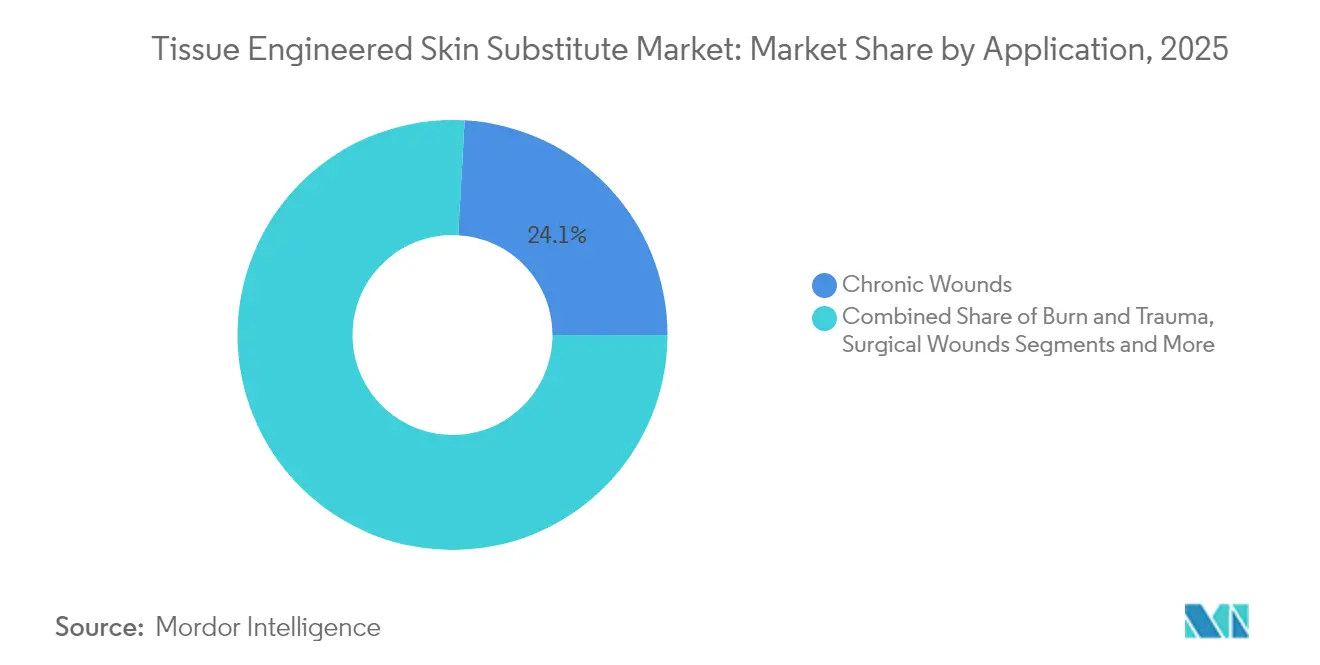
- By application, chronic wounds comprised 24.10% of the tissue-engineered skin substitutes market size in 2025, and diabetic foot ulcers are on track for a 10.98% CAGR.
- By end-user, hospitals commanded 23.10% revenues in 2025, yet home healthcare is climbing at a 8.85% CAGR as point-of-care tools mature.
- By geography, North America secured a 29.60% market share in 2025 for tissue-engineered skin substitutes, while Asia Pacific is projected to deliver a 9.02% CAGR to 2031.
Note: Market size and forecast figures in this report are generated using Mordor Intelligence’s proprietary estimation framework, updated with the latest available data and insights as of 2026.
Market Trends and Insights
Drivers Impact Analysis of Tissue Engineered Skin Substitute Market*
| Driver | (~) % Impact on CAGR Forecast | Geographic Relevance | Impact Timeline |
|---|---|---|---|
| Chronic wounds increasing | +1.20% | North America, Europe, emerging in APAC | Long term (≥ 4 years) |
| Higher burn & trauma incidence | +0.80% | Stronger impact in developing economies | Medium term (2-4 years) |
| Adoption of 3D‐bioprinting | +0.70% | Starts in North America & EU, spreading to APAC | Medium term (2-4 years) |
| Aging population with fragile skin | +0.90% | Developed economies | Long term (≥ 4 years) |
| Growth in regenerative-medicine funding | +0.50% | Primarily North America & EU | Short term (≤ 2 years) |
| Veterinary crossover demand | +0.30% | Early uptake in North America | Medium term (2-4 years) |
| Source: Mordor Intelligence | |||
Increasing Prevalence Of Chronic Wounds
Roughly 6.7 million people in the United States live with chronic wounds, generating treatment outlays exceeding USD 50 billion each year. As 21% of Americans are expected to be 65 or older by 2040, comorbidities such as diabetes and vascular disease further complicate care. Hospitals, therefore, invest in advanced substitutes that shorten healing time and prevent costly infections. Real-world databases documenting reduced readmissions strengthen payer confidence, encouraging broader formulary inclusion.
Rising Burn & Trauma Incidence
Thermal, chemical, and electrical burns create an immediate need for biologic coverage. FDA clearance of AVITA Medical’s RECELL GO system in 2024 provided an autologous spray-on therapy that lessens donor-site morbidity and matches pigmentation. Defense and industrial-safety budgets fund similar platforms, driving procurement beyond specialized burn units into regional trauma centers.
Rapid Adoption Of 3D-Bioprinting Workflows
Bioprinting converts manual graft assembly into automated, layer-by-layer deposition of living cells, hydrogels, and growth factors. Embedded printing now forms perfusable channels inside thick constructs, resolving diffusion limits that once capped graft thickness.[1]ScienceDirect Editors, “Embedded 3D Bioprinting Techniques,” sciencedirect.comAutomation also improves batch-to-batch reproducibility, a quality attribute embraced by regulators validating manufacturing consistency.
Aging Population with Fragile Skin & Comorbidities
Senescent cells accumulate in aged skin, secreting inflammatory molecules that stall epithelial migration and angiogenesis.[2]Frontiers Editors, “Senescent Cells in Aged Skin,” frontiersin.org As older patients require longer healing times, clinicians turn to substitutes enriched with vascularization cues. Public insurers incentivize use because faster closure curbs hospital stay length and reduces antibiotic use.
Restraints Impact Analysis of Tissue Engineered Skin Substitute Market*
| Restraint | (~) % Impact on CAGR Forecast | Geographic Relevance | Impact Timeline |
|---|---|---|---|
| Limited reimbursement in emerging markets | -0.60% | APAC, Latin America, Middle East & Africa | Long term (≥ 4 years) |
| Inability to recreate skin appendages | -0.50% | Developed markets | Long term (≥ 4 years) |
| Donor‐tissue supply bottlenecks | -0.40% | North America & Europe | Medium term (2-4 years) |
| Regulatory ambiguity for point-of-care printing | -0.40% | Highest in North America & EU | Medium term (2-4 years) |
| Source: Mordor Intelligence | |||
Limited Reimbursement in Emerging Markets
Many developing economies prioritize primary care over premium wound treatments, delaying uptake despite high clinical need. Absence of formal health-technology assessment limits systematic value analysis, and public hospitals often default to gauze and saline. Manufacturers now design cost-controlled variants specifically for these regions, though lower margins threaten reinvestment in R&D.
Regulatory Uncertainty For Autologous Point-Of-Care Printing
Autologous grafts produced inside hospitals blur boundaries among devices, biologics, and medical practice. When processing exceeds minimal manipulation, the FDA regulates the output as a drug, triggering expensive trials.[3]Journal of Translational Medicine Editors, “Regulatory Issues in Autologous Therapies,” translational-medicine.biomedcentral.com Many institutions lack GMP suites, restricting accessibility and discouraging venture capital for mobile bioprinters.
*Our forecasts treat driver/restraint impacts as directional, not additive. The impact forecasts reflect baseline growth, mix effects, and variable interactions.
Tissue Engineered Skin Substitute Market Segment Analysis
By Type:
Cellular Innovation Challenges Matrix DominanceAcellular matrices commanded 24.35% tissue-engineered skin substitutes market share in 2025 due to easier sterilization and off-the-shelf logistics. Cellular autologous grafts, however, are registering a 13.10% CAGR, driven by personalized medicine trends and reduced immunogenicity. Hospitals with dedicated tissue labs deploy these solutions for ulcers unresponsive to medicines. RECELL GO mini, approved in December 2024, treats wounds up to 480 cm² with limited donor harvest, spotlighting how automation lowers resource needs. As volumes grow, economies of scale are expected to narrow cost gaps, nudging market preference toward bespoke constructs.
Composite dermo-epidermal products remain technically sophisticated but capacity-constrained because multilayer fabrication demands strict environmental control. Cellular allogeneic options occupy a midpoint, balancing shelf-readiness with biologic signaling, yet donors must match pathogen-screening regulations that complicate logistics. Industry investment, therefore, favors bio-printed cellular autologous platforms that pair point-of-care speed with immune compatibility.



By Product Material:
Biosynthetic Innovation Disrupts Natural DominanceNatural biological scaffolds, including bovine and porcine dermis, captured 32.85% revenues in 2025. Their track record and known safety profiles smooth hospital committee approvals. Supply limitations and animal-origin sensitivities, though, stimulate an 11.05% CAGR in biosynthetic substitutes that combine recombinant human collagen with robust polymers. Hospitals appreciate consistent mechanical strength and predictable degradation curves, which ease surgeon training.
Marine collagen innovations extend material diversity. Kerecis leveraged fish-skin matrices rich in omega-3 lipids and gained quick Medicare coding in 2025, illustrating payer openness to sustainable biomaterials. Meanwhile, purely synthetic meshes retain cost advantages for high-volume burns and emergent use in field hospitals. Hybrid biosynthetic platforms now dominate R&D pipelines, aiming to mirror biologic cues while ensuring industrial scalability.
By Application:
Diabetic Complications Drive Chronic-Wound InnovationChronic wounds formed 24.10% of the tissue-engineered skin substitutes market size in 2025, yet diabetic foot ulcers are on an 10.98% CAGR trajectory through 2031. Hyperglycemia impairs leukocyte function and angiogenesis, prompting integration of antimicrobial peptides and vasodilators into graft design. The FDA issued 2024 guidance easing diabetic-foot infection drug trials, indirectly encouraging combination products.
Burns and acute trauma remain revenue heavyweights in tertiary centers because immediate skin coverage mitigates fluid loss and scarring. Surgical wounds constitute a growth pocket as elective orthopedic and cardiovascular procedures rise globally. Cosmetic reconstruction, while niche, commands premium pricing, driving aesthetic-focused formulations that modulate scar architecture and pigment fidelity.
By End-User:
Home Healthcare Disrupts Hospital-Centric ModelsHospitals retained a 23.10% revenue share in 2025 owing to established operating theaters and burn units. Home healthcare, however, is advancing at a 8.85% CAGR. Compact, pre-hydrated dressings allow trained nurses to manage changes in patient residences, supported by tele-monitoring apps that flag infection early. U.S. Medicare Administrative Contractors postponed restrictive Local Coverage Determinations in March 2025, granting interim reimbursement stability to home-bound care pathways.
Ambulatory surgical centers (ASCs) also benefit as payers redirect routine grafting away from high-cost inpatient beds. ASCs deploy standardized protocols, reducing turnaround times and lowering per-procedure expense. Specialized burn centers provide leadership for full-thickness injuries that demand multidisciplinary support. Overall, payer efforts to shift care to lower-cost sites underpin long-run demand for easily applied, portable tissue-engineered skin substitutes.
By Manufacturing Technology:
Bioprinting Challenges Conventional MethodsManual assembly dominates 2024 unit output because infrastructure is widespread and regulatory filings are familiar. Still, 3D-printed grafts log the highest growth as programmable deposition customizes thickness, cell density, and vascular architecture. Global 3D bioprinting revenue is forecast to jump from USD 2.24 billion in 2024 to USD 6.82 billion by 2034, underscoring strategic capital flows.
Electrospun nanofibers offer a high surface area that promotes keratinocyte migration, while decellularized matrices preserve natural chemokines without immunologic baggage. Suppliers with closed-cartridge printers now run validation batches under ISO 13485 rules, reducing contamination risk and meeting traceability mandates. The race centers on marrying automated process control with scalable clean-room footprints that fit hospital budgets.
Geography Analysis
North America Tissue Engineered Skin Substitute Market
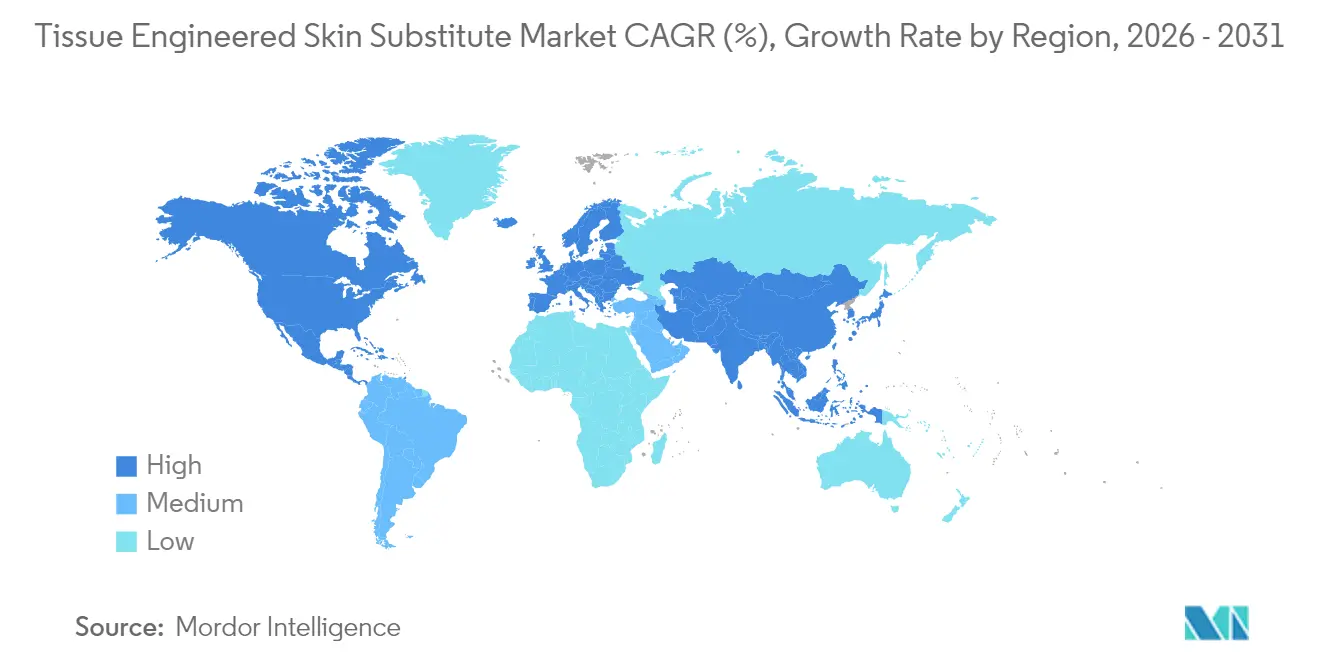
North America secured a 29.60% market share in tissue-engineered skin substitutes in 2025, anchored by Medicare codes Q4100–Q4180 and robust private insurance uptake. Venture capital remains plentiful: the U.S. regenerative medicine segment is projected to reach USD 80.74 billion by 2033. The recent postponement of Local Coverage Determinations in 2025 eased near-term reimbursement pressure, letting suppliers focus on outcome-data generation rather than code lobbying. Academic burn units in Boston, San Antonio, and Los Angeles pilot AI-directed dosing schedules, positioning the region at the forefront of evidence-based wound care.
APAC Tissue Engineered Skin Substitute Market
Asia Pacific delivers the fastest rise with a 9.02% CAGR to 2031. China’s wound-care facilities grew from 16 in 2010 to 357 in 2019, showcasing the state's commitment to specialty care. Urban hospitals in Shanghai and Guangzhou test biosynthetic sheets for diabetic ulcers, while provincial clinics deploy cost-trimmed porcine matrices. Japan’s PMDA has published draft guidance clarifying cell-therapy dossiers, accelerating dual approvals for U.S. developers. South Korea funnels Defense Ministry grants into combat wound bioprinting, further enlarging the regional innovation base.
EMEA and South America Tissue Engineered Skin Substitute Market
Europe registers moderate expansion as tight health-technology assessments enforce price discipline. Germany’s statutory insurers demand conclusive cost-utility data before listing new grafts, prompting pilot registries to collect real-world evidence. France and the Nordics reimburse biosynthetic matrices that cut nursing time, recognizing long-term savings. The Middle East & Africa feature pockets of rapid uptake in medical tourism hubs such as Dubai, where private hospitals target affluent burn patients. South America’s growth is tied to macro-economic stabilization in Brazil and Colombia, where public insurers gradually allocate budgets for chronic-wound management.

Regulatory Landscape
Regulation for tissue-engineered skin substitutes varies by product composition and degree of manipulation. In the United States, minimally manipulated, homologous-use human cells, tissues, and cellular and tissue-based products (HCT/Ps) can fall under Section 361 with 21 CFR Part 1271 requirements, while higher-risk tissue-engineered and biologically active products may require a BLA (biologics) or device pathways such as 510(k) or PMA. Combination products are governed under 21 CFR Part 4, and FDA oversight is organized around the product's Primary Mode of Action (PMOA), which drives the lead-center assignment and aligns drug/biologic cGMP and device quality-system obligations.
In Europe, tissue-engineered products are commonly treated as Advanced Therapy Medicinal Products (ATMPs) under Regulation (EC) No 1394/2007, requiring centralized authorization and higher expectations for clinical and manufacturing evidence for market access. Reimbursement policy also shapes commercialization: in the United States, CMS withdrew planned Local Coverage Determinations for certain skin substitute grafts/cellular and tissue-based products that were initially set to become effective on January 1, 2026, highlighting how coding and coverage stability run alongside FDA pathway strategy.
Value Chain Analysis
The value chain starts with sourcing biological inputs (donor-derived tissues, cellular starting materials) and biomaterials (collagen, polymers, ECM-derived matrices), supported by tissue banks and specialized raw-material suppliers. Upstream variability in donor availability and screening requirements can constrain cellular allogeneic and human-derived matrices, while biosynthetic and synthetic inputs reduce batch variability but require robust supplier qualification and incoming QC. Product sponsors increasingly use CDMOs for GMP/GTP manufacturing, including process validation and regulatory documentation, especially for autologous or complex constructs where technology transfer, aseptic processing, and release testing drive cost and cycle time.
Midstream activities center on controlled manufacturing (often clean-room based), sterility assurance, packaging, and cold-chain or validated ambient logistics depending on construct type (cellular vs acellular). Downstream, hospital systems, specialized burn centers, ASCs, and home healthcare providers procure through group purchasing and distributor networks, with utilization tied to payer rules and HCPCS coding for skin substitutes. Bottlenecks tend to appear at scale-up (capacity, contamination risk, and turnaround time for autologous products) and in cross-border logistics for biologically sensitive products, which is one reason manufacturers pursue localized manufacturing footprints and CDMO partnerships to protect continuity of supply.
Competitive Landscape
Industry concentration is moderate. Top players command robust distribution yet face agile newcomers exploiting niche science. Smith & Nephew posted 3.8% underlying revenue growth in Q1 2025, driven by GRAFIX PLUS momentum. Geistlich Pharma expanded U.S. exposure via a StimLabs distribution pact, pairing Swiss collagen expertise with domestic sales bandwidth.
Product differentiation defines positioning. Kerecis’ fish-skin grafts leverage intrinsic omega-3 lipids for anti-inflammatory benefits, while AVITA Medical’s spray-on epidermal cells deliver pigment match for cosmetic zones. SolasCure’s enzymatic Aurase Gel earned FDA Fast Track in June 2025 because it targets calciphylaxis ulcers, a small yet high-severity cohort. Automation capacity emerges as a bargaining chip in payer negotiations since it underwrites steady supply and uniform quality.
White-space opportunities span infection-control hybrid dressings and cost-efficient emerging-market lines, though regulatory complexity tempers aggressive scale-outs.
Tissue Engineered Skin Substitute Industry Leaders
Amarantus BioScience Holdings
Organogenesis Inc.
3M Company
Smith & Nephew plc
Tissue Regenix
- *Disclaimer: Major Players sorted in no particular order
Tissue Engineered Skin Substitute Market Companies Covered in this Report
- 3M (Acelity)
- Smiths Group
- Organogenesis
- Integra LifeSciences
- Molnlycke Health Care
- Avita Medical
- Tissue Regenix
- Stratatech (Mallinckrodt)
- CryoLife
- Convatec Group
- Medtronic
- Vericel
- AxoGen
- RenovoDerm
- PolarityTE
- BSN Medical
- Baxter
- MiMedx Group
- Aroa Biosurgery
- Regenity Biosciences
Read Analysis of Tissue Engineered Skin Substitute Companies

Market Opportunities and Future Outlook
Reimbursement mapping and regulatory pathway positioning are becoming primary commercial levers, creating whitespace for portfolios that are clearly categorized and supported with evidence for coverage. In the United States, CMS implemented the CY 2026 Physician Fee Schedule final rule effective January 2026, introducing pathway-linked payment mapping using HCPCS Q41xx codes and a flat national reimbursement rate (about USD 127.14 per square centimeter) for non-biologic skin substitutes in non-facility settings. This environment supports manufacturers that can differentiate with outcomes data in high-burden segments such as diabetic foot ulcers, and it creates room for solutions designed for lower-cost sites of care (ASCs and home healthcare), where standardized application and predictable supply improve provider workflows.
Technology and manufacturing readiness is another near-term opportunity area, particularly as automated workflows and regulatory-quality manufacturing become prerequisites for adoption. FDA activity continues to support product refresh in established categories, including Medskin Solutions Dr. Suwelack AG receiving FDA clearance for MatriDerm (K261224) in May 2026 through a Special 510(k) with a rapid review timeline. On the innovation side, 2026 academic publications highlight advances in stem cell-based constructs and additive manufacturing approaches for skin regeneration, reinforcing R&D focus on vascularization, layered architectures, and scalable production methods that can meet combination-product quality expectations while supporting broader clinical use.
Recent Industry Developments in Tissue Engineered Skin Substitute Market
- July 2026: Organogenesis announced FDA acceptance of its Biologics License Application for ReNu, an amniotic suspension allograft being pursued for knee osteoarthritis, with a PDUFA target action date of April 24, 2027. The milestone highlights continued FDA engagement with human tissue-derived biologics and reinforces Organogenesis' regulatory playbook that can also support adjacent wound and skin substitute portfolios.
- May 2026: Smith & Nephew launched the RENASYS EDGE Negative Pressure Wound Therapy system to simplify maintenance and improve patient adherence. The launch reinforces the trend toward integrated wound-care platforms that can be bundled with advanced dressings and skin substitutes to support end-to-end wound management pathways.
- December 2024: AVITA Medical received FDA clearance for RECELL GO mini for use in treating smaller wounds, extending the RECELL platform into workflows that require less donor harvest for defined wound areas. The clearance broadened point-of-care autologous epidermal cell options and added competitive pressure on conventional grafting approaches in burn and trauma settings.


Tissue Engineered Skin Substitute Market Report Scope and Research Methodology
Market Definition and Coverage
For this methodology, the tissue engineered skin substitute market is defined as the revenue generated from clinically used bioengineered skin substitute products that are applied to manage acute and chronic skin loss, and that are supplied through healthcare delivery settings.
Scope exclusions: We exclude simple wound dressings and topical drugs that do not function as a skin substitute, along with non-therapeutic research-only constructs.
Segments Covered in This Report
- By Construct Type
- Cellular Autologous
- Cellular Allogeneic
- Acellular Matrices
- Composite (Dermo-epidermal)
- By Product Material
- Natural/Biological
- Synthetic
- Biosynthetic
- By Biomaterial Source
- Collagen
- Chitosan
- Hyaluronic Acid
- PEG & Other Polymers
- By Manufacturing Technology
- Conventional Manual
- 3-D Bioprinted
- Electrospun Nanofiber
- Decellularized ECM
- By Application
- Chronic Wounds
- Diabetic Foot Ulcers
- Venous Leg Ulcers
- Pressure Ulcers
- Burn & Trauma
- Thermal Burns
- Chemical/Radiation Burns
- Surgical Wounds
- Cosmetic Reconstruction
- Chronic Wounds
- By End-User
- Hospitals
- Specialised Burn Centres
- Ambulatory Surgical Centres
- Home Healthcare
- By Geography
- North America
- United States
- Canada
- Mexico
- Europe
- Germany
- United Kingdom
- France
- Italy
- Spain
- Rest of Europe
- Asia Pacific
- China
- Japan
- India
- South Korea
- Australia
- Rest of Asia Pacific
- Middle East & Africa
- GCC
- South Africa
- Rest of Middle East & Africa
- South America
- Brazil
- Argentina
- Rest of South America
- North America
Data Sources, Market Sizing, and Validation
Desk Research
Desk research was used to build the base structure of the market and to anchor epidemiology, procedure volumes, and care-setting trends that shape demand for skin substitutes. We relied on public sources such as the US Centers for Disease Control and Prevention, Centers for Medicare and Medicaid Services fee schedules and utilization releases, the World Health Organization, and national statistics offices for population and diabetes indicators.
To translate need into likely product demand, we also reviewed wound care and burn care publications in peer-reviewed journals, along with clinical guideline bodies and association websites (such as those focused on burns and chronic wounds) to understand typical treatment pathways and adoption constraints. Company filings, investor presentations, and reputable press were used to cross-check product availability signals, geographic focus, and pricing commentary, and a patent database was reviewed selectively to sense technology direction. The desk sources listed above are illustrative only, and many other public references were also used for data collection, validation, and clarification.
Primary Interviews and Surveys
Primary work was done through expert interviews and structured surveys with manufacturers, distributors, hospital procurement and wound care stakeholders, and clinicians involved in burns and chronic wound management. Because this is a global market, we ensured coverage across APAC, EMEA, and the Americas so regional reimbursement practices, site-of-care differences, and day-to-day usage patterns could be reflected in the final assumptions.
Distribution of primary research fieldwork respondents
| Company type | Respondent position | Region |
|---|---|---|
| Top tier: 27% | CXOs: 14% | APAC: 47% |
| Mid tier: 52% | Functional/Unit leaders: 39% | EMEA: 29% |
| Smaller Players: 21% | Managers: 47% | Americas: 24% |
Market-Sizing & Forecasting
Sizing starts with a top-down build where disease prevalence and case flows are converted into a treated patient pool, and then mapped to expected product usage across key wound categories. In practice, indicators such as diabetic foot ulcer burden, burn incidence, chronic wound recurrence, share treated in hospitals versus outpatient settings, and reimbursement coverage signals are used to shape adoption and utilization.
Those totals are then checked with selective bottom-up approximations, such as rolling up a sample of supplier revenue footprints, channel feedback on unit movement, and a simple ASP times volume sense-check by major product families where data is available. When gaps show up in these cross-checks, we adjust assumptions in a traceable way, most often in utilization per treated case, setting mix, or price realization by region.
For forecasting, we use scenario analysis supported by expert inputs, since policy and reimbursement shifts can change adoption faster than pure time-series trends. Growth is projected by combining expected case growth with gradual penetration gains, and pricing is handled through modest ASP progression logic that reflects mix shifts, not just inflation.
Data Validation & Update Cycle
Outputs are validated through triangulation across independent signals, including epidemiology anchors, procedure or visit proxies, reimbursement checks, and supplier-side reality checks collected in interviews. Outliers are flagged early, and a second analyst reviews the driver assumptions before the final numbers are signed off.
The model is refreshed on an annual schedule so major demand indicators and pricing assumptions stay current, and interim updates are triggered when material events occur (such as a meaningful reimbursement change or a notable regulatory approval that expands addressable use). Before delivery, we do a final pass to ensure the latest public data and recent expert feedback are reflected.
Mordor Intelligence's Tissue Engineered Skin Substitute Market Size Compared With Other Published Estimates
Published market sizes for tissue engineered skin substitutes often do not match because the underlying scope and valuation point can be set differently, and then the same clinical demand gets priced in different ways. Differences also come from how each source treats service revenue, which end-use settings are counted, and how quickly assumptions are refreshed after reimbursement or adoption shifts.
Some published figures are presented as manufacturer-level value and can include related services, which changes the revenue layer being measured. In Mordor Intelligence calculations, totals are kept at the product market level aligned to clinical use, and simple wound dressings and other non-substitute consumables are not added into the market even when they appear in adjacent wound care spending.
Benchmark comparison
| Source | Market Size | Gaps in Research Methodology |
|---|---|---|
| Mordor Intelligence | USD 2.50 B (2025) | |
| Global Market Publisher A | USD 2.03 B (2025) | Uses a factory-gate framing and may keep revenue at the manufacturer sale level with related services included, which can shift how pricing and channel markups are treated versus an end-market product revenue view. |
| Industry Research Portal B | USD 2.30 B (2024) | Uses a different base year and a longer forecast window, and the sizing can move based on how chronic wound case volumes and site-of-care mix are translated into adoption rates across regions. |
The spread in the table is mainly explained by revenue-layer choices, base year alignment, and how adoption is translated from wound burden into treated usage. By keeping the inputs tied to observable care pathways and by re-checking key variables like treated pool, setting mix, and price realization, the final estimate stays easy to trace and repeat.


Key Questions Answered in the Report
What is the current value of the tissue-engineered skin substitutes market?
The tissue engineered skin substitutes market stands at USD 2.62 billion in 2026 and is projected to reach USD 3.33 billion by 2031.
Which construct type grows the fastest?
Cellular autologous products record a 13.10% CAGR through 2031, reflecting strong demand for personalized grafts.
Why are biosynthetic materials gaining traction?
Biosynthetic scaffolds marry biologic functionality with manufacturing consistency, driving an 11.05% CAGR over 2026-2031.
Which region offers the highest growth opportunity?
Asia Pacific shows the quickest pace with a 9.02% CAGR due to healthcare infrastructure upgrades and demographic shifts.
How is home healthcare influencing market dynamics?
Home-based wound care rises at a 8.85% CAGR as portable, easy-to-apply substitutes reduce inpatient reliance and cut costs.
Page last updated on:


 Your data is secure and never sold or shared.


