Exoskeleton Market Size and Share
Market Overview
| Study Period | 2020 - 2031 |
|---|---|
| Market Size (2026) | USD 0.92 Billion |
| Market Size (2031) | USD 2.35 Billion |
| Growth Rate (2026 - 2031) | 20.63% CAGR |
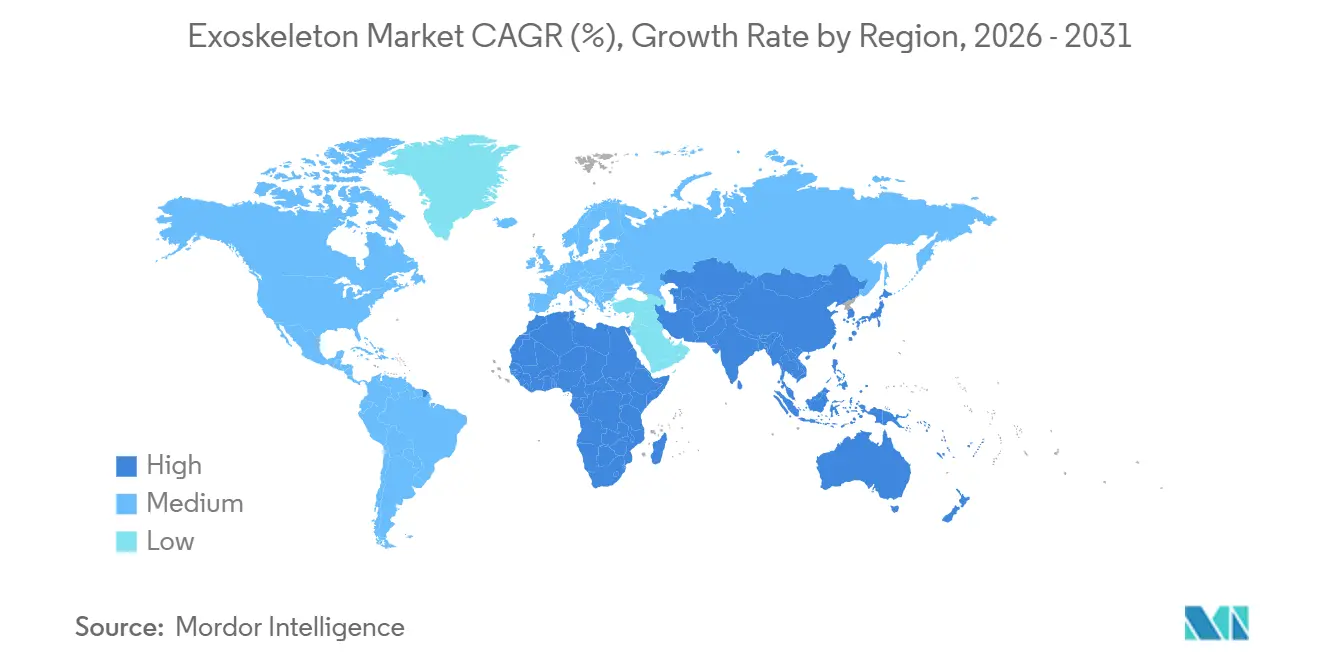
| Fastest Growing Market | Asia Pacific |
| Largest Market | North America |
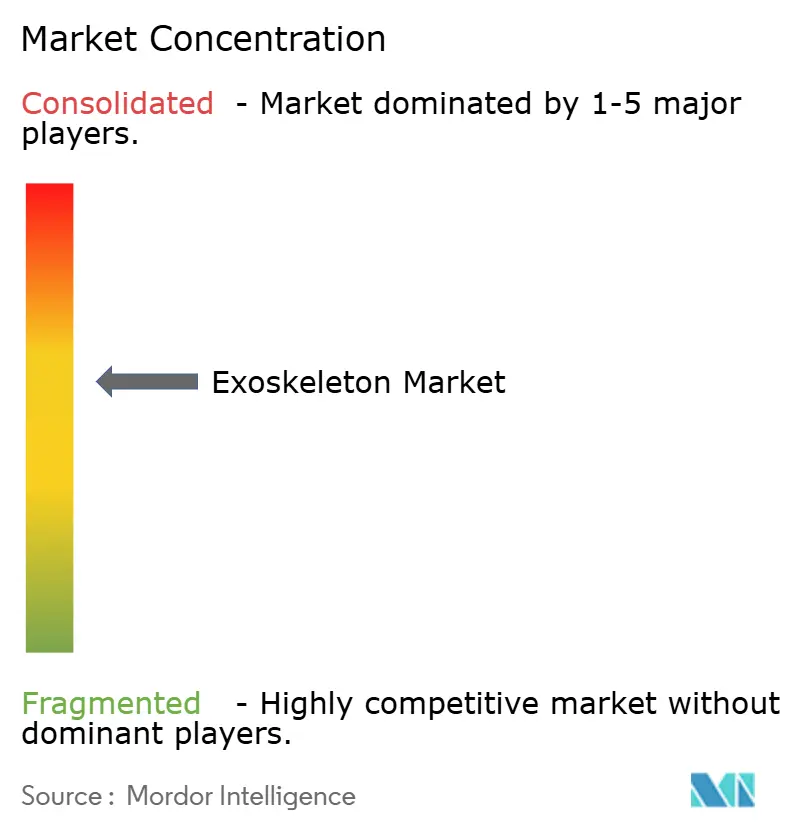
| Market Concentration | Medium |
Major Players *Disclaimer: Major Players sorted in no particular order Image © Mordor Intelligence. Reuse requires attribution under CC BY 4.0. | |
Exoskeleton Market Analysis by Mordor Intelligence
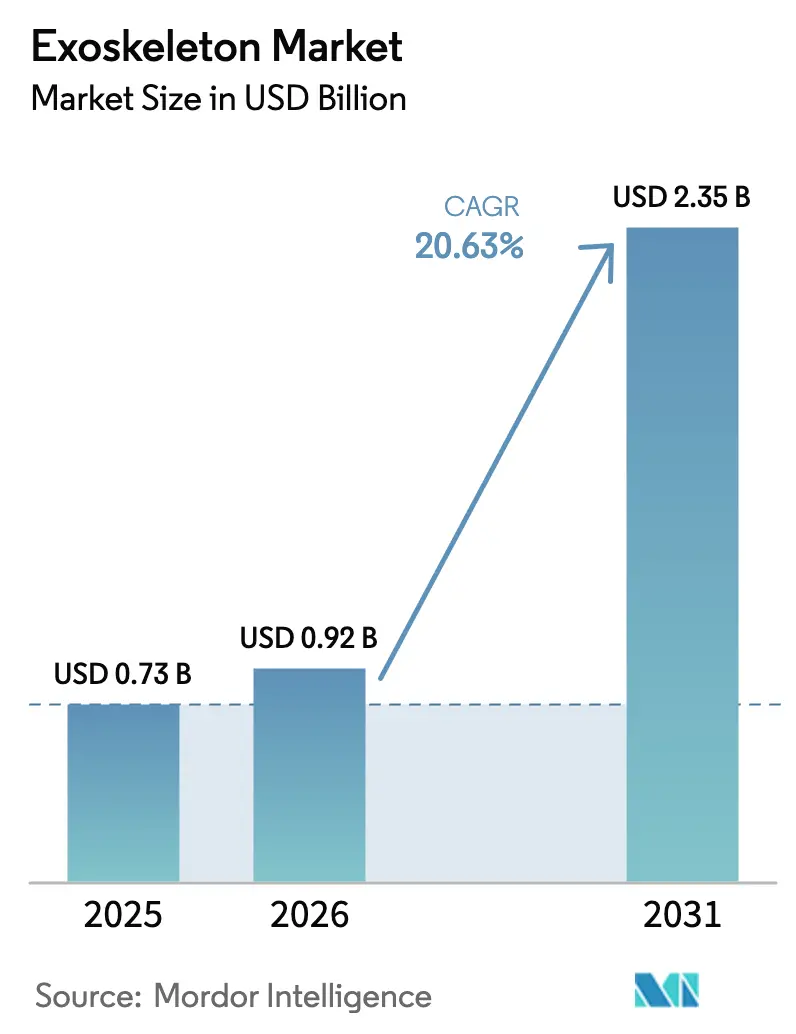
The Exoskeleton Market size was valued at USD 0.73 billion in 2025 and is estimated to grow from USD 0.92 billion in 2026 to reach USD 2.35 billion by 2031, at a CAGR of 20.63% during the forecast period (2026-2031).
Uptake is broadening from hospital-based gait rehabilitation suites into factory production lines, soldier augmentation programs, and mid-priced consumer wellness gear. Subscription “Exoskeleton-as-a-Service” contracts are removing capital-expenditure barriers for small- and medium-sized manufacturers, while cloud-linked outcome analytics are paving the way for value-based reimbursement that compresses U.S. Medicare approval cycles from months to weeks. In the Asia Pacific, sovereign industrial-policy grants in China, Japan, and South Korea are localizing actuator supply chains and accelerating time-to-market for domestic brands. North American and European factories, meanwhile, adopt upper-body rigs that reduce deltoid muscle activity by 30–40%, lowering workers' compensation claims and supporting lean-manufacturing targets. Defense orders, such as the USD 6.9 million U.S. Army contract for ONYX, underscore a high-margin niche that also drives component ruggedization standards.
Key Report Takeaways
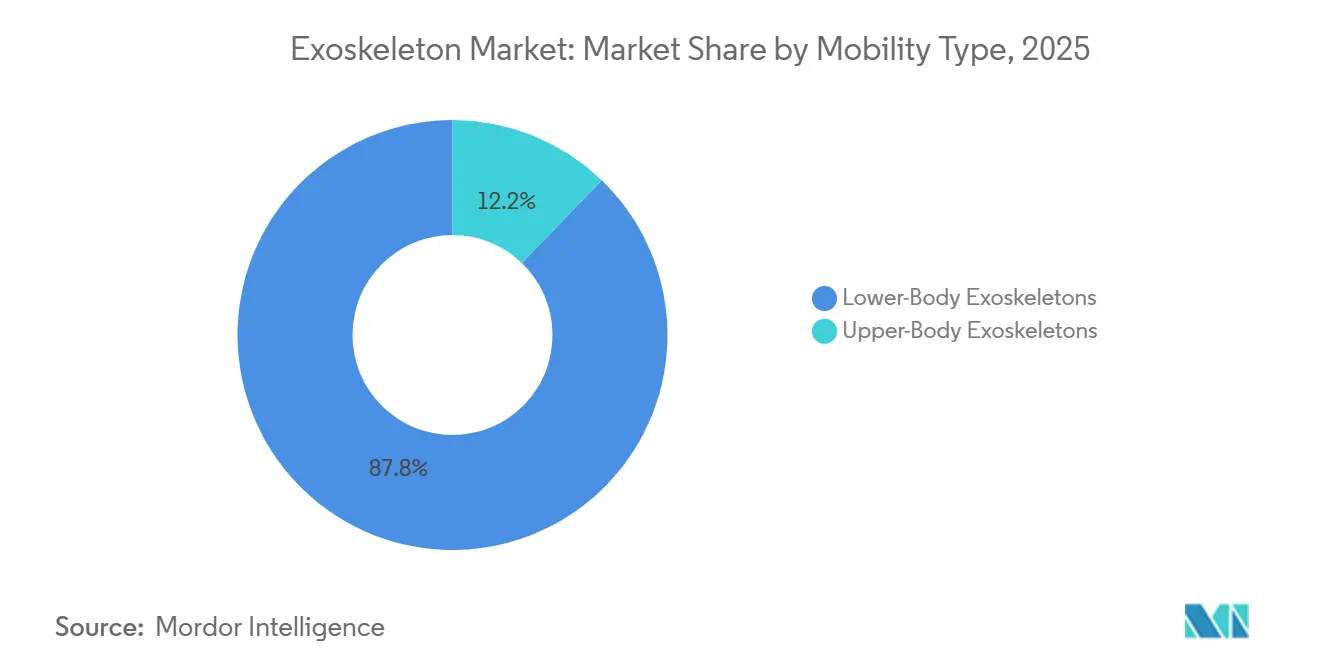
- By mobility type, lower-body systems led the exoskeleton market, accounting for 87.81% of the market share in 2025. Meanwhile, upper-body solutions are forecast to log a 24.06% CAGR through 2031.
- By power source, powered designs accounted for 82.83% of the exoskeleton market size in 2025; hybrid architectures are the fastest-growing segment at a 27.77% CAGR through 2031.
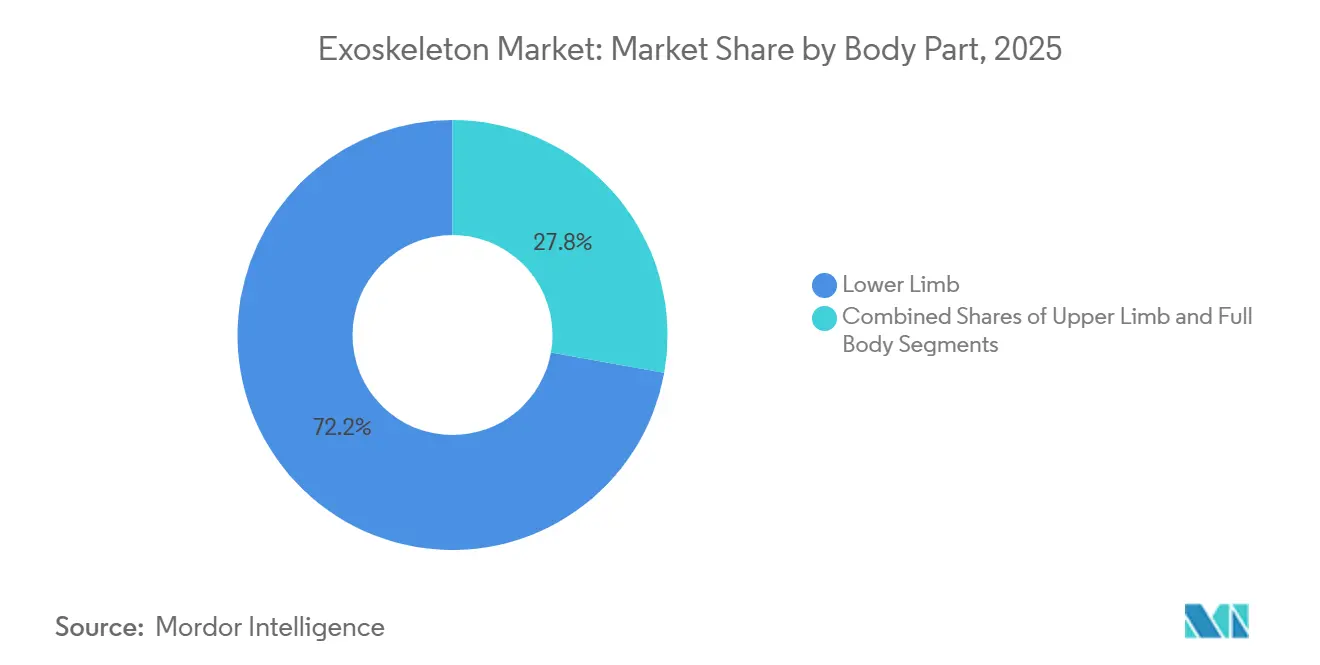
- By body part, lower-limb devices captured a 72.18% share of the exoskeleton market size in 2025, whereas upper-limb rigs are expected to advance at a 22.78% CAGR through 2031.
- By end user, hospitals and rehabilitation centers held 47.36% of the exoskeleton market share in 2025; personal and home-care buyers represent the fastest-growing segment, with a 28.87% CAGR up to 2031.
- By geography, North America dominated with 40.65% exoskeleton market share in 2025, while Asia Pacific is poised for a 26.87% CAGR during the forecast horizon.
Note: Market size and forecast figures in this report are generated using Mordor Intelligence’s proprietary estimation framework, updated with the latest available data and insights as of January 2026.
Global Exoskeleton Market Trends and Insights
Drivers Impact Analysis*
| Driver | (~) % Impact on CAGR Forecast | Geographic Relevance | Impact Timeline |
|---|---|---|---|
| Aging Population & Neurological-Disorder Prevalence Boosting Rehab Demand | +4.2% | Global, concentrated in Japan, South Korea, EU | Long term (≥ 4 years) |
| Work-Safety Regulations Spurring Industrial Adoption | +3.8% | North America, Germany, France | Medium term (2–4 years) |
| Defense Budgets Accelerating Soldier-Augmentation R&D | +2.1% | United States, South Korea, Australia | Medium term (2–4 years) |
| Emergence of Mid-Priced Consumer/Outdoor Exosuits Enlarges TAM | +3.5% | North America, China, urban Asia Pacific | Short term (≤ 2 years) |
| Subscription "Exoskeleton-As-A-Service" Lowers SME Entry Barriers | +2.9% | Global, early traction in North America, Germany | Medium term (2–4 years) |
| Cloud-Based Outcome Analytics Enabling Value-Based Rehab Payments | +2.4% | United States, pilot programs in UK, Netherlands | Long term (≥ 4 years) |
| Source: Mordor Intelligence | |||
Aging Population & Neurological-Disorder Prevalence Boosting Rehab Demand
Worldwide, the cohort aged 60 and above will double to 2.1 billion by 2050, intensifying the incidence of stroke, Parkinson’s disease, and spinal-cord injury.[1]World Health Organization, “Ageing and Health,” who.int Japanese policymakers widened coverage for Cyberdyne’s HAL in 2024 after data showed that robotic gait therapy shortened the average post-stroke hospital stay by 14 days.[2]Ministry of Health, Labour and Welfare Japan, “Reimbursement Coverage for Assistive Devices,” mhlw.go.jp Similar evidence is informing European payer pilots, signaling that outcome-based contracts will become the default procurement method for rehabilitation devices. FDA 510(k) clearances and ISO 13482 compliance now serve as baseline requirements for clinic adoption in the United States and the European Union. Together, these trends highlight the enduring demand for lower-limb systems that restore upright mobility, mitigate pressure ulcer risk, and maintain bone density.
Work-Safety Regulations Spurring Industrial Adoption
Revised OSHA guidelines, effective in 2024, oblige U.S. employers to audit overhead tasks and loads above 10 kg, creating a regulatory incentive for shoulder-support rigs. Germany’s Federal Institute for Occupational Safety and Health reported 30–40% reductions in deltoid EMG when workers used passive exoskeletons, prompting automakers to extend deployments across weld, paint, and assembly shops.[3]Federal Institute for Occupational Safety and Health Germany, “Exoskeletons in Occupational Use,” baua.de As insurance premiums fall alongside musculoskeletal disorder claims, factories capitalize on double-digit internal rate of return metrics for upper-body wearables.
Defense Budgets Accelerating Soldier-Augmentation R&D
The FY 2026 U.S. National Defense Authorization Act earmarks multi-year funds for human augmentation systems, moving programs from prototypes into production. Lockheed Martin’s ONYX reduces the metabolic cost of carrying a 60 kg load by 30%, earning a USD 6.9 million contract that validates the use case for infantry patrols. South Korea’s DAPA is co-funding similar designs for surveillance along the Demilitarized Zone, reflecting allied interest in extended-range missions. Compliance with MIL-STD-810 and NATO STANAGs is driving suppliers to invest in ruggedized actuators and sealed electronics that later spill over into industrial SKUs. Hybrid powertrains, which combine passive springs with intermittent motor assist, increasingly satisfy both endurance and torque demands.
Emergence of Mid-Priced Consumer/Outdoor Exosuits Enlarges TAM
A new tranche of sub-USD 5,000 devices is expanding the total addressable population by 40%, offering aging hikers and recreational athletes powered assistance without the complexity of hospital-grade equipment. Hypershell’s Omega sells at USD 799 and delivers 30 W of hip support for six-hour trail treks. Samsung’s GEMS Hip was cleared by South Korean regulators for over-the-counter sale in 2024 at USD 3,750–7,500, providing a daily-use mobility aid without a prescription. These products sit outside stringent medical-device rules, yet vendors pursue voluntary IEC 60601 conformity to reassure retail buyers. Early adopters highlight lower perceived exertion and longer activity times, signaling a consumer-wellness channel that could rival therapeutic volumes by the end of the decade.
Restraints Impact Analysis*
| Restraint | (~) % Impact on CAGR Forecast | Geographic Relevance | Impact Timeline |
|---|---|---|---|
| High Capital Cost & Limited Reimbursement | -3.1% | Global, acute in United States, Southern Europe | Medium term (2–4 years) |
| Battery-Energy Density Limits Field Endurance | -2.4% | Industrial and defense segments globally | Long term (≥ 4 years) |
| Absence of Ergonomic Test Standards Creates Liability Concerns | -1.8% | North America, Europe | Medium term (2–4 years) |
| Tariff-Driven Actuator-Component Cost Volatility Squeezes Margins | -2.2% | Global supply chains, acute in United States | Short term (≤ 2 years) |
| Source: Mordor Intelligence | |||
High Capital Cost & Limited Reimbursement
Clinic-grade exoskeletons list at USD 80,000–150,000, restricting purchases to academic medical centers or flagship rehabilitation chains. U.S. Medicare requires documented failure of conventional physiotherapy and physician attestation of 30-minute upright tolerance, disqualifying nearly half of potential candidates. Private insurers label take-home models “investigational,” compelling many patients to self-fund despite FDA clearance. Germany reimburses hospital sessions under DRG codes, but refuses to reimburse personal devices, while Italy and France have yet to establish payment pathways. The mismatch depresses adoption in the high-growth home-care segment and reinforces calls for bundled-payment pilots tied to real-world outcome data.
Battery-Energy Density Limits Field Endurance
Today’s lithium-ion packs deliver 150–250 Wh/kg, capping active-mode runtime at 4–8 hours and forcing industrial and military users to schedule disruptive battery swaps. Sarcos’ Guardian XO requires replacement packs every four hours while lifting 90 kg loads, eroding uptime benefits. Solid-state chemistries promise 400 Wh/kg by 2027, but prototypes face thermal-runaway risks that necessitate heavier thermal management systems. Designers face a mass-benefit trade-off: packs exceeding 1.5 kg raise limb inertia, negating metabolic gains. UN 38.3 transport testing and IEC 62133 safety hurdles further delay commercialization timelines and investors’ break-even projections.
*Our forecasts treat driver/restraint impacts as directional, not additive. The impact forecasts reflect baseline growth, mix effects, and variable interactions.
Segment Analysis
By Mobility Type: Industrial Traction Fuels Upper-Body Growth
Lower-body rigs held an 87.81% exoskeleton market share in 2025, reflecting their entrenched use in stroke and spinal cord injury rehabilitation, where gait training protocols depend on programmable knee and hip assistance. These units generate steady replacement demand from rehabilitation centers and veterans’ hospitals. In contrast, upper-body systems experienced faster adoption in assembly lines, with a 24.06% CAGR, as automakers and aerospace primes addressed shoulder-injury costs that previously exceeded USD 1 billion annually in lost productivity and compensation claims. Factory pilots validate throughput gains of 15–20% in tasks such as windshield fastening and wing drilling, confirming immediate payback periods. The dual-track dynamic positions lower-limb rigs to dominate clinical revenues while upper-body devices expand industrial revenues and diversify supplier order books.
Upper-body progress aligns with ergonomic mandates now commonly found in U.S. and EU certification audits. Light passive braces weighing under 3 kg win favor for their drop-in compatibility with shift changes, whereas powered shoulder units combine high-peak torque with predictive-maintenance telemetry that reinforces service-contract annuity streams. Full-body exoskeletons remain a niche market for heavy-industry users with handling demands of 90 kg, and joint-specific waist supports are gaining traction in e-commerce distribution centers that face record parcel volumes.


By Power Source / Mode: Hybrid Designs Extend Shift Runtime
Powered architectures commanded 82.83% of the exoskeleton market size in 2025, necessary for therapeutic gait modulation and soldier-load reduction. Clinics rely on brushless DC motors paired with harmonic drives to deliver 40 Nm of knee torque with sub-50 ms latency, which is vital for neuroplastic rehabilitation. Passive frames, built on springs and cams, excel in overhead factory tasks due to their zero recharge requirements and minimal maintenance. Hybrids integrate passive load-sharing with bright motor bursts, lifting runtime to 8–10 hours and aligning with OSHA-defined shift blocks. Consequently, hybrids are growing at 27.77% CAGR and already dominate new proposal requests from automotive ergonomists.
Battery-intensive powered models still bear regulatory burdens under IEC 60601, while passive frames fall outside many medical device regimes. Vendors now tout firmware that tunes assist curves to user gait data, positioning hybrid exoskeletons as software-defined assets whose performance improves via over-the-air updates. The strategy focuses on recurring-revenue bundles and underpins the subscription leap beyond traditional sales. Suppliers that master torque-to-watt optimization will differentiate themselves as energy density increases, consolidating their share in an increasingly data-rich value chain.
By Body Part: Shoulder-Support Leads Upper-Limb Wave
Lower-limb platforms captured 72.18% exoskeleton market share in 2025, given their decade-long head start in clinical research and regulatory clearances. Nevertheless, the 22.78% CAGR logged by upper-limb systems underscores unsatisfied demand across aerospace, shipbuilding, and logistics verticals. Myomo’s FDA-cleared MyoPro orthosis demonstrates that powered elbow-wrist assistance can be effectively integrated into daily living contexts, thereby expanding payers’ assessment of functional outcome gains.
Full-body rigs, typified by Sarcos Guardian XO, address heavy-load contexts but remain limited to specialized yards because device mass approaches 50 kg and list prices top USD 500,000. Joint-specific braces for lumbar support are being introduced in fulfillment centers, where Amazon is piloting soft textile suits to reduce lift-and-twist strain during parcel sortation surges. As AI-driven sensor fusion informs real-time load distribution, body-part segmentation may become blurred; however, device certification will still follow limb-specific risk profiles under ISO 13482.
By End User: Home-Care Demand Rises with Aging-in-Place
Hospitals and rehabilitation centers held a 47.36% share in 2025, reflecting bundled DRG reimbursement and capital allocations for robotic therapy wings. Rapid throughput helps justify purchases, with outcome dashboards showing 25% therapist-time savings per gait-training day. Personal and home-care users, however, represent the fastest-growing segment at 28.87% CAGR, as seniors prefer mobility aids that minimize inpatient stays. ReWalk Personal-6.0 demonstrates that wheelchair users can navigate residential layouts and perform standing transfers, thereby reducing the demand for at-home nursing visits and strengthening payers’ shared-savings logic.
Industrial and military buyers fill a third bucket whose volumes swell amid workforce-shortage pressures and defense planning cycles. Subscription leasing at EUR 199 per user per month demonstrates that even tier-three suppliers to automotive OEMs can deploy exoskeletons without engaging in capital budget fights. Compliance in the home environment requires adherence to IEC 60601-1-11 for patient-moving equipment, which raises the bar for user-friendly interfaces and washable upholstery covers. Vendors that fulfill both hospital and home-care checklists will capture lifetime-value streams as therapy transitions from clinic to living room.
Geography Analysis
North America accounted for 40.65% of the exoskeleton market share in 2025, driven by FDA-cleared product portfolios and a robust distribution network of durable medical equipment suppliers. The United States leads clinical deployments at centers such as Kessler and Shepherd, where real-world evidence informs payer rule-making. OSHA’s 2024 ergonomic assessment directive is catalyzing factory pilots from Detroit to Seattle, converting EHS compliance budgets into exoskeleton leases. Canada lags due to provincial budget ceilings, whereas Mexico’s nascent market awaits revisions to its social security code to spur reimbursement.
Asia Pacific registers the fastest growth at a 26.87% CAGR through 2031, propelled by China’s 297 million citizens aged 60+ and Japan’s super-aged demographic, where 29% of residents exceed 65 years. Mainland hospitals tap Healthy China 2030 subsidies to order gait-therapy robots, while Japan’s national insurance now reimburses HAL for eight neuromuscular indications. South Korea’s KRW 50 billion robotics fund is nurturing domestic actuator plants that lower bill-of-materials costs. Australia leverages its National Disability Insurance Scheme for pilot grants, and India courts FDI to assemble budget devices for a vast stroke population.
Europe remains bifurcated. Germany, France, and the United Kingdom undertake large-scale industrial pilots under fresh ergonomic directives and secure CE-marked rehab units through DRG codes. Southern Europe lags because fragmented reimbursement hinders capital expenditure planning, and MDR transition timelines strain importer resources. Scandinavia experiments with soft-suit subsidies for rural eldercare, while Eastern Europe focuses EU cohesion funds on stroke rehab capacity. Middle East healthcare hubs in the UAE and Saudi Arabia procure flagship units for showcase hospitals. Still, Africa and South America exhibit limited uptake beyond Brazil’s pilot projects in São Paulo and Rio, which are constrained by tariff regimes and currency fluctuations.

Competitive Landscape
Sector concentration is moderate: the five most prominent vendors, Ekso Bionics, ReWalk Robotics, Cyberdyne, Parker Hannifin, and Ottobock, hold significant revenue share, while dozens of smaller players focus on niche limbs, textile suits, or regional markets. Rehabilitation-centric firms court payers by publishing peer-reviewed outcomes and embedding cloud analytics that validate functional gains. Industrial-sector specialists promote subscription economics and telemetry that predict actuator overhaul windows, reducing downtime for SMEs. Defense contractors such as Lockheed Martin exploit classified supply chains and vendor-qualified lists to win sole-source awards for rugged soldier-assist kits.
Start-ups inject innovation: Bioservo’s tendon-driven Carbonhand glove secured EUR 10 million in Series B funding and achieved CE marking in 2024, extending grip-assist capabilities to industrial and clinical workflows. Fourier Intelligence scaled its X2 lower-limb model to 500 units annually by localizing gearboxes in Shanghai, under-pricing Western equivalents by 30–40% and signaling a credible cost-disruption threat. M&A reshapes the map; Ekso Bionics’ 2024 merger with Lifeward united industrial and rehab portfolios, and ReWalk’s partnership with AlterG bundles anti-gravity treadmills with exoskeleton therapy. Regulatory rigor remains a moat: full FDA 510(k) and MDR certification can exceed USD 10 million in trial and audit expenses, throttling undercapitalized aspirants.
Strategic roadmaps now pivot to AI-enabled gait adaptation, edge-compute-powered collision avoidance, and energy-recuperation brakes. Vendors able to fuse these technologies with flexible payment models and ISO-compliant quality systems will capture disproportionate share as volume scales beyond early adopters. Meanwhile, insurers are beginning to reward suppliers that guarantee outcome milestones, cementing data analytics capability as a competitive differentiator in the next five-year horizon.
Exoskeleton Industry Leaders
CYBERDYNE Inc.
Ekso Bionics Holdings Inc.
Ottobock SE & Co. KGaA
Parker Hannifin Corporation
Sarcos Technology & Robotics Corporation
- *Disclaimer: Major Players sorted in no particular order

Recent Industry Developments
- April 2025: HeroWear secured USD 5 million Series A funding and partnered with Engage to accelerate Apex 2 exosuit rollouts.
- April 2025: KULR Technology and German Bionic forged an exclusive North American pact for Apogee ULTRA distribution, birthing KULR AI & Robotics.
- April 2025: Ekso Bionics signed a distribution deal with Bionic Prosthetics & Orthotics Group to broaden reach of Ekso Indego Personal.
- March 2024: Innophys began sales of Muscle Suit models in Slovakia and the Czech Republic.


Research Methodology Framework and Report Scope
Market Definitions and Key Coverage
Our study defines the exoskeleton market as revenue generated from powered or passive, rigid-frame wearable devices that amplify or restore human strength or mobility in healthcare, industrial, and defense settings. The valuation covers original equipment sales and associated licensed software in 2025 dollars, excluding aftermarket parts and soft exosuits that rely solely on textiles and pneumatics.
Scope exclusion: consumer fitness wearables and standalone prosthetic limbs fall outside the modeled boundary.
Segmentation Overview
- By Mobility Type
- Lower-Body Exoskeletons
- Upper-Body Exoskeletons
- Full-Body Exoskeletons
- Joint-Specific / Waist Systems
- By Power Source / Mode
- Powered / Active
- Passive
- Hybrid
- Soft Exosuits
- By Body Part
- Upper Limb
- Lower Limb
- Full Body
- By End User
- Hospitals & Rehab Centers
- Personal / Home-care Users
- Other End Users
- By Geography
- North America
- United States
- Canada
- Mexico
- Europe
- Germany
- United Kingdom
- France
- Italy
- Spain
- Rest of Europe
- Asia-Pacific
- China
- Japan
- India
- Australia
- South Korea
- Rest of Asia-Pacific
- Middle East & Africa
- GCC
- South Africa
- Rest of Middle East & Africa
- South America
- Brazil
- Argentina
- Rest of South America
- North America
Detailed Research Methodology and Data Validation
Primary Research
Mordor analysts interviewed rehabilitation clinicians, ergonomics leads at automotive plants, and defense procurement officers across North America, Europe, and Asia-Pacific. These discussions helped sanity-check unit pricing, duty-cycle assumptions, typical utilization lifespans, and regional reimbursement triggers that are hard to capture through desk research alone.
Desk Research
We began with published injury and disability statistics from bodies such as the World Health Organization, Eurostat, and the US Bureau of Labor Statistics, which offered baseline prevalence figures for stroke, spinal cord injury, and musculoskeletal disorders. Technology adoption rates and patent momentum were mapped using Questel and the USPTO bulk data sets, while import-export volumes for robotic assemblies were assessed through Volza trade logs. Defense budget outlays and solicitations came from Global Security and Tenders Info, giving early indicators for military demand. Company 10-Ks, investor decks, and peer-reviewed journals on human-robot interaction rounded out the secondary evidence. The sources listed are illustrative, not exhaustive, and many more feeds supported validation and clarification.
Market-Sizing & Forecasting
A top-down rebuild starts with annual production and trade data, resized by powered versus passive penetration and adjusted for retirement of legacy stock. Target year totals are then corroborated through a selective bottom-up roll-up of sampled manufacturer shipments multiplied by verified average selling prices. Key variables driving the model include stroke incidence, heavy-manufacturing workforce headcount, defense R&D budgets, sensor cost index trends, Medicare coverage milestones, and patent citation velocity. Multivariate regression projects each driver, while scenario analysis buffers regulatory or reimbursement shocks. Where granular shipment detail is thin, we bridge gaps with calibrated utilization factors learned from expert interviews.
Data Validation & Update Cycle
Outputs go through variance checks against independent datasets, followed by tiered analyst review. Anomalies prompt re-contact of sources before sign-off. The database refreshes every twelve months, with interim amendments triggered by material events such as major regulatory approvals or insurer policy shifts. A final freshness sweep is completed before client release.
Why Mordor's Exoskeleton Market Baseline Is Decision-Ready
Published estimates often diverge because firms pick differing product mixes, price bases, and refresh cadences. By locking scope to rigid-frame wearables and using live ASP inputs, we reduce the noise that can inflate or deflate totals.
Key gap drivers include: some studies ignore industrial rollouts, others freeze 2023 prices, and a few bundle soft suits and supportive garments with robotic frames, creating headline figures several times larger than the addressable market we track.
Benchmark comparison
| Market Size | Anonymized source | Primary gap driver |
|---|---|---|
| USD 0.57 B | Mordor Intelligence | - |
| USD 0.59 B | Global Consultancy A | Healthcare only, industrial demand omitted |
| USD 0.56 B | Regional Consultancy B | Uses constant 2023 ASP, no inflation or reimbursement shift |
| USD 2.49 B | Trade Journal C | Combines powered suits, passive braces, and soft exosuits |
In sum, Mordor's disciplined definition, live pricing checks, and dual-angle modeling provide a balanced baseline that decision-makers can retrace and replicate without relying on opaque assumptions.


Key Questions Answered in the Report
How large is the exoskeleton market in 2026 and what is the expected growth?
The exoskeleton market size is USD 0.92 billion in 2026 and is set to reach USD 2.35 billion by 2031, reflecting a 20.63% CAGR.
Which mobility type currently dominates revenues?
Lower-body models account for 87.81% of 2025 revenue, as they are deeply entrenched in clinical gait-rehabilitation programs.
Which segment is expanding fastest?
Upper-body systems used in automotive and aerospace assembly are projected to grow at 24.06% CAGR through 2031.
Why is Asia Pacific the fastest growing region?
Aging demographics and government grants in China, Japan and South Korea underpin a 26.87% CAGR through 2031.
What is the main barrier to home-care adoption?
High unit costs of USD 80,000–150,000 and fragmented reimbursement keep personal users from wider uptake.
Page last updated on:


