High Power Charger For Electric Vehicle Market Size and Share
Market Overview
| Study Period | 2020 - 2031 |
|---|---|
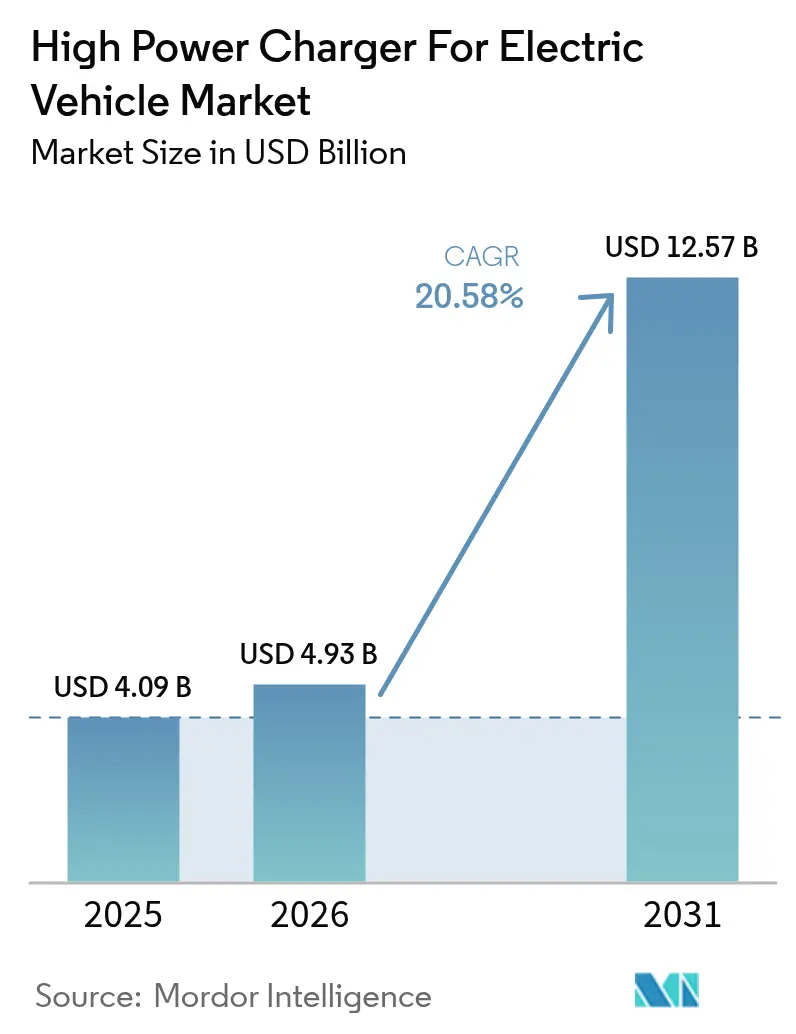
| Market Size (2026) | USD 4.93 Billion |
| Market Size (2031) | USD 12.57 Billion |
| Growth Rate (2026 - 2031) | 20.58% CAGR |
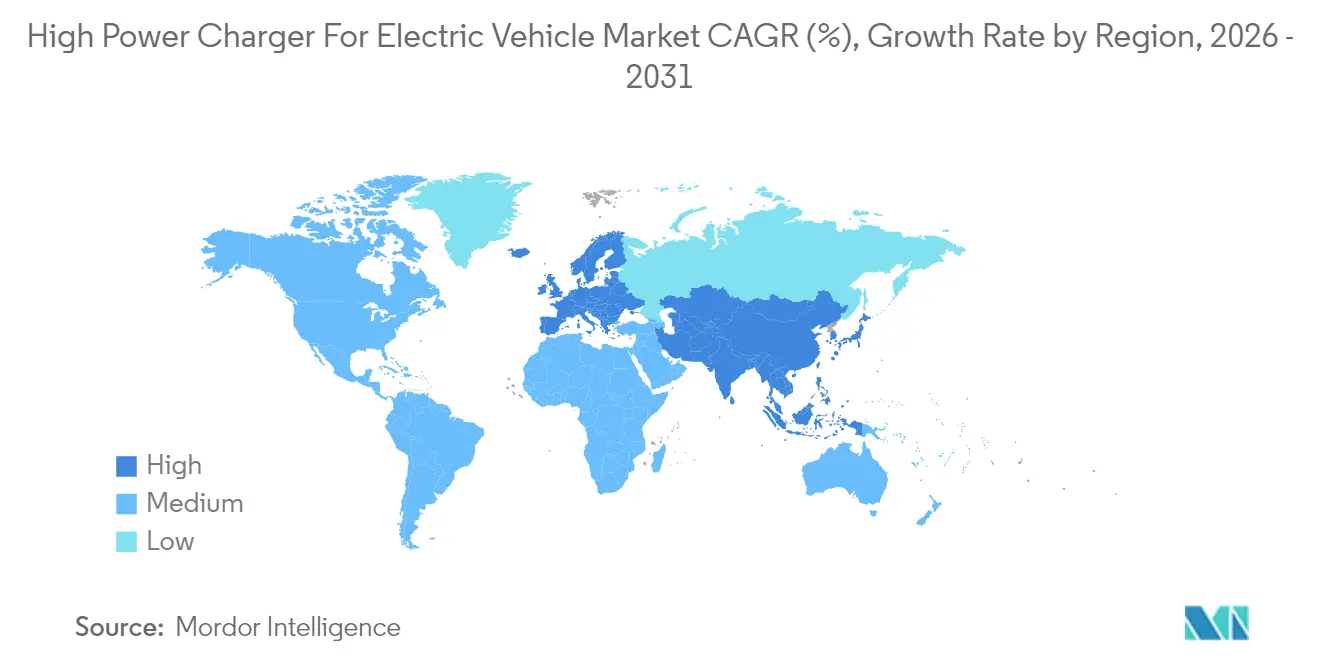
| Fastest Growing Market | Europe |
| Largest Market | Asia Pacific |
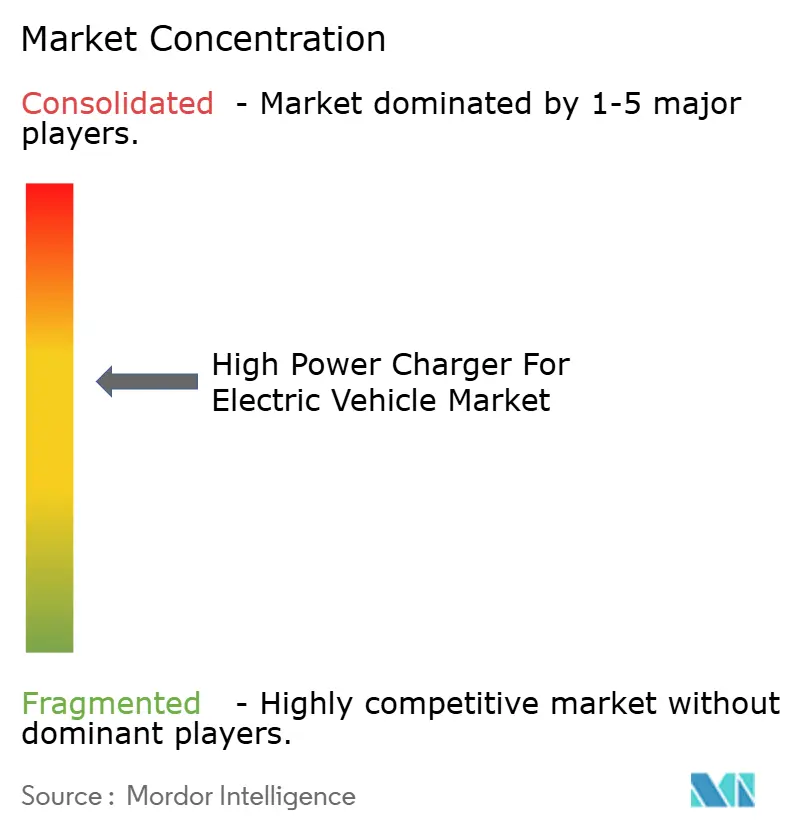
| Market Concentration | Medium |
Major Players *Disclaimer: Major Players sorted in no particular order Image © Mordor Intelligence. Reuse requires attribution under CC BY 4.0. | |
High Power Charger For Electric Vehicle Market Analysis by Mordor Intelligence
The high power charger for the electric vehicle market size is expected to grow from USD 4.09 billion in 2025 to USD 4.93 billion in 2026 and is forecast to reach USD 12.57 billion by 2031 at 20.58% CAGR over 2026-2031. Growth rests on three structural shifts: automakers are rolling out 800-volt vehicle platforms that call for dispensers delivering more than 350 kW, governments are funneling multibillion-dollar grants toward rural and highway corridors, and charge-point operators are boosting site economics through vehicle-to-grid grid-service revenue. In 2024, Asia-Pacific emerged as a significant contributor to global revenue, driven by China's county-level coverage mandate. Meanwhile, Europe is experiencing robust growth, supported by the Alternative Fuels Infrastructure Regulation. Charge-point operators find that battery-buffer storage, renewable power-purchase agreements, and digital advertising help halve site payback periods despite high grid-upgrade costs.
Key Report Takeaways
- By charger type, DC fast chargers commanded 68.55% of the high power charger for electric vehicle market size in 2025; ultra-fast units above 250 kW are expanding at a 22.35% CAGR through 2031.
- By power output, the 50-to-150 kW band captured a 45.60% share in 2025, while the above-350 kW tier is set to grow at 22.10% by 2031.
- By connector type, Combined Charging System (CCS) led with 53.70% of installations in 2025, yet Tesla supercharger adoption is increasing at 24.30% CAGR as major automakers switch to the protocol.
- By installation site, urban public stations represented 60.75% of deployments in 2025; highway charging stations are registering a 21.95% CAGR due to corridor mandates.
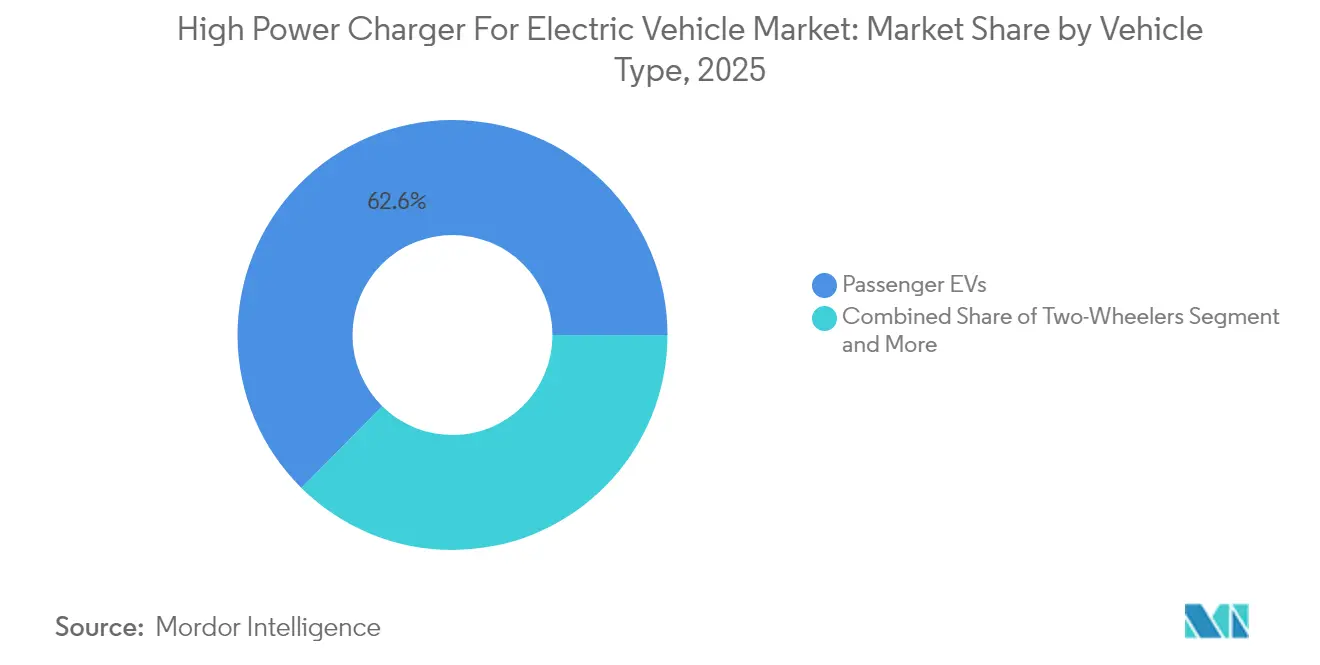
- By vehicle type, passenger EVs accounted for 62.60% of sessions in 2025, whereas commercial buses and trucks will post a 21.40% CAGR on fleet electrification.
- By end user, public charging operators accounted for 67.85% share in 2025, while private fleet owners will post a 23.25% CAGR through 2031.
- By geography, Asia-Pacific dominated with a 48.60% share in 2025, while Europe is set to advance at a 22.80% CAGR.
Note: Market size and forecast figures in this report are generated using Mordor Intelligence’s proprietary estimation framework, updated with the latest available data and insights as of 2026.
Global High Power Charger For Electric Vehicle Market Trends and Insights
Drivers Impact Analysis*
| Driver | (~) % Impact on CAGR Forecast | Geographic Relevance | Impact Timeline |
|---|---|---|---|
| Expansion of Long-Range EV Sales | +5.2% | Global with focus on China, North America, Western Europe | Medium term (2-4 years) |
| Government Funding for Ultra-Fast Charging | +4.8% | North America, Europe, China | Short term (≤2 years) |
| OEMs Shift to 800V Architecture | +4.3% | Germany, South Korea, United States | Medium term (2-4 years) |
| Declining Renewables Lowers Operating Costs | +3.1% | Sunbelt regions worldwide | Long term (≥4 years) |
| Depot Battery-Swap Needs Pantographs | +2.4% | China and Europe | Medium term (2-4 years) |
| Real-Estate Boosts Return on Investment | +1.9% | Urban centers in developed markets | Long term (≥4 years) |
| Source: Mordor Intelligence | |||
Rapid Expansion of Long-Range EV Sales
In recent years, long-range battery-electric cars with a usable capacity exceeding 80 kWh have gained significant traction in global plug-in sales. Consequently, operators are opting for hardware exceeding 150 kW. This choice stems from the fact that higher-capacity battery packs can be charged much faster with high-powered chargers compared to lower-powered ones. Due to real-world tapering beyond the halfway point of the state of charge, planners are compelled to account for worst-case dwell times instead of relying solely on nameplate power. Highways lacking robust grid capacity necessitate either battery buffers or enhanced feeders, a requirement that can significantly delay projects. This has led to a divided scenario: city drivers often depend on slower urban chargers, while those traveling between cities opt for the convenience of faster charging, albeit at a premium rate.
Government Funding for Ultra-Fast Public Charging
The United States National Electric Vehicle Infrastructure (NEVI) program committed USD 5 billion through 2026 to install charging units capable of offering a minimum of 150 kW of power [1].“NEVI Formula Program Guidance,” U.S. Department of Energy, energy.govEurope’s AFIR mandates charging stations at regular intervals on key TEN-T roads, with plans to enhance their capacity over time. China's county-level initiative focuses on significantly increasing the number of public fast chargers, supported by land and grid-fee incentives. While grants mitigate capital risks, they come with uptime clauses, nudging hardware vendors to incorporate predictive maintenance.
OEM Shift to 800 V Architectures (Above 350 kW)
Platforms like the Porsche Taycan, Hyundai's E-GMP, and GM's Ultium, all operating at 800 V, can achieve peak charges at high rates without the need for bulky cables. With automakers increasingly turning to silicon-carbide inverters, Zeekr has showcased an impressive feat: achieving significant charging rates in just a few minutes. However, operators face a challenge: balancing dual-output dispensers to cater to traditional 400 V fleets. This juggling act poses a risk of stranded assets if the timing of upgrades isn't perfectly aligned.
Declining LCOE from Renewables Lowers OPEX
In sunbelt regions, utility-scale solar now provides electricity at highly competitive rates, offering a significant cost advantage over grid tariffs. Charging hubs, signing long-term PPAs at attractive rates, mitigate price volatility. They also utilize on-site batteries to optimize time-of-use rates, generating notable annual revenue from ancillary services. Meanwhile, off-grid solar-plus-storage systems enable energy access in remote locations far from substations. In this context, energy procurement—not the hardware—emerges as the primary driver of profit margins.
Restraints Impact Analysis*
| Restraint | (~) % Impact on CAGR Forecast | Geographic Relevance | Impact Timeline |
|---|---|---|---|
| High CAPEX and Grid-Upgrade Costs | -3.7% | Global, acute in rural areas | Short term (≤2 years) |
| Standards and Payment-System Fragmentation | -2.9% | Global, severe in North America | Medium term (2-4 years) |
| Local Grid Demand-Charge Exposure | -2.1% | North America, Australia, select Europe | Short term (≤2 years) |
| Battery-Thermal Limits | -1.6% | Global | Long term (≥4 years) |
| Source: Mordor Intelligence | |||
High CAPEX and Grid-Upgrade Costs
Investors face challenges as the cost of a single unit, combined with necessary transformer upgrades, significantly increases project expenses, particularly in rural areas. In congested grids, interconnection timelines are lengthy, and only well-funded affiliates of major oil companies can independently finance rollouts across multiple sites. Although stationary battery buffers help reduce peak energy demand, they introduce additional capital and maintenance requirements.
Standards and Payment-System Fragmentation
The shift from CCS to NACS in North America forces dual-cable hardware that is significantly pricier and complicates software stacks [2]“Transition to NACS,” SAE International, sae.org. Plug & Charge functionality is available on a limited portion of European chargers. Additionally, roaming agreements cover a significant but incomplete number of sites, resulting in cross-border surcharges for users. The absence of a unified megawatt standard is hindering the progress of heavy-duty vehicle electrification, with approvals expected to be delayed until 2025.
*Our forecasts treat driver/restraint impacts as directional, not additive. The impact forecasts reflect baseline growth, mix effects, and variable interactions.
Segment Analysis
By Charger Type: Ultra-Fast Dispensers Reshape Utilization Economics
Ultra-fast dispensers above 250 kW are rising with a 22.35% CAGR through 2031, while DC fast units account for 68.55% of 2025 deployments. Daily utilization for ultra-fast hubs runs 25-35%, surpassing 12-18% for 50-150 kW sites. Wireless pads account for a nominal share but signal emergent demand in premium fleets, whereas pantograph systems sustain significant usage in bus depots.
Despite facing heightened demand charges, the high-power charger market enjoys a 4.5-year payback period at premium highway plazas, making it a financially viable option for operators in these locations. Wireless charging options, while offering the benefit of cable-free convenience, remain limited to niche applications due to their high pad installation costs, which deter widespread adoption. Furthermore, unresolved pantograph interoperability issues continue to pose challenges, forcing many transit agencies to rely on a single vendor, thereby limiting flexibility and increasing dependency on specific suppliers.


By Power Output: Above 350 kW Tier Captures Premium Corridors
50-to-150 kW cabinets retain dominance with 45.60% share in urban areas where grid headroom is tight. Yet profitability depends on ancillary revenue such as digital advertising or demand-response payments. Modular 150-to-250 kW units, favored at suburban shopping centers, can later scale up to 400 kW by adding power modules, reducing stranded-asset risk. The >350 kW band will grow at a 22.10% CAGR, propelled by logistics firms electrifying Class 8 trucks. Operators are bypassing legacy equipment, opting instead for advanced hubs. These hubs, priced competitively, benefit from battery buffers that reduce the need for utility upgrades.
The 150-to-350 kW tier captures a notable share of installations, balancing cost and compatibility with both 400 V and 800 V vehicles. Battery buffers, which represent a considerable investment per site, are becoming standard for installations above 350 kW. Meanwhile, megawatt charging is expected to achieve standardization in the near future. Retailers, cautious about over-investing before a full migration to higher voltages, are using middle-tier chargers as a strategic hedge. This approach allows operators to phase their capital investments, ensuring they remain competitive in the high-power charger market.
By Connector Type: NACS Adoption Fragments North America
Combined Charging System (CCS) delivered 53.70% of global installs in 2025, upheld by European regulation, yet Tesla Supercharger is rising by 24.30% CAGR after Ford, General Motors, and others shifted. CHAdeMO's share of new installations has significantly declined, leaving some early adopters in a lurch. In China, GB/T holds a dominant position, forcing Western companies to adapt to localized hardware that comes with extended certification timelines. While dual-connector dispensers are more expensive, they remain a necessity in North America for the foreseeable future.
Despite its advantages, "Plug & Charge" remains rare, causing users to juggle multiple apps and RFID cards – a hassle for occasional drivers. Tesla's decision to open Superchargers not only bolsters the credibility of NACS but also requires third-party operators to manage two types of cables. This juggling act extends to inventories and software systems, increasing operational complexities. However, this investment grants them access to a broader range of vehicles in the high-power charger market.
By Installation Site: Highway Corridors Command Premium Pricing
Urban public stations formed 60.75% of 2025 deployments, yet they see lower utilization than highway plazas. Corridor mandates in the United States and Europe push highway hubs to a 21.95% CAGR and attract drivers willing to pay for speed and reliability. Fleet depots hit significant utilization through scheduled charging, avoiding demand charges by shifting load overnight. Commercial sites leverage rooftop solar to secure low-cost electricity.
Highway operators, branching into convenience retail, enhance their revenue streams beyond energy margins. Meanwhile, urban locations capitalize on vehicle-to-grid programs to generate additional income through grid support. Residential multi-family complexes lag due to split incentives and panel constraints, spotlighting a white-space for service providers in the high-power charger market.
By Vehicle Type: Commercial Fleets Drive Depot Buildout
Passenger EVs accounted for 62.60% of 2025 sessions, but commercial EVs (buses and trucks) will surge at 21.40% CAGR as zero-emission zones expand. Two-wheelers dominate Asia yet rely on lower power or swap networks. Specialty port and construction equipment pioneers megawatt-scale charging to minimize idle time. Fleet electrification bifurcates between depot overnight charging and public ultra-fast stops, each with distinct tariff and utilization profiles.
Passenger-vehicle public charging is concentrated among urban dwellers lacking home chargers. Battery-swap networks show under-three-year payback by handling 150-200 swaps per day. Regulatory timelines such as California’s 2027 truck mandate and Europe’s 2030 CO2 limits underpin the near-term growth trajectory of the high-power charger market.
By End User: Private Fleets Capture Depot Economics
Public networks generated 67.85% of 2025 revenue, yet private fleets will grow with a 23.25% CAGR by capitalizing on a consistent overnight load at competitive rates. Agency fleets accelerate under procurement mandates, while residential Level 2 remains outside the high-power scope. By sidestepping peak charges, private depots are achieving strong internal rates of return.
Oil-major affiliates consolidate to gain energy-buying leverage, yet margin pressure builds from vertically integrated automakers. Multi-family complexes remain underserved, pointing to an opportunity for charging-as-a-service models that split revenue with landlords. Furthermore, fleets utilizing vehicle-to-grid technology are enhancing the overall cost-effectiveness in the high-power charger market.
Geography Analysis
Asia-Pacific delivered 48.60% of 2025 revenue as China mandates high power charging and stretches buildout to county-level cities despite lower utilization. Europe leads growth at 22.80% CAGR through 2031, driven by AFIR corridor rules that require 300 kW coverage every 60 km by 2027 . India’s FAME-II injected INR 10,000 crore (~USD 1.2 billion) but faces tier-2 grid bottlenecks, delaying projects up to several months. Japan juggles CHAdeMO and CCS dual-standard hardware amid tight urban real estate.
North America holds a notable share of global revenue, anchored by the NEVI program. Canada prioritizes rural and Indigenous communities through its ZEVIP scheme. South America is nascent, with Brazil offering tax offsets but few direct grants, while Argentina’s macro-economic volatility tempers investor interest. The Middle East records early momentum, with the United Arab Emirates targeting 1,000 fast chargers by 2030 and Saudi Arabia allocating significant investment as part of Vision 2030.
Turkey waives grid-connection fees, yet high import dependence clouds long-term cost. South Africa installs pilot highway units but grapples with load-shedding, necessitating on-site storage or diesel backup. Across regions, renewable PPAs and battery buffers mitigate grid constraints and stabilize site economics for the high-power charger market.

Competitive Landscape
The top five suppliers—ABB, Siemens, Tesla, ChargePoint, Schneider Electric—held a significant share of 2024 revenue, reflecting moderate concentration. Tesla reached the milestone of 60,000 Supercharger stalls by October 2024, and a major share of DC sessions within the United States, while China hosts a fragmented mix led by Huawei Digital Power and Star Charge offering integrated solar-plus-storage packages priced below Western peers.
Chinese integrators, BYD and Zeekr Power, are packaging batteries, inverters, and renewable solutions to reduce capital expenditures, prompting industry giants ABB and Siemens to respond by bundling their SaaS fleet platforms with predictive maintenance services, while competitive advantages are emerging around liquid-cooled 500 kW cables, the ISO 15118-20 Plug & Charge firmware, and vehicle-to-grid inverters.
Meanwhile, smaller European firms, Alpitronic and Kempower, are gaining traction by offering modular cabinets that can be upgraded from 150 kW to 400 kW without needing a complete replacement. This approach enables them to effectively address the unpredictable demand scenarios in the high-power charger market and position themselves as flexible and scalable solution providers in this competitive landscape.
High Power Charger For Electric Vehicle Industry Leaders
ABB Ltd
Tesla, Inc.
Siemens AG
Delta Electronics, Inc.
Tritium Charging
- *Disclaimer: Major Players sorted in no particular order

Recent Industry Developments
- November 2025: BC Hydro announced network-wide rollout of 400 kW ultra-fast chargers across Canada, slicing EV charging times to under 10 minutes.
- October 2025: VNT unveiled India’s first 1 MW charger, enabling multi-vehicle ultra-fast sessions.
- July 2025: EVERTA began building a Bengaluru plant to localize 60-320 kW DC chargers with 50% domestic value addition.
- April 2025: Huawei launched a supercharger exceeding 1.5 MW, branding it as the industry's first fully liquid-cooled solution aimed at heavy trucks.


Global High Power Charger For Electric Vehicle Market Report Scope
| DC Fast Chargers |
| Ultra-Fast Chargers (Above 250 kW) |
| Wireless Chargers |
| Pantograph Chargers |
| 50-150 kW |
| 150-350 kW |
| Above 350 kW |
| Combined Charging System (CCS) |
| CHAdeMO |
| Tesla Supercharger |
| GB/T |
| Type 2 |
| Highway Charging Stations |
| Urban Public Stations |
| Fleet Depots |
| Commercial Buildings |
| Residential Complexes |
| Passenger EVs |
| Commercial EVs (Buses, Trucks) |
| Two-Wheelers |
| Specialty Vehicles |
| Public Charging Operators |
| Private Fleet Owners |
| Government Agencies |
| Residential Users |
| North America | United States |
| Canada | |
| Rest of North America | |
| South America | Brazil |
| Argentina | |
| Rest of South America | |
| Europe | Germany |
| United Kingdom | |
| France | |
| Italy | |
| Spain | |
| Rest of Europe | |
| Asia-Pacific | China |
| India | |
| Japan | |
| South Korea | |
| Rest of Asia-Pacific | |
| Middle East and Africa | United Arab Emirates |
| Saudi Arabia | |
| South Africa | |
| Turkey | |
| Rest of the Middle East and Africa |
| By Charger Type | DC Fast Chargers | |
| Ultra-Fast Chargers (Above 250 kW) | ||
| Wireless Chargers | ||
| Pantograph Chargers | ||
| By Power Output | 50-150 kW | |
| 150-350 kW | ||
| Above 350 kW | ||
| By Connector Type | Combined Charging System (CCS) | |
| CHAdeMO | ||
| Tesla Supercharger | ||
| GB/T | ||
| Type 2 | ||
| By Installation Site | Highway Charging Stations | |
| Urban Public Stations | ||
| Fleet Depots | ||
| Commercial Buildings | ||
| Residential Complexes | ||
| By Vehicle Type | Passenger EVs | |
| Commercial EVs (Buses, Trucks) | ||
| Two-Wheelers | ||
| Specialty Vehicles | ||
| By End User | Public Charging Operators | |
| Private Fleet Owners | ||
| Government Agencies | ||
| Residential Users | ||
| By Geography | North America | United States |
| Canada | ||
| Rest of North America | ||
| South America | Brazil | |
| Argentina | ||
| Rest of South America | ||
| Europe | Germany | |
| United Kingdom | ||
| France | ||
| Italy | ||
| Spain | ||
| Rest of Europe | ||
| Asia-Pacific | China | |
| India | ||
| Japan | ||
| South Korea | ||
| Rest of Asia-Pacific | ||
| Middle East and Africa | United Arab Emirates | |
| Saudi Arabia | ||
| South Africa | ||
| Turkey | ||
| Rest of the Middle East and Africa | ||


Key Questions Answered in the Report
What is the projected value of the high-power charger market in 2031?
The market is expected to reach USD 12.57 billion by 2031.
Which charger type is growing fastest?
Ultra-fast units above 250 kW are increasing at a 22.35% CAGR through 2031.
Why is NACS adoption significant?
Automaker migration to NACS in North America forces operators to install dual-cable hardware and reshapes connector strategy.
Which region leads revenue today?
Asia-Pacific holds 48.60% of global revenue due to expansive Chinese mandates.
Page last updated on:


