Market Overview
| Study Period | 2020 - 2031 |
|---|---|
| Forecast Data Period | 2026 - 2031 |
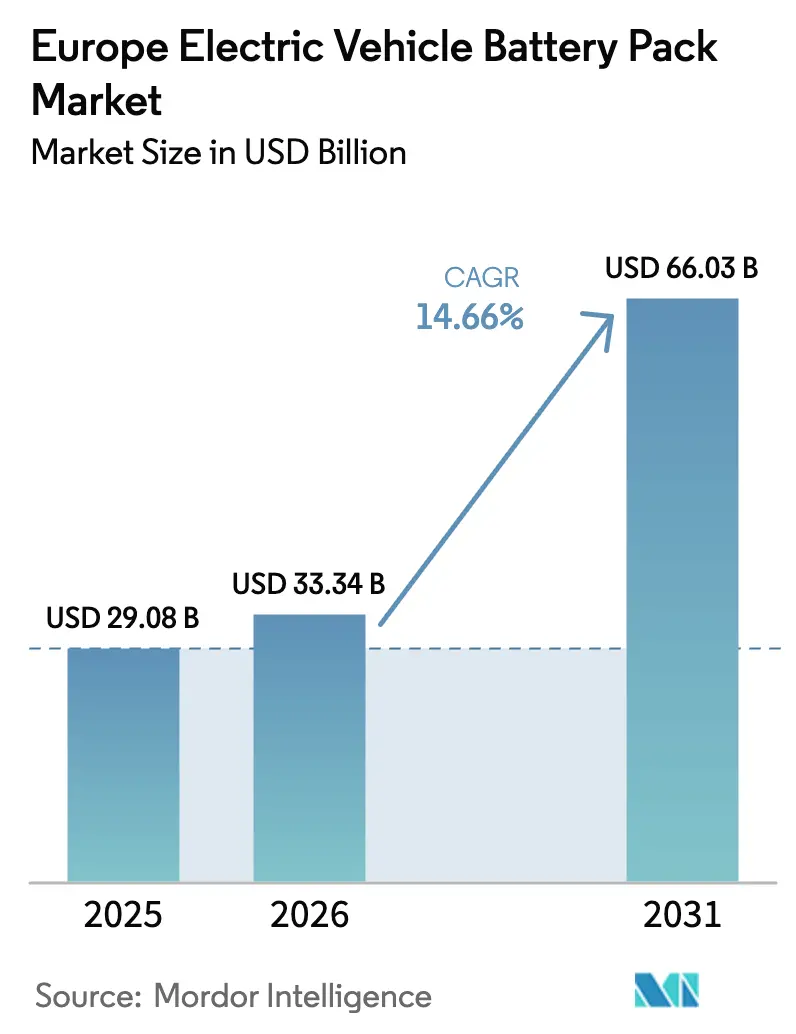
| Base Year Market Size (2025) | USD 29.08 Billion |
| Market Size (2026) | USD 33.34 Billion |
| Market Size (2031) | USD 66.03 Billion |
| Growth Rate (2026 - 2031) | 14.66% CAGR |
| Market Concentration | Medium |
Major Players
*Disclaimer: Major Players sorted in no particular order Image © Mordor Intelligence. Reuse requires attribution under CC BY 4.0. |
|
Europe Electric Vehicle Battery Pack Market Analysis by Mordor Intelligence
The Europe electric vehicle battery pack market size was valued at USD 29.08 billion in 2025 and estimated to grow from USD 33.34 billion in 2026 to reach USD 66.03 billion by 2031, at a CAGR of 14.66% during the forecast period (2026-2031). Growth stems from gigafactory build-outs, carbon-border adjustments that reshape cost curves, and OEM demand for local supply security, all of which reinforce Europe’s push for battery sovereignty. Supply–demand alignment is improving as renewable-powered smelters lower embedded CO₂ and battery-passport rules drive investments in traceability technology. Competitive intensity rises because Asian manufacturers localize production to evade trade barriers, while European firms leverage low-carbon grids to capture premium contracts. Fire-safety insurance premiums and critical-mineral price swings temper short-term momentum, yet solid-state roadmaps continue to attract R&D funding that could redefine performance benchmarks after 2028.
Key Report Takeaways
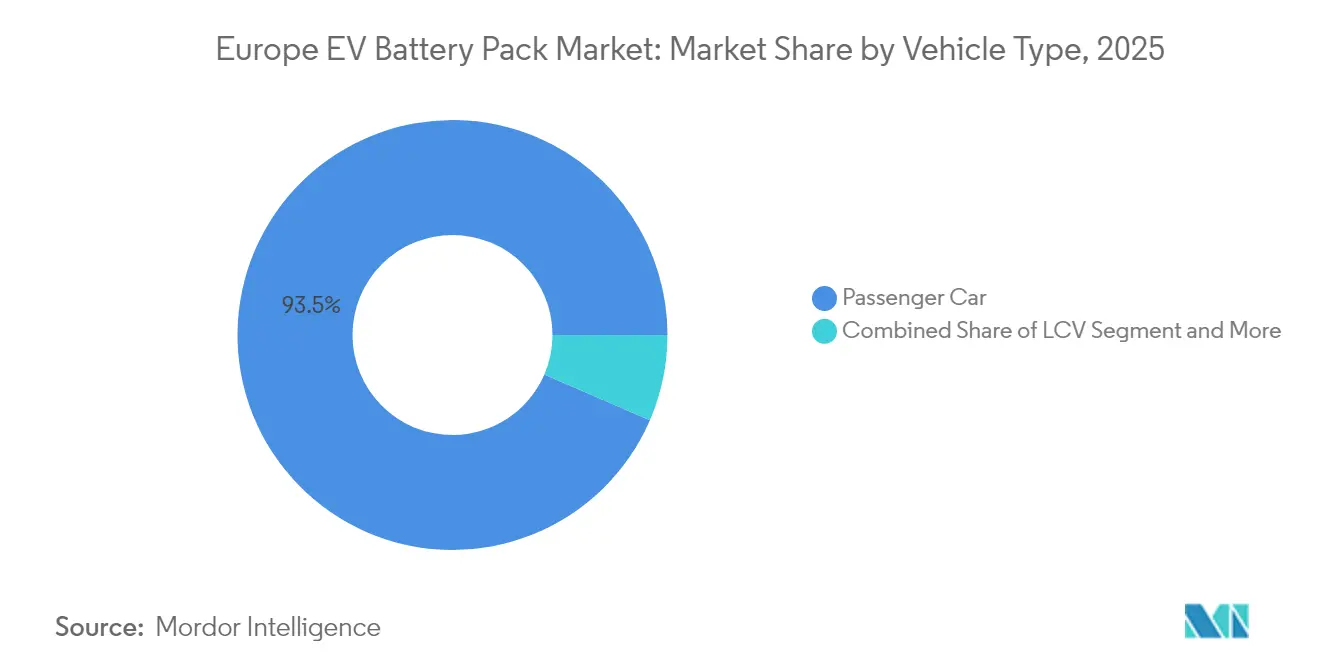
- By vehicle type, passenger cars led with 93.52% of Europe EV battery pack market share in 2025, while medium and heavy-duty trucks are advancing at 16.55% CAGR through 2031.
- By propulsion type, battery electric vehicles accounted for 86.35% share in 2025 and show the fastest growth at 14.86% CAGR.
- By battery chemistry, NMC held 46.62% share in 2025, whereas LMFP is projected to expand at 18.25% CAGR to 2031.
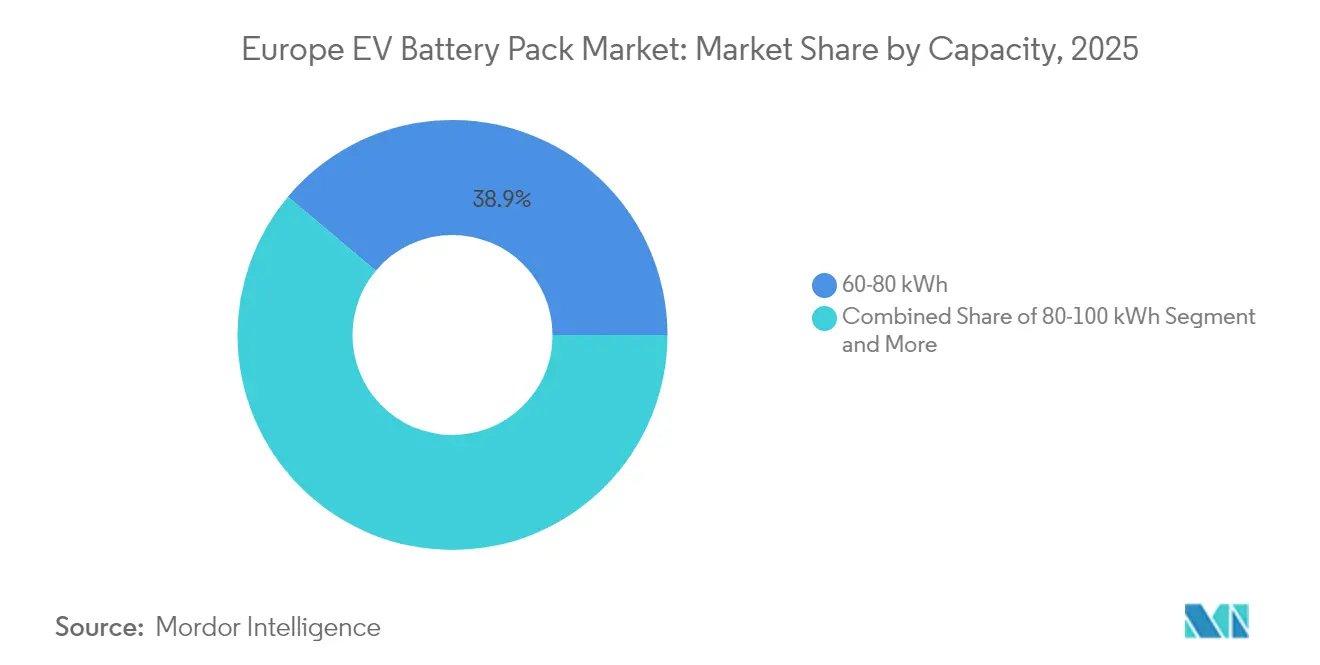
- By capacity, 60–80 kWh packs captured 38.88% of Europe EV battery pack market size in 2025, and 100–150 kWh packs are rising at 15.98% CAGR.
- By battery form, pouch cells accounted for 49.22% share in 2025, while prismatic models will expand with 15.62% CAGR through 2031.
- By voltage class, 400-600 V commanded 57.55% sahre in 2025, while above 800 V segment is projected to expand at 16.78% CAGR to 2031.
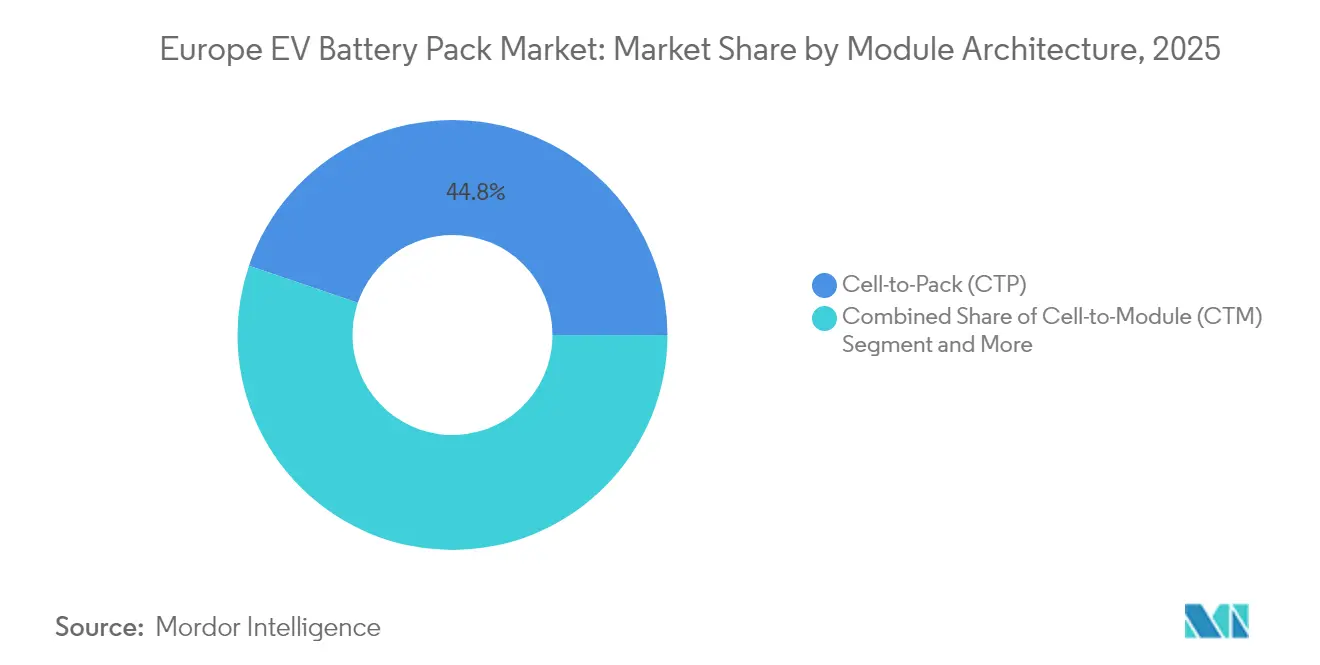
- By module architecture, cell-to-pack models accounted for 44.78% share in 2025, and the same segment is projected to record a 15.21% CAGR by 2031.
- By component, cathode segment captured 68.42% of Europe EV battery pack market size in 2025, while separator models are rising at 15.43% CAGR.
- By country, Germany commanded 41.32% share in 2025, while Hungary records the highest projected CAGR at 40.12% through 2031.
Note: Market size and forecast figures in this report are generated using Mordor Intelligence’s proprietary estimation framework, updated with the latest available data and insights as of 2026.
Europe Electric Vehicle Battery Pack Market Trends and Insights
Drivers Impact Analysis*
| Driver | (~) % Impact on CAGR Forecast | Geographic Relevance | Impact Timeline |
|---|---|---|---|
| Gigafactory Build-out Accelerates | +2.8% | Germany, Hungary, France, Poland | Medium term (2-4 years) |
| Cell-To-Pack Architectures | +2.1% | Global, early gains in Germany, France | Short term (≤ 2 years) |
| EU Carbon-Border Adjustment | +1.9% | EU-wide, strongest in Germany, Italy | Long term (≥ 4 years) |
| Battery-Passport Regulation Boost | +1.4% | EU-wide | Medium term (2-4 years) |
| Renewable-Powered Smelters | +1.2% | Nordic countries, Germany | Long term (≥ 4 years) |
| Solid-State Roadmap Pulls Forward | +0.9% | Germany, France, United Kingdom | Long term (≥ 4 years) |
| Source: Mordor Intelligence | |||


Gigafactory Build-Out Accelerates Supply Security
CATL’s Debrecen plant targets 100 GWh by 2026, while ACC’s tri-national facilities and Verkor’s Dunkirk project diversify supply footprints. Just-in-time delivery reduces OEM inventory costs and mitigates geopolitical disruptions. Local capacity also compresses logistics emissions, helping automakers stay below fleet-average CO₂ ceilings. As a result, the Europe EV battery pack market gains resilience and attracts longer commitments from premium brands seeking reliable, low-carbon inputs.
OEM-Designed Cell-to-Pack Architectures Cut USD/kWh
Eliminating traditional modules trims system costs while boosting energy density. European OEMs follow Tesla's lead, with Stellantis and Volkswagen developing proprietary designs that leverage local suppliers. These architectures align with EN 62660-3 safety standards, which require enhanced thermal management. By controlling pack architecture, automakers gain 18-month development advantages and faster integration of next-generation cells. The Europe EV battery pack market benefits from this innovation as OEMs optimize voltage platforms and cooling systems for European driving patterns and charging infrastructure.
EU Carbon-Border Adjustment Drives Local Sourcing
Starting in 2026, CBAM imposes carbon costs on battery imports, particularly on those from coal-intensive regions. This makes European renewable-powered facilities competitive despite higher labor costs. Chinese manufacturers are accelerating their investments in Europe, with BYD exploring sites in Hungary and Poland. First-mover advantages accrue to companies like Northvolt that integrate renewable energy into production. CBAM compliance requires detailed carbon accounting throughout supply chains, driving investments in traceability technologies that will become mandatory under battery passport regulations.
Battery-Passport Regulation Boosts Traceability Tech
EU battery passport requirements, taking effect in 2027, mandate comprehensive lifecycle tracking for batteries exceeding 2 kWh [1]"Battery Passport Requirements," European Commission, EC.EUROPA.EU. This drives investments in blockchain platforms and digital twin technologies that monitor performance, recycling content, and carbon footprint. Circulor and other software providers secure multi-million-euro contracts with manufacturers seeking compliance solutions. The passport system creates advantages for companies with established recycling operations, as recycled content commands premium pricing. OEMs leverage passport data for predictive maintenance and second-life applications, potentially extending battery economic life by 5–8 years beyond automotive use.
Restraints Impact Analysis*
| Restraint | (~) % Impact on CAGR Forecast | Geographic Relevance | Impact Timeline |
|---|---|---|---|
| Critical-Mineral Price Volatility | -2.3% | Strongest in import-dependent regions | Short term (≤ 2 years) |
| Slow Permitting Anode-Grade Plants | -1.8% | Germany, France, Poland | Medium term (2-4 years) |
| Skilled-Labor Shortages | -1.6% | Germany, France, Eastern Europe | Medium term (2-4 years) |
| Fire-Safety Insurance Premiums | -1.1% | EU-wide | Short term (≤ 2 years) |
| Source: Mordor Intelligence | |||
Critical-Mineral Price Volatility
Lithium carbonate prices swung in 2024, creating procurement challenges for manufacturers with fixed-price OEM contracts. Nickel volatility, worsened by Russian supply disruptions, forces European producers to maintain inventory buffers that tie up working capital. Cobalt supply concentration in the DRC creates geopolitical risks and premium pricing for ethically sourced materials. Battery makers respond by accelerating the adoption of LFP chemistry and developing cobalt-free cathodes, although these alternatives require qualification cycles of 18–24 months. Price hedging strategies become essential, but they also incur material costs through derivative premiums.
Slow Permitting of Anode-Grade Graphite Plants
European facilities capable of producing battery-grade synthetic graphite are significantly fewer compared to those in China. Additionally, the process of obtaining environmental permits for new graphite plants in Germany and France is notably longer than in other regions. This bottleneck forces European battery manufacturers to import the majority of their anode materials, creating supply vulnerabilities and exposing them to CBAM. Imerys' French graphite processing investment represents the most significant European capacity addition, although production is not expected to begin until 2027. REACH regulations require extensive testing for synthetic graphite, adding several months to facility approvals.
*Our forecasts treat driver/restraint impacts as directional, not additive. The impact forecasts reflect baseline growth, mix effects, and variable interactions.
Segment Analysis
By Vehicle Type: Commercial Fleets Drive Electrification
Passenger cars held 93.52% of the Europe EV battery pack market share in 2025, whereas medium and heavy-duty trucks represent the fastest-growing vehicle segment at 16.55% CAGR through 2031. Commercial segment growth is driven by total cost of ownership advantages in urban delivery applications and increasingly stringent emissions regulations in European city centers. Mercedes-Benz eActros and Volvo FH Electric demonstrate long-haul viability with 400+ kWh packs enabling 300-kilometer range . Light commercial vehicles capture growing e-commerce delivery demand, while buses benefit from public transit electrification mandates.
Fleet operators are increasingly opting for leasing models that transfer battery degradation risk to manufacturers, creating opportunities for battery-as-a-service business models. The commercial segment's higher utilization rates justify premium technologies like silicon nanowire anodes, which extend cycle life. Passenger cars continue to dominate the absolute volume due to the scale of the segment, although average pack sizes are stabilizing as charging infrastructure density improves across European markets.


By Propulsion Type: BEV Dominance Accelerates
Battery electric vehicles command 86.35% of the Europe EV battery pack market share in 2025 and maintain the fastest growth at 14.86% CAGR, reflecting consumer preference shifts and regulatory pressure on internal combustion engines. Plug-in hybrid electric vehicles face declining demand as pure electric alternatives achieve price parity and charging infrastructure expands beyond early adopter markets. The BEV segment benefits from simplified powertrains that reduce manufacturing complexity and enable direct sales models pioneered by Tesla and adopted by traditional OEMs.
PHEV applications are increasingly focused on luxury segments, where customers value electric-only urban driving combined with long-distance flexibility. However, regulatory changes in several European countries eliminate PHEV eligibility for purchase incentives and low-emission zone access, accelerating the transition to pure electric architectures. Battery pack designs diverge between segments, with PHEVs requiring smaller, power-dense configurations while BEVs optimize for energy density and fast-charging capabilities.
By Battery Chemistry: LMFP Emerges as Cost Leader
NMC (Lithium Nickel Manganese Cobalt Oxide) held 46.62% of the Europe EV battery pack market share through superior cost economics and thermal stability, whereas Lithium iron manganese phosphate (LMFP) chemistry accelerates at 18.25% CAGR. CATL's Qilin LMFP cells achieve energy densities of approximately 180 Wh/kg, eliminating the need for expensive nickel and cobalt inputs. European OEMs initially resisted LFP adoption due to concerns about cold-weather performance, but improved formulations and thermal management systems now enable year-round operation in Nordic climates.
NMC chemistry maintains leadership in premium segments that require maximum energy density, with 811 formulations achieving over 250 Wh/kg in production applications. Lithium titanate oxide serves niche fast-charging applications despite higher costs, while sodium-ion technologies emerge for stationary storage. The chemistry transition reflects broader industry cost pressures as battery prices approach USD 100 per kWh thresholds, enabling mass market adoption without government subsidies.
By Capacity: High-Energy Packs Gain Traction
Current market leadership belongs to the 60–80 kWh segment with 38.88% market share of Europe EV battery pack in 2025, representing the optimal balance between cost, range, and charging infrastructure compatibility for mainstream passenger vehicles. Larger capacity packs enable WLTP range that addresses consumer range anxiety while supporting fast-charging protocols. The 100–150 kWh capacity segment grows fastest at 15.98% CAGR, driven by premium vehicle applications and commercial fleet requirements for extended range operation.
Smaller capacity segments, below 40 kWh, serve urban mobility applications and entry-level vehicles; however, their market share declines as battery costs decrease and consumer expectations rise. The 80–100 kWh segment captures mid-premium vehicle demand, while packs above 150 kWh target luxury and commercial applications where performance justifies premium pricing. Pack size optimization is increasingly considering charging infrastructure development, with 800V architectures enabling faster charging for larger-capacity systems.
By Battery Form: Prismatic Cells Gain Manufacturing Favor
Pouch cells held 49.22% market share in 2025through superior mechanical stability and thermal management characteristics, whereas prismatic cells is anticipated to be the fastest growth at 15.62% CAGR. The format's rectangular geometry enables efficient pack space utilization and simplified cooling system integration, particularly valuable in commercial vehicle applications with constrained packaging space. European manufacturers prefer prismatic designs due to their compatibility with automated assembly processes and reduced fire propagation risks.
Pouch cells maintain market leadership through their weight advantages and design flexibility, which enable complex pack geometries in passenger vehicles. However, the format requires sophisticated structural support systems that add cost and complexity compared to self-supporting prismatic alternatives. Cylindrical cells serve specialized applications that require high power density, although their market share remains limited in automotive applications.
By Voltage Class: 800V Architecture Drives Innovation
The current market dominance is held by 400-600V systems, which account for a 57.55% share in 2025, reflecting the established infrastructure and component availability across European markets. Above 800V systems represent the fastest-growing voltage class at 16.78% CAGR, enabling ultra-fast charging capabilities that reduce charging times. Higher voltage architectures require specialized components and safety systems that add cost but enable superior performance characteristics.
The 600-800V segment serves premium applications requiring enhanced performance while maintaining compatibility with existing charging infrastructure. Below 400V systems primarily support mild hybrid and small vehicle applications where cost optimization takes priority over charging speed. The voltage class evolution reflects broader industry trends toward faster charging and improved efficiency that reduce the total cost of ownership.
By Module Architecture: Cell-to-Pack Leads Integration
Cell-to-pack (CTP) architecture maintains both market leadership at 44.78% share and fastest growth at 15.21% CAGR, reflecting the technology's cost and performance advantages over traditional module-based designs. The approach eliminates intermediate module housings, reducing part count while improving volumetric energy density through better space utilization. European manufacturers adopt CTP designs to compete with Asian cost leaders while maintaining safety and performance standards.
Cell-to-module architectures serve applications that require modularity and serviceability, particularly in commercial vehicles, where battery replacement economics favor component-level maintenance. Module-to-pack designs offer intermediate solutions that strike a balance between cost optimization and manufacturing flexibility, enabling OEMs to serve multiple vehicle platforms with common module architectures.
By Component: Separator Technology Advances
Cathode materials maintain market dominance with 68.42% share in 2025, reflecting their higher value content and critical role in determining battery performance and cost. Separator components achieve the fastest growth at 15.43% CAGR, driven by advanced ceramic-coated and polymer membrane technologies that enhance safety and performance characteristics. European separator manufacturers like Freudenberg invest heavily in next-generation materials that enable higher voltage operation and improved thermal stability.
Anode materials face supply chain constraints as European graphite processing capacity remains limited, creating opportunities for silicon nanowire and lithium metal alternatives that promise higher energy density. Electrolyte formulations evolve toward solid-state alternatives that eliminate flammability risks while enabling higher energy density operation. The component landscape reflects broader industry trends toward safer, higher-performance materials that support next-generation battery architectures.
Geography Analysis
Germany commands 41.32% Europe EV battery pack market share in 2025, leveraging its established automotive manufacturing ecosystem and skilled workforce to attract significant battery investments from both domestic and international players. The country's battery strategy includes public funding for gigafactory development and research initiatives, with BMW, Mercedes-Benz, and Volkswagen Group establishing dedicated battery facilities. Tesla's Berlin gigafactory showcases the region's appeal to international manufacturers, while CATL's planned facility in Thuringia represents the most significant Asian investment in European battery production. Germany's regulatory framework, as outlined in the Battery Act, provides clear guidelines for manufacturing and recycling, thereby fostering investor confidence in long-term market stability.
France emerges as a strategic battery hub through government-backed initiatives, such as the Automotive Cells Company consortium, which receives public support for its Hauts-de-France facility. Verkor's gigafactory in Dunkirk aims for an annual capacity of 16 GWh by 2025, supported by renewable energy integration that aligns with CBAM requirements . The country's nuclear energy grid provides low-carbon electricity that creates competitive advantages under carbon border adjustment mechanisms. French automotive suppliers like Valeo and Faurecia expand into battery system integration, leveraging existing OEM relationships to capture value-added manufacturing opportunities.
Hungary achieves the fastest growth at 40.12% CAGR, driven by CATL's investment in Debrecen and favorable government incentives that include tax holidays and infrastructure support. The country's central European location provides logistics advantages for serving German and Italian automotive markets while maintaining lower labor costs than Western European alternatives. Poland attracts LG Energy Solution's expansion in Wrocław, while Sweden leverages Northvolt's Skellefteå facility to establish Nordic leadership in sustainable battery production. Italy focuses on recycling and second-life applications through partnerships with energy companies, creating circular economy advantages that support long-term market development. The United Kingdom maintains research leadership and attracts specialized component suppliers despite Brexit-related trade complications.
Competitive Landscape
The European EV battery pack market exhibits moderate concentration, though competitive dynamics shift rapidly as new gigafactory capacity comes online. Asian manufacturers maintain technological and cost advantages through established supply chains and manufacturing scale, prompting European responses through strategic partnerships and government support programs. CATL's European expansion strategy encompasses technology transfer agreements and local hiring initiatives aimed at addressing regulatory concerns while maintaining a competitive edge.
Competitive differentiation is increasingly centered on sustainability credentials, supply chain transparency, and integration capabilities, rather than pure cost competition. European players like Northvolt leverage renewable energy integration and recycling capabilities to command premium pricing from environmentally conscious OEMs. The market structure favors companies capable of providing comprehensive system solutions, including thermal management, battery management systems, and software integration, rather than relying solely on cell suppliers.
Market consolidation accelerates as capital requirements for new entrants increase, with gigafactory investments and requiring 3-5 years from groundbreaking to full-scale production. Vertical integration strategies gain traction as manufacturers seek to control critical material inputs and protect margins against commodity price volatility. Battery pack manufacturers increasingly develop proprietary battery management systems and thermal control technologies that differentiate their offerings beyond basic cell characteristics. The competitive landscape continues evolving as European policy frameworks create advantages for manufacturers investing in sustainable production methods and circular economy business models.
Europe Electric Vehicle Battery Pack Industry Leaders
-
Contemporary Amperex Technology Co., Limited (CATL)
-
LG Energy Solution, Ltd.
-
Samsung SDI Co., Ltd.
-
BMZ Holding GmbH
-
BYD Company Ltd.
- *Disclaimer: Major Players sorted in no particular order


Recent Industry Developments
- September 2025: CATL introduced Shenxing Pro, the world's pioneering lithium iron phosphate battery at its Open Day. Tailored for Europe's e-mobility demands, Shenxing Pro redefines benchmarks in safety, longevity, range, and ultra-fast charging, making it the prime choice for Europe's burgeoning electric vehicle landscape.
- December 2024: Stellantis and CATL inked a deal, pledging an investment of up to EUR 4.1 billion (USD 4.7 billion) to establish a joint venture. This venture aims to construct a state-of-the-art lithium iron phosphate battery facility in Zaragoza, Spain. This advancement will empower Stellantis to deliver a wider range of high-quality, durable, and competitively priced battery-electric vehicles, including passenger cars, crossovers, and SUVs, particularly in the B and C segments with mid-range capabilities.
- July 2024: Ampere, a leading European player in the intelligent EV sector, unveiled a bold strategy. The company is integrating Lithium Iron Phosphate technology into its battery lineup, complementing the Nickel Cobalt Manganese batteries currently utilized by the Renault Group.


Europe Electric Vehicle Battery Pack Market Report Scope
Bus, LCV, M&HDT, Passenger Car are covered as segments by Body Type. BEV, PHEV are covered as segments by Propulsion Type. LFP, NCA, NCM, NMC, Others are covered as segments by Battery Chemistry. 15 kWh to 40 kWh, 40 kWh to 80 kWh, Above 80 kWh, Less than 15 kWh are covered as segments by Capacity. Cylindrical, Pouch, Prismatic are covered as segments by Battery Form. Laser, Wire are covered as segments by Method. Anode, Cathode, Electrolyte, Separator are covered as segments by Component. Cobalt, Lithium, Manganese, Natural Graphite, Nickel are covered as segments by Material Type. France, Germany, Hungary, Italy, Poland, Sweden, UK, Rest-of-Europe are covered as segments by Country.
By Vehicle Type
| Passenger Car |
| LCV (Light Commercial Vehicle) |
| Medium and Heavy-Duty Truck |
| Bus |
By Propulsion Type
| BEV (Battery Electric Vehicle) |
| PHEV (Plug-in Hybrid Electric Vehicle) |
By Battery Chemistry
| LFP (Lithium Iron Phosphate) |
| LMFP (Lithium Manganese Iron Phosphate) |
| NMC (Lithium Nickel Manganese Cobalt Oxide) |
| NCA (Lithium Nickel Cobalt Aluminum Oxide) |
| LTO (Lithium-Titanium-Oxide) |
| Others (LCO, LMO, NMX, Emerging Battery Technologies, etc.) |
By Capacity
| Below 15 kWh |
| 15-40 kWh |
| 40-60 kWh |
| 60-80 kWh |
| 80-100 kWh |
| 100-150 kWh |
| Above 150 kWh |
By Battery Form
| Cylindrical |
| Pouch |
| Prismatic |
By Voltage Class
| Below 400 V (48-350 V) |
| 400-600 V |
| 600-800 V |
| Above 800 V |
By Module Architecture
| Cell-to-Module (CTM) |
| Cell-to-Pack (CTP) |
| Module-to-Pack (MTP) |
By Component
| Anode |
| Cathode |
| Electrolyte |
| Separator |
By Country
| France |
| Germany |
| Hungary |
| Italy |
| Poland |
| Sweden |
| United Kingdom |
| Rest of Europe |
| By Vehicle Type | Passenger Car |
| LCV (Light Commercial Vehicle) | |
| Medium and Heavy-Duty Truck | |
| Bus | |
| By Propulsion Type | BEV (Battery Electric Vehicle) |
| PHEV (Plug-in Hybrid Electric Vehicle) | |
| By Battery Chemistry | LFP (Lithium Iron Phosphate) |
| LMFP (Lithium Manganese Iron Phosphate) | |
| NMC (Lithium Nickel Manganese Cobalt Oxide) | |
| NCA (Lithium Nickel Cobalt Aluminum Oxide) | |
| LTO (Lithium-Titanium-Oxide) | |
| Others (LCO, LMO, NMX, Emerging Battery Technologies, etc.) | |
| By Capacity | Below 15 kWh |
| 15-40 kWh | |
| 40-60 kWh | |
| 60-80 kWh | |
| 80-100 kWh | |
| 100-150 kWh | |
| Above 150 kWh | |
| By Battery Form | Cylindrical |
| Pouch | |
| Prismatic | |
| By Voltage Class | Below 400 V (48-350 V) |
| 400-600 V | |
| 600-800 V | |
| Above 800 V | |
| By Module Architecture | Cell-to-Module (CTM) |
| Cell-to-Pack (CTP) | |
| Module-to-Pack (MTP) | |
| By Component | Anode |
| Cathode | |
| Electrolyte | |
| Separator | |
| By Country | France |
| Germany | |
| Hungary | |
| Italy | |
| Poland | |
| Sweden | |
| United Kingdom | |
| Rest of Europe |


Market Definition
- Battery Chemistry - Various types of battery chemistry considred under this segment include LFP, NCA, NCM, NMC, Others.
- Battery Form - The types of battery forms offered under this segment include Cylindrical, Pouch and Prismatic.
- Body Type - Body types considered under this segment include, passenger cars, LCV (light commercial vehicle), M&HDT (medium & heavy duty trucks)and buses.
- Capacity - Various types of battery capacities inldude under theis segment are 15 kWH to 40 kWH, 40 kWh to 80 kWh, Above 80 kWh and Less than 15 kWh.
- Component - Various components covered under this segment include anode, cathode, electrolyte, separator.
- Material Type - Various material covered under this segment include cobalt, lithium, manganese, natural graphite, nickel, other material.
- Method - The types of method covered under this segment include laser and wire.
- Propulsion Type - Propulsion types considered under this segment include BEV (Battery electric vehicles), PHEV (plug-in hybrid electric vehicle).
- ToC Type - ToC 1
- Vehicle Type - Vehicle type considered under this segment include passenger vehicles, and commercial vehicles with various EV powertrains.
| Keyword | Definition |
|---|---|
| Electric vehicle (EV) | A vehicle which uses one or more electric motors for propulsion. Includes cars, buses, and trucks. This term includes all-electric vehicles or battery electric vehicles and plug-in hybrid electric vehicles. |
| PEV | A plug-in electric vehicle is an electric vehicle that can be externally charged and generally includes all electric vehicles as well as plug-electric vehicles as well as plug-in hybrids. |
| Battery-as-a-Service | A business model in which the battery of an EV can be rented from a service provider or swapped with another battery when it runs out of charge |
| Battery Cell | The basic unit of an electric vehicle's battery pack, typically a lithium-ion cell, that stores electrical energy. |
| Module | A subsection of an EV battery pack, consisting of several cells grouped together, often used to facilitate manufacturing and maintenance. |
| Battery Management System (BMS) | An electronic system that manages a rechargeable battery by protecting the battery from operating outside its safe operating area, monitoring its state, calculating secondary data, reporting data, controlling its environment, and balancing it. |
| Energy Density | A measure of how much energy a battery cell can store in a given volume, usually expressed in watt-hours per liter (Wh/L). |
| Power Density | The rate at which energy can be delivered by the battery, often measured in watts per kilogram (W/kg). |
| Cycle Life | The number of complete charge-discharge cycles a battery can perform before its capacity falls under a specified percentage of its original capacity. |
| State of Charge (SOC) | A measurement, expressed as a percentage, that represents the current level of charge in a battery compared to its capacity. |
| State of Health (SOH) | An indicator of the overall condition of a battery, reflecting its current performance compared to when it was new. |
| Thermal Management System | A system designed to maintain optimal operating temperatures for an EV's battery pack, often using cooling or heating methods. |
| Fast Charging | A method of charging an EV battery at a much faster rate than standard charging, typically requiring specialized charging equipment. |
| Regenerative Braking | A system in electric and hybrid vehicles that recovers energy normally lost during braking and stores it in the battery. |


Research Methodology
Mordor Intelligence follows a four-step methodology in all its reports.
- Step-1: Identify Key Variables: To build a robust forecasting methodology, the variables and factors identified in Step-1 are tested against available historical market numbers. Through an iterative process, the variables required for market forecast are set and the model is built based on these variables.
- Step-2: Build a Market Model: Market-size estimations for the historical and forecast years have been provided in revenue and volume terms. Market revenue is calculated by multiplying the volume demand with volume-weighted average battery pack price (per kWh). Battery pack price estimation and forecast takes into account various factors affecting ASP, such as inflation rates, market demand shifts, production costs, technological developments, and consumer preferences, providing estimations for both historical data and future trends.
- Step-3: Validate and Finalize: In this important step, all market numbers, variables, and analyst calls are validated through an extensive network of primary research experts from the market studied. The respondents are selected across levels and functions to generate a holistic picture of the market studied.
- Step-4: Research Outputs: Syndicated Reports, Custom Consulting Assignments, Databases & Subscription Platforms


