Electric Bus Charging Infrastructure Market Size and Share
Market Overview
| Study Period | 2019 - 2031 |
|---|---|
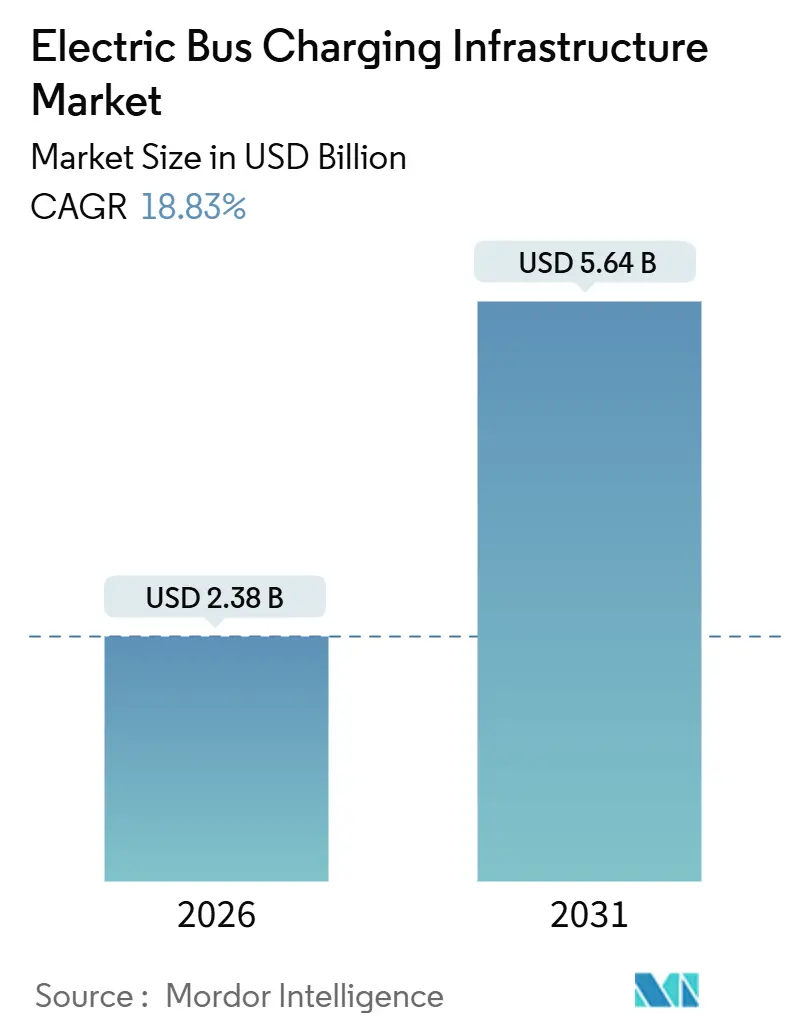
| Market Size (2026) | USD 2.38 Billion |
| Market Size (2031) | USD 5.64 Billion |
| Growth Rate (2026 - 2031) | 18.83% CAGR |
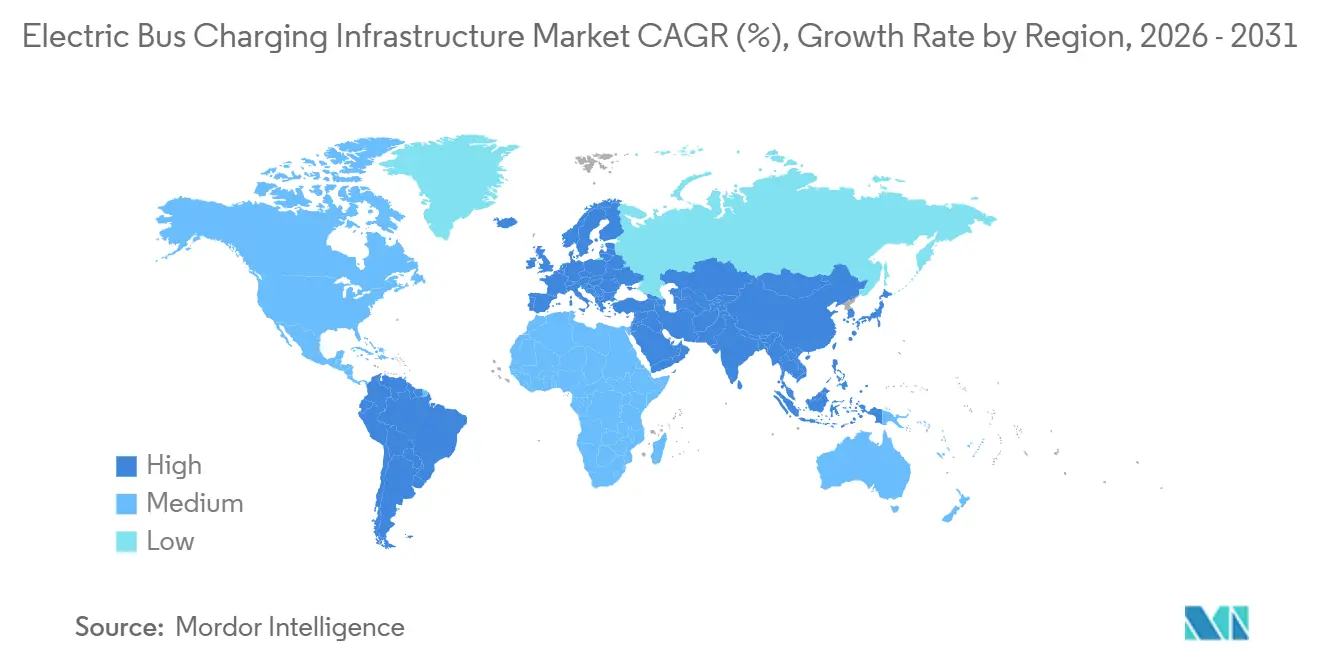
| Fastest Growing Market | Asia Pacific |
| Largest Market | Asia Pacific |
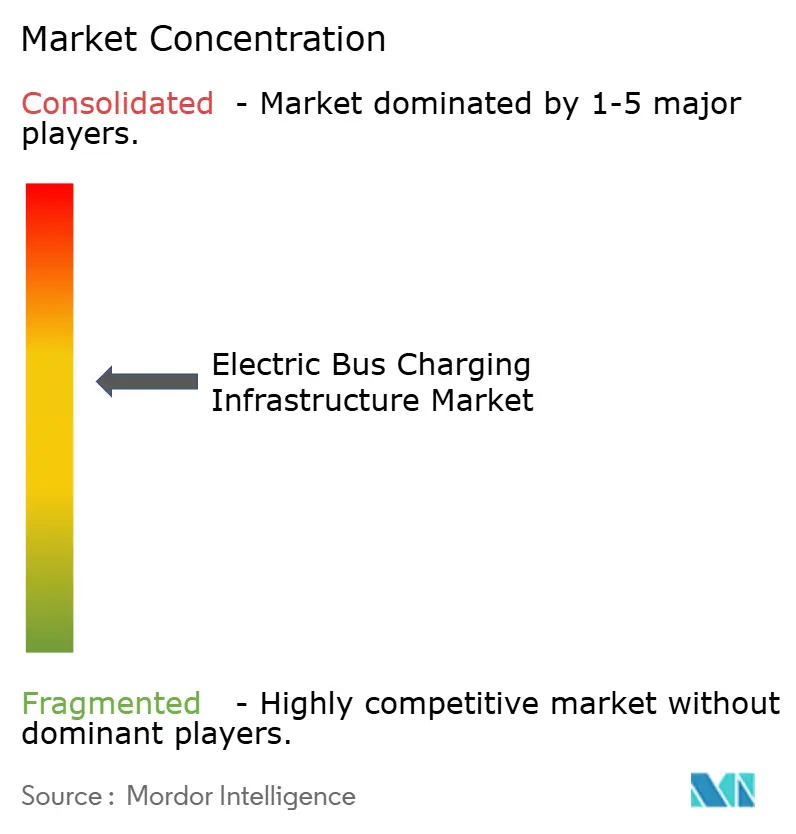
| Market Concentration | Medium |
Major Players
*Disclaimer: Major Players sorted in no particular order Image © Mordor Intelligence. Reuse requires attribution under CC BY 4.0. |
|
Electric Bus Charging Infrastructure Market Analysis by Mordor Intelligence
The electric bus charging infrastructure market size stands at USD 2.38 billion in 2026 and is projected to reach USD 5.64 billion by 2031, reflecting an 18.83% CAGR during the forecast period. Regulatory mandates that lock in zero-emission procurement deadlines, rather than voluntary targets, underpin this growth trajectory. Transit agencies are scaling from pilot deployments to full-fleet rollouts, and they now embed grid-connection planning and smart-charging software in capital budgets from day one. The market’s acceleration is further supported by rapid declines in battery costs, adoption of the Megawatt Charging System standard, and energy-as-a-service financing structures that shift expenditures from capital to operating budgets. Competitive intensity is moderate, with global power-electronics suppliers expanding service portfolios and modular specialists gaining share by lowering upfront costs.
Key Report Takeaways
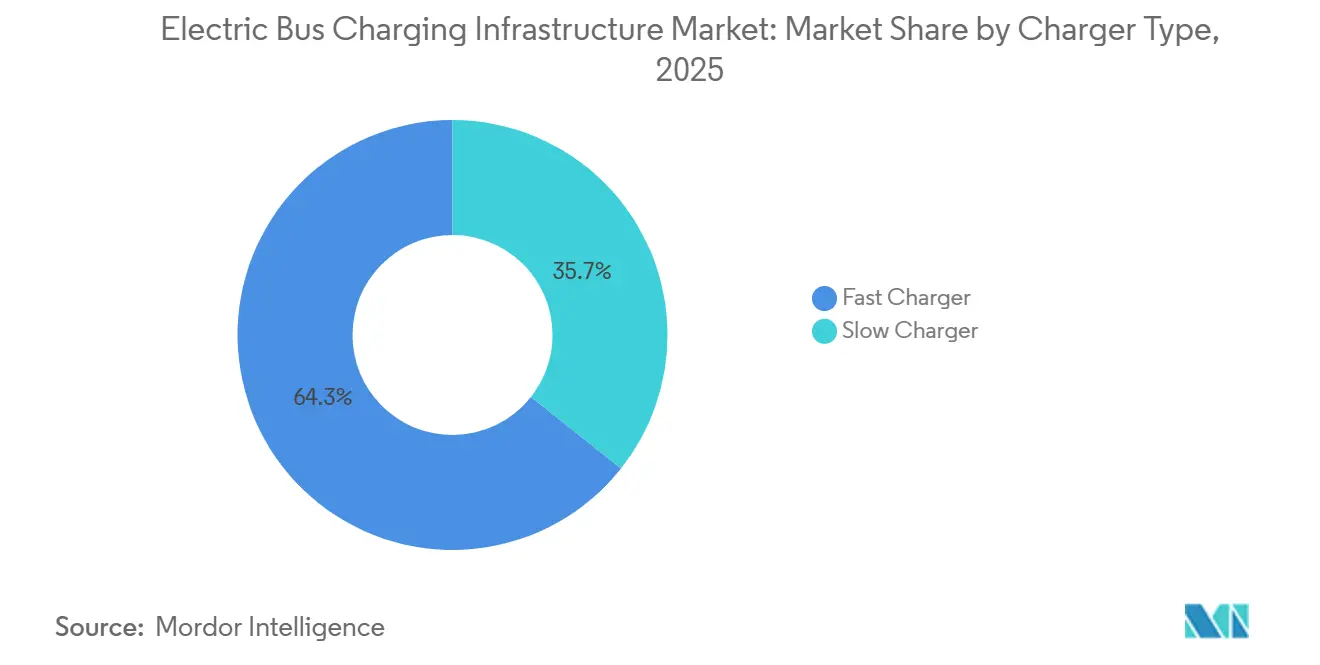
- By charger type, fast chargers captured 64.34% of the electric bus charging infrastructure market share in 2025; slow chargers are forecast to expand at a 15.2% CAGR through 2031.
- By charging type, DC systems commanded 72.51% of the electric bus charging infrastructure market size in 2025, while AC systems are projected to grow at a 12.8% CAGR through 2031.
- By connector type, the Combined Charging System (CCS) interface held 55.15% of the electric bus charging infrastructure market share in 2025; the Megawatt Charging System segment is anticipated to advance at a 24.49% CAGR by 2031.
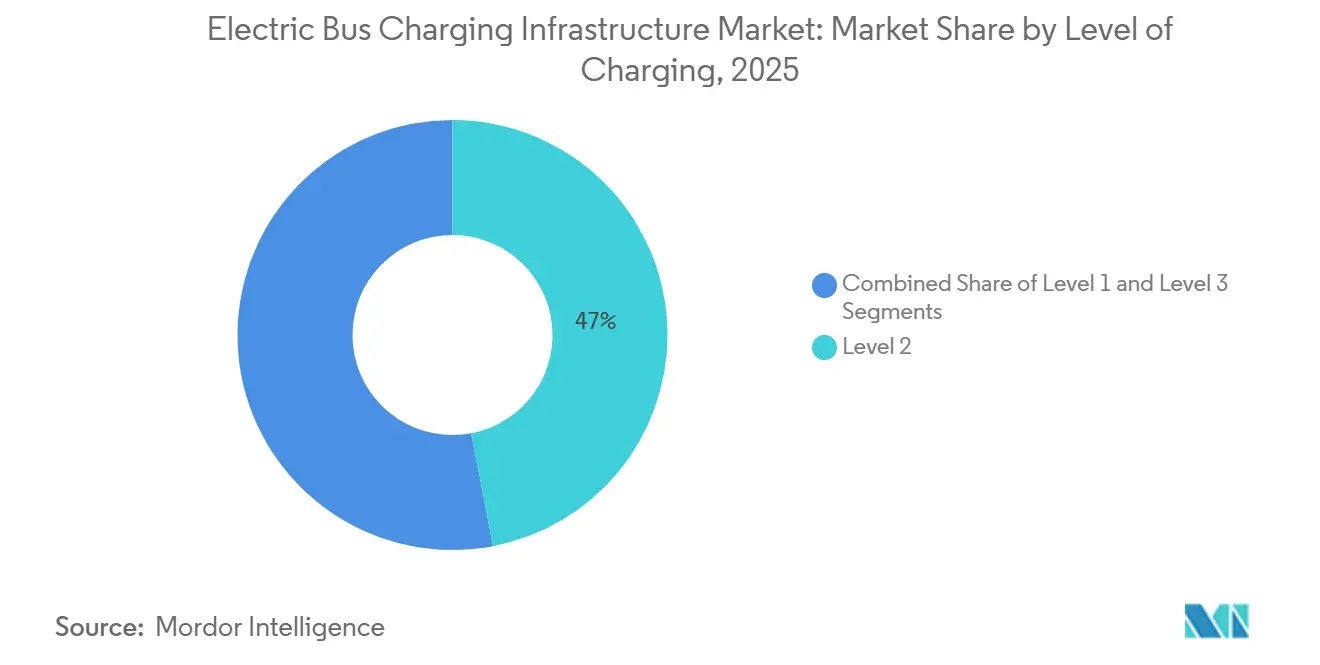
- By level of charging, Level 2 equipment accounted for 46.98% of the electric bus charging infrastructure market size in 2025, whereas Level 3 solutions are set to grow at an 18.99% CAGR through 2031.
- By connectivity, connected stations represented 69.45% of the electric bus charging infrastructure market share in 2025; non-connected units are projected to record a 13.7% CAGR to 2031.
- By geography, Asia-Pacific held 41.87% of the electric bus charging infrastructure market share in 2025 and is set to register the fastest CAGR of 19.81% to 2031.
Note: Market size and forecast figures in this report are generated using Mordor Intelligence’s proprietary estimation framework, updated with the latest available data and insights as of January 2026.
Global Electric Bus Charging Infrastructure Market Trends and Insights
Drivers Impact Analysis*
| Driver | (~)% Impact on CAGR Forecast | Geographic Relevance | Impact Timeline |
|---|---|---|---|
| Zero-Emission Bus Mandates | +4.5% | Global, with early enforcement in California, EU, and China | Medium term (2-4 years) |
| Falling LFP Battery Prices | +3.8% | Global, with manufacturing concentration in China | Short term (≤ 2 years) |
| Megawatt Charging System Standard Finalization | +2.9% | North America & EU, with pilot deployments in APAC | Medium term (2-4 years) |
| Depot Smart-Charging Software | +2.6% | North America & EU, with adoption spreading to APAC | Short term (≤ 2 years) |
| Energy-as-a-Service Financing | +2.2% | Global, with early traction in North America and Western Europe | Medium term (2-4 years) |
| Battery-Swapping Depots | +1.8% | China, with limited adoption in Southeast Asia | Long term (≥ 4 years) |
| Source: Mordor Intelligence | |||
Government Zero-Emission Bus Mandates
Binding purchase requirements introduced in leading regions have eliminated transit agencies' ability to delay electrification. California’s Advanced Clean Fleets rule obliges public operators to buy only zero-emission buses from 2029, with complete fleet compliance by 2040[1]“Advanced Clean Fleets Regulation,” California Air Resources Board, arb.ca.gov. The European Union’s revised Clean Vehicles Directive mandates that 100% of new urban buses be zero-emission by 2035[2]“Clean Vehicles Directive,” European Commission, ec.europa.eu. These synchronized mandates create a predictable demand pipeline, enabling utilities and depot contractors to invest in multi-year infrastructure programs.
Falling LFP Battery Prices Below USD 90/kWh (2025)
Lithium-iron-phosphate pack prices dropped below USD 90 per kilowatt-hour in 2025, sharpening the cost advantage of electric buses over diesel on a total cost of ownership basis. More miniature battery packs now suffice for regular duty cycles, which in turn lowers peak charging power requirements and reduces the number of high-capacity chargers per depot. The price trend supports wider adoption by medium-sized agencies in emerging markets that previously faced capital constraints. Operators can now pair 150-kilowatt fast chargers with 250-kilowatt-hour packs and still maintain route flexibility, shortening payback periods to under seven years when fuel and maintenance savings are considered.
Megawatt Charging System Standard Finalization (2024)
CharIN’s publication of the Megawatt Charging System (MCS) specification in June 2024 unified the heavy-duty charging protocol and removed a critical technical uncertainty. The framework, later adopted as SAE J3271, supports up to 3.75 megawatts and 1,250 volts, enabling a 15-minute turnaround for buses with 400–500 kilowatt-hour batteries[3]"J3271: SAE Megawatt Charging System for Electric Vehicles," SAE International, www.sae.org . With a clear roadmap, manufacturers have accelerated connector integration, and transit agencies can include MCS compliance in tender documents without risking vendor lock-in. Early depot deployments in Europe demonstrate reduced dwell times and improved vehicle utilization, especially for articulated and intercity coach fleets that require frequent top-ups during layovers.
Depot Smart-Charging Software Cuts Demand Fees 25–40%
Fleet-wide charging orchestration platforms use real-time electricity pricing and utility demand thresholds to optimize load profiles. By shifting bulk charging to off-peak periods, agencies reduce monthly demand charges, which often comprise up to 60% of total electric costs. Software also increases equipment utilization, enabling dynamic power sharing among dispensers and reducing the number of installed cabinets per site. Participation in demand-response programs or frequency regulation markets generates new revenue streams that offset infrastructure capital expenditures.
Restraints Impact Analysis*
| Restraint | (~)% Impact on CAGR Forecast | Geographic Relevance | Impact Timeline |
|---|---|---|---|
| Depot Grid-Connection Lead Times | -2.4% | North America & EU, with acute delays in metropolitan areas | Medium term (2-4 years) |
| Urban Land Scarcity | -1.6% | APAC core (China, India), with spillover to dense European cities | Long term (≥ 4 years) |
| Pantograph Interoperability Gaps | -1.2% | Global, with regional standard fragmentation | Medium term (2-4 years) |
| Certified HV Installer Shortage | -0.9% | North America & EU, with training pipeline gaps | Short term (≤ 2 years) |
| Source: Mordor Intelligence | |||
Depot Grid-Connection Lead Times ≥24 Months
Utility interconnection queues for multi-megawatt depot charging sites have extended to 24 to 36 months in major metropolitan areas, creating a critical bottleneck that delays fleet electrification timelines and forces transit agencies to phase bus procurements. Transit agencies must therefore secure grid connections 2 to 3 years before planned bus deliveries, which complicates procurement processes and increases project risk. Some regions offer expedited pathways for transit electrification projects, but geographical coverage remains limited and heavily oversubscribed.
Urban Land Scarcity for ≥1 MW Substations
Dense urban environments, where electric bus adoption is concentrated due to air quality mandates, face acute land availability constraints for depot charging infrastructure that requires 1 to 3 megawatts of transformer capacity and associated switchgear. The constraint is particularly acute in historic city centers where building codes restrict substation placement near residential areas, forcing transit agencies to consolidate charging at peripheral depots and extend deadhead distances. The challenge pushes agencies to consolidate charging at peripheral depots, inadvertently increasing deadhead mileage and energy consumption.
*Our forecasts treat driver/restraint impacts as directional, not additive. The impact forecasts reflect baseline growth, mix effects, and variable interactions.
Segment Analysis
By Charger Type: Fast Chargers Dominate Fleet Turnaround
Fast chargers held 64.34% of the electric bus charging infrastructure market share in 2025, fueled by agencies that require mid-day top-ups to keep buses on schedule. The segment is projected to advance at a 20.55% CAGR through 2031. Fast-charging hardware, rated at 150–350 kilowatts, enables 80% state of charge in under 60 minutes, allowing vehicles to perform two or three complete cycles per shift. Depot operators optimize capital expenditures by pairing a limited number of fast chargers with a larger pool of slow units dedicated to overnight replenishment.
The economics of fast charging have improved as commercial battery cycle life has extended beyond 4,000 full-equivalent cycles, mitigating concerns about degradation. Bus rapid transit systems benefit most from fast charging, as terminal dwell times of 10–15 minutes accommodate automated pantograph connections that maintain tight headways. Slow chargers, while secondary, still appeal to fleets with generous dwell periods and lower daily mileage.


By Charging Type: DC Systems Capture Heavy-Duty Segment
DC equipment accounted for 72.51% of the electric bus charging infrastructure market size in 2025 and is projected to post a 22.38% CAGR to 2031, reflecting agencies’ preference for sub-two-hour turnarounds that keep vehicles on the road. Operators value conversion efficiencies near 95%, which trim energy losses and lower operating expenses. Liquid-cooled cables and sealed cabinets allow continuous high-power delivery even when ambient temperatures exceed 40 °C, preventing thermal derating during summer peaks. Modular architectures let depots start with 150-kilowatt cabinets and add power blocks to reach 600 kilowatts as fleet size grows, so early investments never become stranded.
AC chargers keep a niche where fleets are small, routes are short, and grid upgrades are cost-prohibitive. Units rated 22–43 kilowatts cost significantly less than comparable DC systems, allowing agencies to electrify a five-bus garage for roughly the price of one 350-kilowatt DC dispenser. Existing three-phase wiring, often installed for maintenance workshops, can be reused with minimal modification, shortening project timelines by several months. AC ports also serve as redundancy when DC dispensers undergo maintenance, ensuring buses can still depart on schedule.
By Connector Type: CCS Leads, MCS Gains Traction
The Combined Charging System interface secured 55.15% electric bus charging infrastructure market share in 2025, becoming the default option across Europe and North America. It combines AC and DC pins in one housing, simplifying depot layouts and vehicle design. Backward compatibility with earlier CCS revisions shields agencies from obsolescence risk as power levels rise. This stability supports steady replacement demand during fleet renewal cycles.
The Megawatt Charging System, grouped under “Others,” is forecast to grow at a 24.49% CAGR through 2031 as articulated buses and intercity coaches adopt 1-megawatt-plus charging. Adapter cables now allow CCS vehicles temporary access to MCS dispensers, smoothing the transition. CHAdeMO’s share is limited to legacy fleets in Japan and select Asian markets and is expected to decline. Pantograph connectors address high-frequency routes but face interoperability gaps between regional variants.
By Level of Charging: Level 2 Anchors Depot, Level 3 Expands En-Route
Level 2 infrastructure accounted for 46.98% of the electric bus charging infrastructure market share in 2025 and remains the backbone of overnight charging strategies. Power ranges from 19.2 to 43 kilowatts, which aligns well with six- to ten-hour dwell periods when buses are out of service. Extended charging windows also let operators take advantage of off-peak tariffs that can reduce electricity bills by up to 40%, improving the total cost of ownership. The segment is forecast to grow at a robust CAGR to 2031, buoyed by mid-sized agencies that run fewer than 100 buses and prioritize low upfront investment while retaining scheduling flexibility.
Level 3 solutions, covering plug-in and pantograph systems rated 50–600 kilowatts, will climb at an 18.99% CAGR as agencies adopt hybrid charging models that blend depot and en-route top-ups. Automated connectors reduce driver workload and shorten terminal dwell times to single-digit minutes on bus rapid transit lines, enabling headways below five minutes. Higher power eliminates the need for oversized battery packs, thereby lowering vehicle curb weight and acquisition cost. Depots typically install a limited number of Level 3 dispensers for quick-turn vehicles, then rely on a larger fleet of Level 2 units for the bulk of overnight energy demand, striking a balance between capital efficiency and operational resilience.

By Connectivity: Connected Stations Enable Grid Services
Connected stations commanded 69.45% of the electric bus charging infrastructure market share in 2025, supported by cloud platforms that optimize load profiles and enable demand-response revenue. Real-time telemetry supports predictive maintenance, slashing unplanned downtime and warranty costs. Utilities increasingly tie discounted time-of-use rates to networked chargers, boosting return on investment. These factors underpin a 21.12% CAGR forecast through 2031.
Non-connected stations retain a 30.55% share when cellular coverage is weak or when cybersecurity policies restrict external data transfer. They cost roughly 15–20% less than networked models by omitting communication hardware and subscription fees. Manual inspections, however, raise operational workload and limit participation in utility incentive programs. Despite these drawbacks, the segment is still expected to post a robust CAGR as entry-level fleets electrify in rural regions.
Geography Analysis
Asia-Pacific accounted for 41.87% of the electric bus charging infrastructure market share in 2025 and is projected to expand at a 19.81% CAGR through 2031. China’s directive to achieve full electric bus penetration in provincial capitals by 2027 is driving rapid depot construction and grid reinforcement. Indian tenders bundle multi-year charging services, transferring capital risk and accelerating private participation. Japan and South Korea offer targeted subsidies to bring regional operators into the electrification fold, while battery-swapping pilots in China test ultra-high utilization models.
South America is forecasted to grow at an 18.22% CAGR, anchored by Brazil’s São Paulo commitment to electrify over 2,600 buses by 2028 under public-private financing structures. Chile’s capital integrates solar arrays with depot chargers to hedge against grid volatility, and Colombia’s Bogotá system schedules 120 fast chargers across terminal stations to support phased vehicle deployment. Western Asia, led by Saudi Arabia’s 1,000-bus tender, is expected to expand at a 17.98% CAGR as part of broader diversification initiatives.
North America and Europe anticipate CAGRs of 13.88% and 13.55% respectively, tempered by 24–36-month grid-connection lead times. California’s mandate to purchase zero-emission buses from 2029 brings over 200 transit agencies into the procurement cycle. The European Union’s binding 2035 zero-emission target underpins multi-billion-euro subsidy programs. Both regions invest in streamlined permit processes and pre-approved substation upgrades to alleviate interconnection bottlenecks.

Competitive Landscape
The market remains moderately fragmented. Large electrical-equipment companies leverage global service networks to secure multi-year framework agreements that encompass hardware, installation, and software. ABB’s integrated platform pairs chargers with cloud-based energy management, improving load balancing and enabling demand-response participation. Siemens bundles pantograph hardware with predictive maintenance analytics.
Heliox concentrates on rapid-deployment projects for bus rapid transit corridors. Specialists such as Kempower and TGOOD gain share through modular DC architectures that allow phased investment and easy configuration changes. The rise of the Megawatt Charging System is expected to commoditize ultra-fast hardware by 2026, shifting competitive advantage toward ecosystem integration and value-added services.
Battery-swapping entrants test alternative business models that decouple route planning from charging dwell times, potentially reshaping long-haul coach operations if scale economies materialize. Energy-as-a-service contracts convert capital outlays into predictable operating fees, favoring providers with strong balance sheets and utility partnerships. Competitive differentiation increasingly rests on software capabilities, including predictive maintenance, vehicle-to-grid functionality, and carbon reporting dashboards.
Electric Bus Charging Infrastructure Industry Leaders
-
ABB Ltd
-
ChargePoint Inc.
-
Siemens AG
-
BYD Auto Co. Ltd
-
Proterra Inc.
- *Disclaimer: Major Players sorted in no particular order

Recent Industry Developments
- November 2025: Highway Infra received a contract worth INR 10.9 million to develop electric bus charging infrastructure across multiple depots in India.
- October 2025: Daimler Buses announced plans to install public charging stations for coaches at major European tourist destinations from 2026.
- October 2025: BasiGo launched three new charging depots in Nairobi, integrating a service and customer excellence center for CATL battery maintenance.
- June 2025: Kempower and partners began constructing a Perth depot with charging capacity for 132 buses, set to enter service in mid-2026.


Global Electric Bus Charging Infrastructure Market Report Scope
Electric bus charging infrastructure is specifically designed for charging electric buses. Onboard batteries, a hydrogen fuel cell, overhead wires (as in a trolleybus application), or ground-based non-contact conductors can be used as the power source.
The electric bus charging infrastructure market is segmented by charger type, charging type, charging level, connectivity, and geography. By charger type, the market is segmented into slow chargers and fast chargers. By charging type, the market is segmented into AC charging and DC charging. By connector type, the market is segmented into CHAdeMO, combined charging system (CCS), and Others. By charging level, the market is segmented into level 1, level 2, and level 3. By connectivity, the market is segmented into non-connected stations and connected stations. By geography, the market is segmented into North America, South America, Europe, Asia-Pacific, and the Middle East and Africa. The market forecasts are provided in terms of value (USD).
| Slow Charger |
| Fast Charger |
| AC Charging |
| DC Charging |
| CHAdeMO |
| Combined Charging System (CCS) |
| Others |
| Level 1 |
| Level 2 |
| Level 3 |
| Non-connected Stations |
| Connected Stations |
| North America | United States |
| Canada | |
| Rest of North America | |
| South America | Brazil |
| Argentina | |
| Rest of South America | |
| Europe | United Kingdom |
| Germany | |
| Spain | |
| Italy | |
| France | |
| Russia | |
| Rest of Europe | |
| Asia-Pacific | India |
| China | |
| Japan | |
| South Korea | |
| Rest of Asia-Pacific | |
| Middle East and Africa | United Arab Emirates |
| Saudi Arabia | |
| Turkey | |
| Egypt | |
| South Africa | |
| Rest of Middle-East and Africa |
| By Charger Type | Slow Charger | |
| Fast Charger | ||
| By Charging Type | AC Charging | |
| DC Charging | ||
| By Connector Type | CHAdeMO | |
| Combined Charging System (CCS) | ||
| Others | ||
| By Level of Charging | Level 1 | |
| Level 2 | ||
| Level 3 | ||
| By Connectivity | Non-connected Stations | |
| Connected Stations | ||
| By Geography | North America | United States |
| Canada | ||
| Rest of North America | ||
| South America | Brazil | |
| Argentina | ||
| Rest of South America | ||
| Europe | United Kingdom | |
| Germany | ||
| Spain | ||
| Italy | ||
| France | ||
| Russia | ||
| Rest of Europe | ||
| Asia-Pacific | India | |
| China | ||
| Japan | ||
| South Korea | ||
| Rest of Asia-Pacific | ||
| Middle East and Africa | United Arab Emirates | |
| Saudi Arabia | ||
| Turkey | ||
| Egypt | ||
| South Africa | ||
| Rest of Middle-East and Africa | ||


Key Questions Answered in the Report
How large is the electric bus charging infrastructure market in 2025?
It is valued at USD 2.38 billion, with expectations to reach USD 5.64 billion by 2031.
What is driving the rapid adoption of fast chargers in transit depots?
Agencies favor route flexibility, and fast chargers enable 80% battery replenishment within 90 minutes while supporting multiple daily cycles.
Why are grid-connection timelines considered a major restraint?
In many cities, securing multi-megawatt capacity takes 24–36 months, delaying bus deliveries and inflating project costs.
Which connector standard is poised for the fastest growth?
The Megawatt Charging System segment is forecast to record a 24.49% CAGR through 2031 as fleets adopt ultra-fast charging.
How does energy-as-a-service financing benefit transit agencies?
It shifts large upfront investments to predictable operating expenses, bundling hardware, installation, and maintenance under long-term contracts.
Which region holds the largest share of installed bus chargers?
Asia-Pacific leads with 41.87% share, driven by binding provincial mandates and large-scale fleet tenders.
Page last updated on:


