Market Overview
| Study Period | 2018 - 2031 |
|---|---|
| Forecast Data Period | 2026 - 2031 |
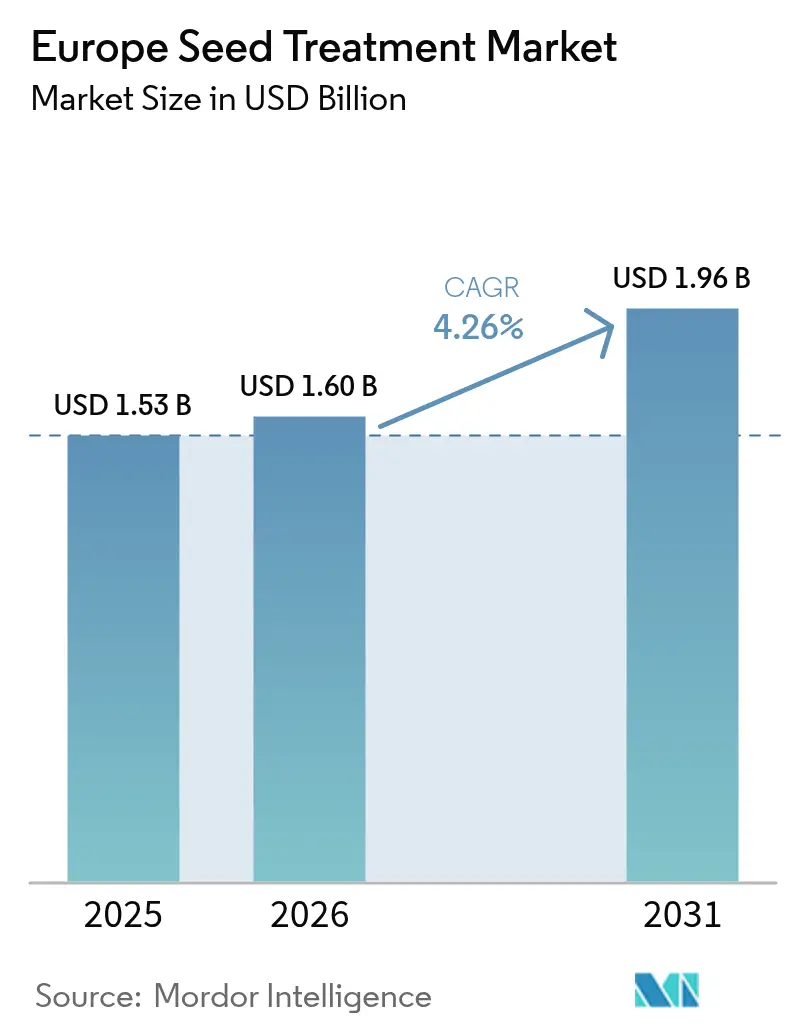
| Base Year Market Size (2025) | USD 1.53 Billion |
| Market Size (2026) | USD 1.6 Billion |
| Market Size (2031) | USD 1.96 Billion |
| Growth Rate (2026 - 2031) | 4.26% CAGR |
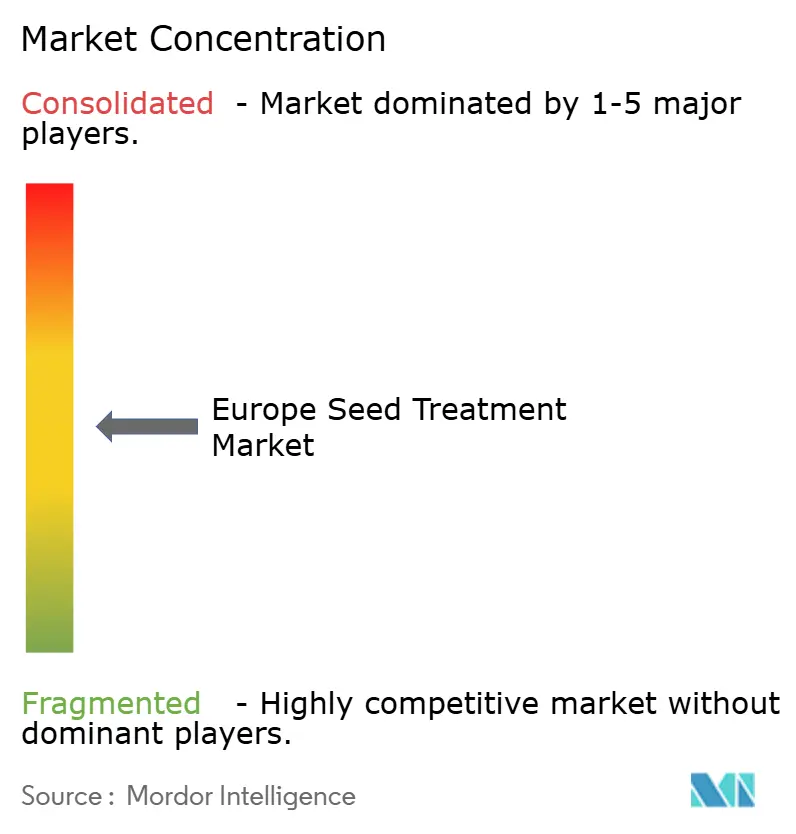
| Market Concentration | Medium |
Major Players *Disclaimer: Major Players sorted in no particular order Image © Mordor Intelligence. Reuse requires attribution under CC BY 4.0. | |
Europe Seed Treatment Market Analysis by Mordor Intelligence
The Europe seed treatment market size in 2026 is estimated at USD 1.6 billion, growing from 2025 value of USD 1.53 billion with 2031 projections showing USD 1.96 billion, growing at 4.26% CAGR over 2026-2031. Rising regulatory pressure combined with a rapid pivot toward biological coatings underscores the resilience of the Europe seed treatment market. Farmers are expanding treated cereal acreage, adopting carbon-linked biostimulants, and integrating digital prescription-seeding platforms that optimize cost and efficacy. Germany’s precision farming ecosystem, France’s modernization investments, and expanding urban landscaping across Southern Europe further reinforce demand. At the same time, tighter residue limits for synthetic actives and divergent post-Brexit rules are reshaping competitive strategies across the value chain.
Key Report Takeaways
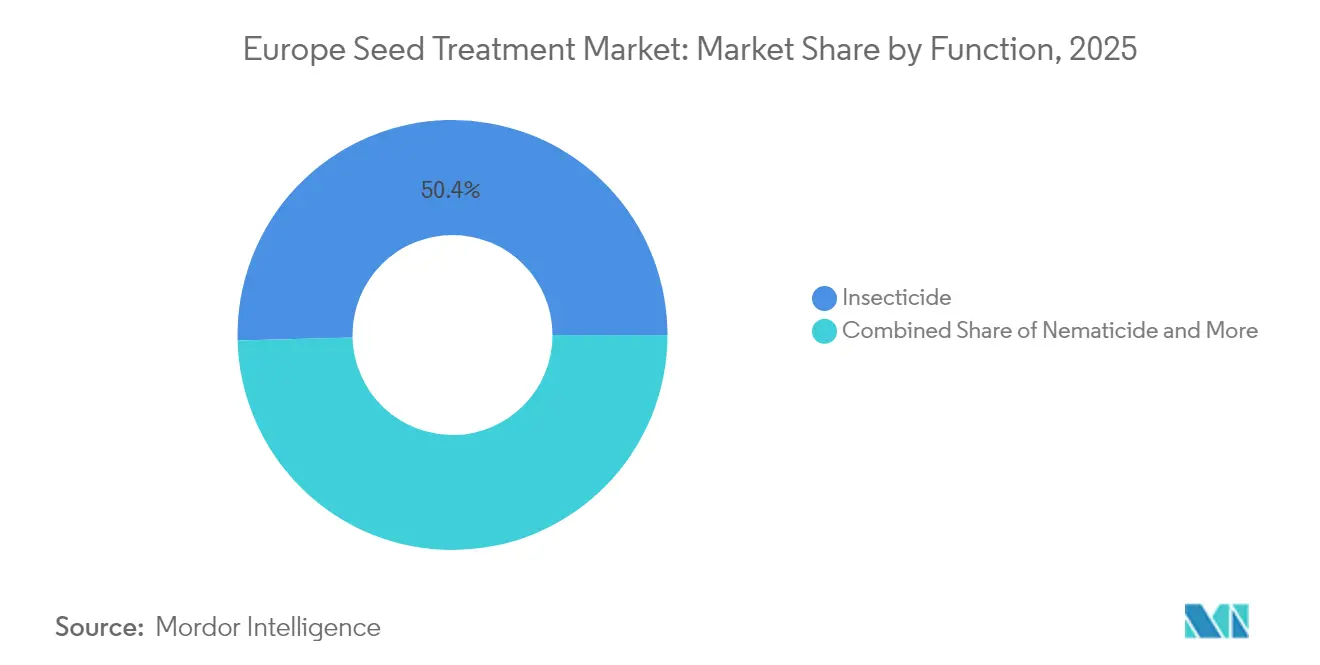
- By function, insecticides held 50.40% of Europe seed treatment market share in 2025, and the same segment has registered the fastest growth at a 4.7% CAGR through 2031.
- By crop type, grains and cereals accounted for 59.10% of the Europe seed treatment market size in 2025, and turf and ornamental applications are projected to expand at a 4.37% CAGR to 2031.
- By geography, Germany led with 28.60% revenue share of the Europe seed treatment market size in 2025, whereas France is forecast to post the highest 6.12% CAGR through 2031.
Note: Market size and forecast figures in this report are generated using Mordor Intelligence’s proprietary estimation framework, updated with the latest available data and insights as of 2026.
Europe Seed Treatment Market Trends and Insights
Drivers Impact Analysis*
| Driver | (~) % Impact on CAGR Forecast | Geographic Relevance | Impact Timeline |
|---|---|---|---|
| Surge in cereal acreage treated with biological coats | +0.8% | Germany, France, and Poland | Medium term (2-4 years) |
| EU ban on neonicotinoids accelerating fungicidal sales | +0.9% | EU-27 excluding United Kingdom | Short term (≤ 2 years) |
| Carbon-credit revenue streams for seed-applied biostimulants | +0.4% | Western Europe, Nordic countries | Long term (≥ 4 years) |
| Digital prescription-seeding platforms boosting adoption | +0.3% | Netherlands, Denmark, and Germany | Medium term (2-4 years) |
| Micro-encapsulation technology extending shelf life | +0.5% | Global, EU manufacturing hubs | Long term (≥ 4 years) |
| Rise of antimicrobial resistance genes in soils | +0.6% | Mediterranean Europe, and Eastern Europe | Medium term (2-4 years) |
| Source: Mordor Intelligence | |||
Surge in Cereal Acreage Treated with Biological Coats
Cereal growers are replacing banned synthetics with biological alternatives, pushing treated cereal acreage up 23% each year. Field trials in Germany and France show wheat and barley yield retention of 94-97% after the switch, confirming agronomic viability under the European Commission Farm to Fork Strategy.[1]Source: European Food Safety Authority, “Neonicotinoids and Their Impact on European Agriculture,” EFSA Journal, efsa.europa.eu Biological suppliers now collaborate with cooperatives to streamline product verification and distribution, reinforcing momentum across major grain belts.
EU Ban on Neonicotinoids Accelerating Fungicidal Sales
The continent-wide prohibition on neonicotinoid insecticides triggered an immediate pivot to fungicidal protocols, particularly in sugar beet and oilseed rape systems. Fungicide expenditures now capture 60-70% of total seed protection costs versus 35-40% before the ban.[2]Source: Agence Nationale de Sécurité Sanitaire, “Interdiction des Néonicotinoïdes, Impact sur l’Agriculture Française,” anses.fr This structural change fuels innovation in multi-site fungicides and encourages bundled biological-synthetic packages that maintain efficacy within new residue thresholds.
Carbon-Credit Revenue Streams for Seed-Applied Biostimulants
European carbon markets have begun awarding credits for seed-applied biostimulants that enhance soil carbon sequestration. Early adopters in France and Germany receive EUR 25-35 per hectare (USD 27-38 per hectare) in verified credit income, improving treatment return on investment by up to 25%. This mechanism transforms seed treatment economics from a cost center to a potential revenue line, accelerating biological uptake.
Digital Prescription-Seeding Platforms Boosting Adoption
Satellite imagery, soil sensors, and cloud analytics allow variable-rate treatment prescriptions that cut input costs 12-18% while maintaining pest control. Thirty-four percent of Dutch farms, 28% of Danish farms, and 22% of German farms already operate such platforms, demonstrating alignment with EU precision agriculture objectives.[3]Source: European Space Agency, “Copernicus Services for Precision Agriculture,” esa.int Technology vendors integrate real-time agronomic data to calibrate coating dosage, driving incremental penetration of premium formulations.
Restraints Impact Analysis*
| Restraint | (~) % Impact on CAGR Forecast | Geographic Relevance | Impact Timeline |
|---|---|---|---|
| Tightened maximum residue limits for thiram and metalaxyl | -0.7% | EU-27, Switzerland, Norway | Short term (≤ 2 years) |
| High capital cost of multi-layer film-coat machinery | -0.4% | Regional manufacturing hubs | Medium term (2-4 years) |
| Brexit-driven regulatory misalignment | -0.3% | United Kingdom, Ireland, Northern EU | Long term (≥ 4 years) |
| Climate-policy fertilizer cuts reducing treatment ROI | -0.5% | Netherlands, Denmark, Germany | Medium term (2-4 years) |
| Source: Mordor Intelligence | |||
Tightened Maximum-Residue Limits for Thiram and Metalaxyl
European regulators have implemented significantly stricter maximum residue limits for thiram and metalaxyl, two cornerstone fungicidal active ingredients, forcing reformulation of established seed treatment products and creating market access barriers. The new limits, reduced by 60-80% from previous thresholds, effectively eliminate many existing formulations from commercial use and require extensive re-registration processes that can take 18-24 months to complete.
High Capital Cost of Multi-Layer Film-Coat Machinery
The shift toward sophisticated seed treatment formulations requiring multi-layer application processes demands specialized coating equipment with capital costs ranging from EUR 2-5 million (USD 2.2-5.5 million) per production line, creating barriers for smaller manufacturers and custom applicators. These advanced systems, necessary for biological-synthetic hybrid treatments and controlled-release formulations, require significant upfront investment that many regional players cannot justify given the uncertain regulatory environments.
*Our forecasts treat driver/restraint impacts as directional, not additive. The impact forecasts reflect baseline growth, mix effects, and variable interactions.
Segment Analysis
By Function: Insecticides remain dominant amid regulatory headwinds
In 2025, insecticides captured 50.40% of Europe seed treatment market share, supported by non-neonicotinoid options and emerging biological controls. Segment growth at 4.7% CAGR through 2031 reflects rising soil insect prevalence linked to warming winters. The Europe seed treatment market size for fungicides accelerates faster due to disease management pivots, while nematicides hold a focused niche in high-value horticulture. Micro-encapsulation technology extends protection periods for insecticidal actives, helping maintain efficacy within strict environmental limits.
Adoption of low-risk chemistries and microbial inoculants is reshaping the seed treatment landscape. Suppliers are investing in library screening and polymer optimization to develop controlled-release coatings that balance efficacy with residue compliance. Field evaluations across Spain and Italy have shown 8–10% yield preservation using stacked biological–synthetic seed treatment packages, underscoring their role in sustaining farm profitability amid emerging pest pressures and stricter regulatory standards.


By Crop Type: Grains and cereals underpin demand while turf and ornamental rise fastest
Grains and cereals contributed 59.10% of Europe seed treatment market size in 2025, underscoring the region’s grain-centric farm economy. Large field areas and narrow profit margins make seed protection indispensable to ensure volume consistency. Demand intensifies as farmers integrate biological coats that mitigate soil-borne pathogens without violating residue limits.
Turf and ornamental acreage, though small in absolute terms, posts the highest 4.37% CAGR to 2031 as municipalities green urban spaces and golfing facilities expand. Premium aesthetic standards allow higher spending on micro-encapsulated biological blends. Commercial crops such as sugar beet and oilseed rape adjust to the neonicotinoid void with dual-mode fungicide and biostimulant treatments. Pulses and oilseeds gain policy support under European protein crop strategies, while fruit and vegetable growers adopt high-price biological formulas that align with retail residue screenings.

Geography Analysis
Germany led the Europe seed treatment market in 2025 with a 28.60% share due to its expansive grain acreage and early precision farming adoption. National extension services diffuse best practices quickly, and government sustainability incentives drive steady uptake of biological coatings. Investment in research hubs such as Julius Kühn-Institut also accelerates product validation and farmer confidence.
France records the fastest 6.12% CAGR through 2031, propelled by modernization grants and a structured national plan that rewards carbon-efficient farming. Diverse cropping, from Mediterranean orchards to northern wheat, supports segmented formulation demand, while public-private clusters expedite the commercialization of microbial seed treatments.
Southern Europe, especially Spain and Italy, experiences growing pest and drought stress. Farmers rely on bio-coatings that confer both disease suppression and abiotic stress tolerance. Eastern European countries, led by Poland and Ukraine, invest EU and national funds to modernize equipment and harmonize regulations, although administrative delays remain. The Netherlands, with its high-intensity horticulture, records the largest treatment expenditure per hectare. Following Brexit, separate United Kingdom rules create parallel approval pathways, increasing administrative overhead for multinational suppliers.
Competitive Landscape
The top five suppliers hold 58% revenue, indicating moderate concentration that still leaves room for agile biological specialists. Syngenta Group, Bayer AG, and Corteva Agriscience anchor portfolios with broad synthetic and biological lines yet face margin pressure from reformulation costs and stringent data packages. Syngenta committed EUR 180 million (USD 195 million) to expand biological capacity in France and Germany, signaling emphasis on sustainable solutions. Bayer strengthened its microbe pipeline by acquiring BioConsortia for USD 320 million.
Corteva rolled out a new micro-encapsulation platform that lengthens active stability and reduces dust off, differentiating on formulation science. UPL Limited and Croda International expand coating polymer lines to support biological actives. Meanwhile, digital farming alliances integrate platforms like Climate FieldView, providing prescription tools that tie seed treatment recommendations to field analytics, thus embedding suppliers deeper into farm decision cycles.
Specialized biological firms challenge incumbents through targeted microbes for cereal diseases and nematode control. These entrants benefit from faster innovation cycles and lower regulatory burdens on low-risk substances. Nonetheless, European data requirements and country-specific dossiers reward established regulatory teams, sustaining incumbent advantage.
Europe Seed Treatment Industry Leaders
Bayer AG
Corteva Agriscience
Syngenta Group
UPL Limited
Certis Belchim (Mitsui & Co., Ltd.)
- *Disclaimer: Major Players sorted in no particular order

Recent Industry Developments
- October 2025: Corteva has announced a significant restructuring plan, aiming to separate into two independent public companies by 2026. One entity will concentrate on seeds and traits, including seed treatment technologies, while the other will focus on crop protection and biologicals. This initiative is intended to enhance innovation and regulatory alignment, particularly in critical markets such as Europe.
- July 2024: Pioneer, a Corteva Agriscience brand, is offering imported oilseed rape seeds (PT303, PT312, PT315) in the UK with EU-approved seed treatments. These include Scenic Gold (fungicide) and Lumiposa (insecticide), providing enhanced protection against diseases and pests that UK regulations currently restrict.
- May 2024: StartLife and Corteva Agriscience formed a strategic partnership to accelerate AgriFoodTech innovation in Europe. This collaboration supports Corteva’s seed technology goals, including seed treatment advancements, by connecting with European startups.


Europe Seed Treatment Market Report Scope
Fungicide, Insecticide, Nematicide are covered as segments by Function. Commercial Crops, Fruits & Vegetables, Grains & Cereals, Pulses & Oilseeds, Turf & Ornamental are covered as segments by Crop Type. France, Germany, Italy, Netherlands, Russia, Spain, Ukraine, United Kingdom are covered as segments by Country.Function
| Fungicide |
| Insecticide |
| Nematicide |
Crop Type
| Commercial Crops |
| Fruits and Vegetables |
| Grains and Cereals |
| Pulses and Oilseeds |
| Turf and Ornamental |
Country
| France |
| Germany |
| Italy |
| Netherlands |
| Russia |
| Spain |
| Ukraine |
| United Kingdom |
| Rest of Europe |
| Function | Fungicide |
| Insecticide | |
| Nematicide | |
| Crop Type | Commercial Crops |
| Fruits and Vegetables | |
| Grains and Cereals | |
| Pulses and Oilseeds | |
| Turf and Ornamental | |
| Country | France |
| Germany | |
| Italy | |
| Netherlands | |
| Russia | |
| Spain | |
| Ukraine | |
| United Kingdom | |
| Rest of Europe |


Market Definition
- Function - Insecticides, fungicides, and nematicides are the crop protection chemicals used to treat seeds or seedlings.
- Application Mode - Seed treatment is a method of applying crop protection chemicals to the seeds before sowing or the seedlings before transplanting to the main field.
- Crop Type - This represents the consumption of crop protection chemicals by Cereals, Pulses, Oilseeds, Fruits, Vegetables, Turf, and Ornamental crops.
| Keyword | Definition |
|---|---|
| IWM | Integrated weed management (IWM) is an approach to incorporate multiple weed control techniques throughout the growing season to give producers the best opportunity to control problematic weeds. |
| Host | Hosts are the plants that form relationships with beneficial microorganisms and help them colonize. |
| Pathogen | A disease-causing organism. |
| Herbigation | Herbigation is an effective method of applying herbicides through irrigation systems. |
| Maximum residue levels (MRL) | Maximum Residue Limit (MRL) is the maximum allowed limit of pesticide residue in food or feed obtained from plants and animals. |
| IoT | The Internet of Things (IoT) is a network of interconnected devices that connect and exchange data with other IoT devices and the cloud. |
| Herbicide-tolerant varieties (HTVs) | Herbicide-tolerant varieties are plant species that have been genetically engineered to be resistant to herbicides used on crops. |
| Chemigation | Chemigation is a method of applying pesticides to crops through an irrigation system. |
| Crop Protection | Crop protection is a method of protecting crop yields from different pests, including insects, weeds, plant diseases, and others that cause damage to agricultural crops. |
| Seed Treatment | Seed treatment helps to disinfect seeds or seedlings from seed-borne or soil-borne pests. Crop protection chemicals, such as fungicides, insecticides, or nematicides, are commonly used for seed treatment. |
| Fumigation | Fumigation is the application of crop protection chemicals in gaseous form to control pests. |
| Bait | A bait is a food or other material used to lure a pest and kill it through various methods, including poisoning. |
| Contact Fungicide | Contact pesticides prevent crop contamination and combat fungal pathogens. They act on pests (fungi) only when they come in contact with the pests. |
| Systemic Fungicide | A systemic fungicide is a compound taken up by a plant and then translocated within the plant, thus protecting the plant from attack by pathogens. |
| Mass Drug Administration (MDA) | Mass drug administration is the strategy to control or eliminate many neglected tropical diseases. |
| Mollusks | Mollusks are pests that feed on crops, causing crop damage and yield loss. Mollusks include octopi, squid, snails, and slugs. |
| Pre-emergence Herbicide | Preemergence herbicides are a form of chemical weed control that prevents germinated weed seedlings from becoming established. |
| Post-emergence Herbicide | Postemergence herbicides are applied to the agricultural field to control weeds after emergence (germination) of seeds or seedlings. |
| Active Ingredients | Active ingredients are the chemicals in pesticide products that kill, control, or repel pests. |
| United States Department of Agriculture (USDA) | The Department of Agriculture provides leadership on food, agriculture, natural resources, and related issues. |
| Weed Science Society of America (WSSA) | The WSSA, a non-profit professional society, promotes research, education, and extension outreach activities related to weeds. |
| Suspension concentrate | Suspension concentrate (SC) is one of the formulations of crop protection chemicals with solid active ingredients dispersed in water. |
| Wettable powder | A wettable powder (WP) is a powder formulation that forms a suspension when mixed with water prior to spraying. |
| Emulsifiable concentrate | Emulsifiable concentrate (EC) is a concentrated liquid formulation of pesticide that needs to be diluted with water to create a spray solution. |
| Plant-parasitic nematodes | Parasitic Nematodes feed on the roots of crops, causing damage to the roots. These damages allow for easy plant infestation by soil-borne pathogens, which results in crop or yield loss. |
| Australian Weeds Strategy (AWS) | The Australian Weeds Strategy, owned by the Environment and Invasives Committee, provides national guidance on weed management. |
| Weed Science Society of Japan (WSSJ) | WSSJ aims to contribute to the prevention of weed damage and the utilization of weed value by providing the chance for research presentation and information exchange. |


Research Methodology
Mordor Intelligence follows a four-step methodology in all our reports.
- Step-1: Identify Key Variables: In order to build a robust forecasting methodology, the variables and factors identified in Step-1 are tested against available historical market numbers. Through an iterative process, the variables required for market forecast are set and the model is built on the basis of these variables.
- Step-2: Build a Market Model: Market-size estimations for the forecast years are in nominal terms. Inflation is not a part of the pricing, and the average selling price (ASP) is kept constant throughout the forecast period.
- Step-3: Validate and Finalize: In this important step, all market numbers, variables and analyst calls are validated through an extensive network of primary research experts from the market studied. The respondents are selected across levels and functions to generate a holistic picture of the market studied.
- Step-4: Research Outputs: Syndicated Reports, Custom Consulting Assignments, Databases & Subscription Platforms


