Market Overview
| Study Period | 2018 - 2031 |
|---|---|
| Forecast Data Period | 2026 - 2031 |
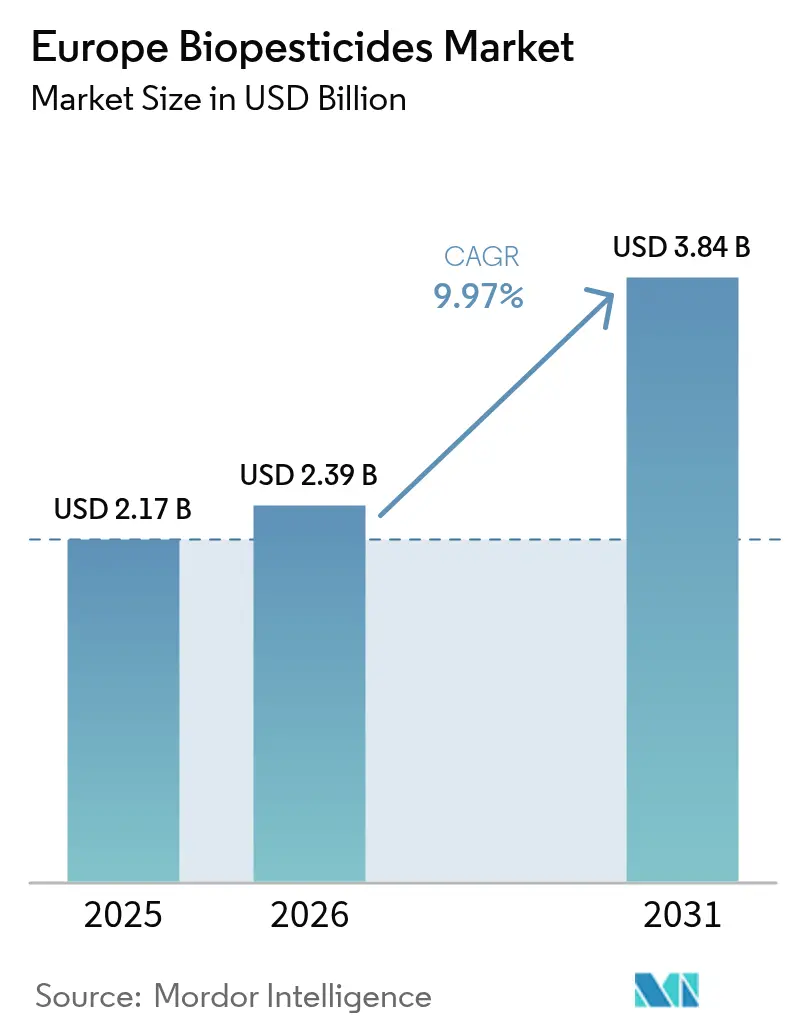
| Base Year Market Size (2025) | USD 2.17 Billion |
| Market Size (2026) | USD 2.39 Billion |
| Market Size (2031) | USD 3.84 Billion |
| Growth Rate (2026 - 2031) | 9.97% CAGR |
| Market Concentration | Low |
Major Players *Disclaimer: Major Players sorted in no particular order Image © Mordor Intelligence. Reuse requires attribution under CC BY 4.0. | |
Europe Biopesticides Market Analysis by Mordor Intelligence
The Europe biopesticides market size was valued at USD 2.17 billion in 2025 and estimated to grow from USD 2.39 billion in 2026 to reach USD 3.84 billion by 2031, at a CAGR of 9.97% during the forecast period (2026-2031). Mounting regulatory pressure to curb chemical pesticide use, rapid expansion of certified organic farmland, and the accelerating pace of neonicotinoid bans are together turning biological crop protection from a premium niche into an essential compliance tool. Leading cooperatives in France and Germany have started reallocating procurement budgets toward microbially derived fungicides and insecticides, while greenhouse growers in the Netherlands are scaling up beneficial insect releases to secure residue-free export certification. Technology advances in RNA interference are lifting field-level efficacy across Mediterranean orchards, and rising pest resistance to synthetic pyrethroids is widening the commercial runway for next-generation bioinsecticides. Against this policy and technology backdrop, the Europe biopesticides market is poised for a sustained double-digit revenue trajectory as distribution networks strengthen in Central and Eastern Europe.
Key Report Takeaways
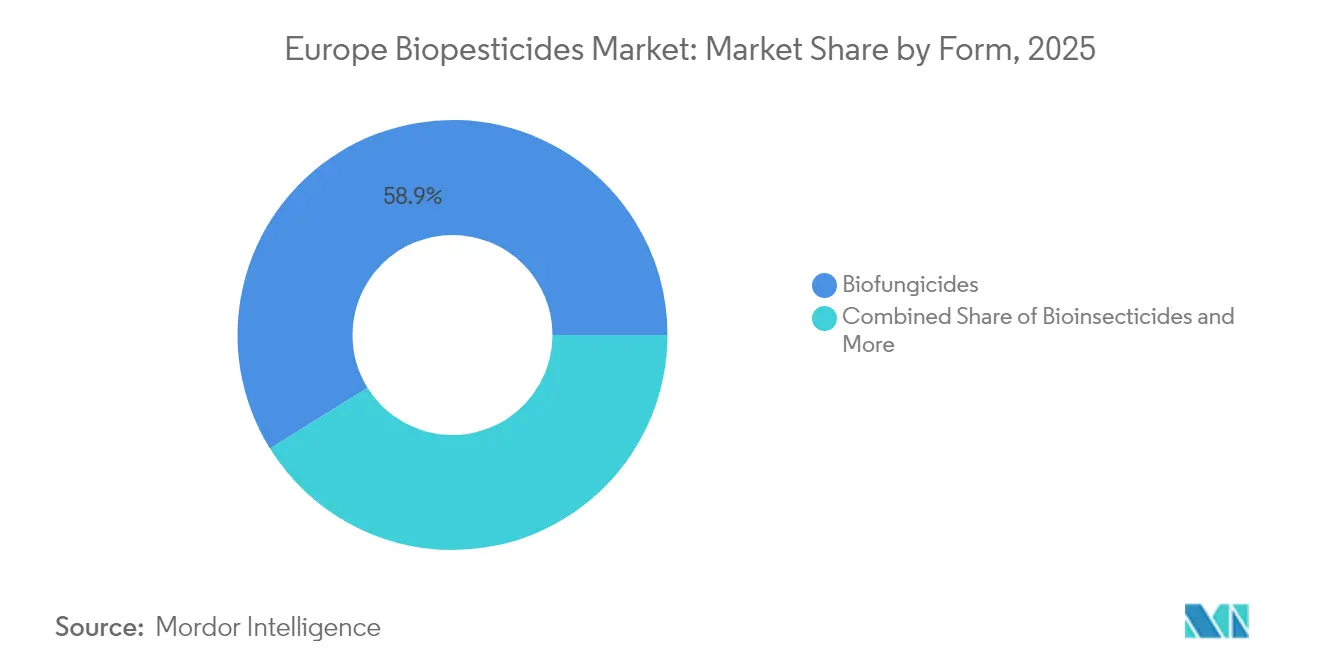
- By form, biofungicides held 58.86% of the Europe biopesticides market share in 2025, while bioinsecticides are expanding at a 10.34% CAGR through 2031.
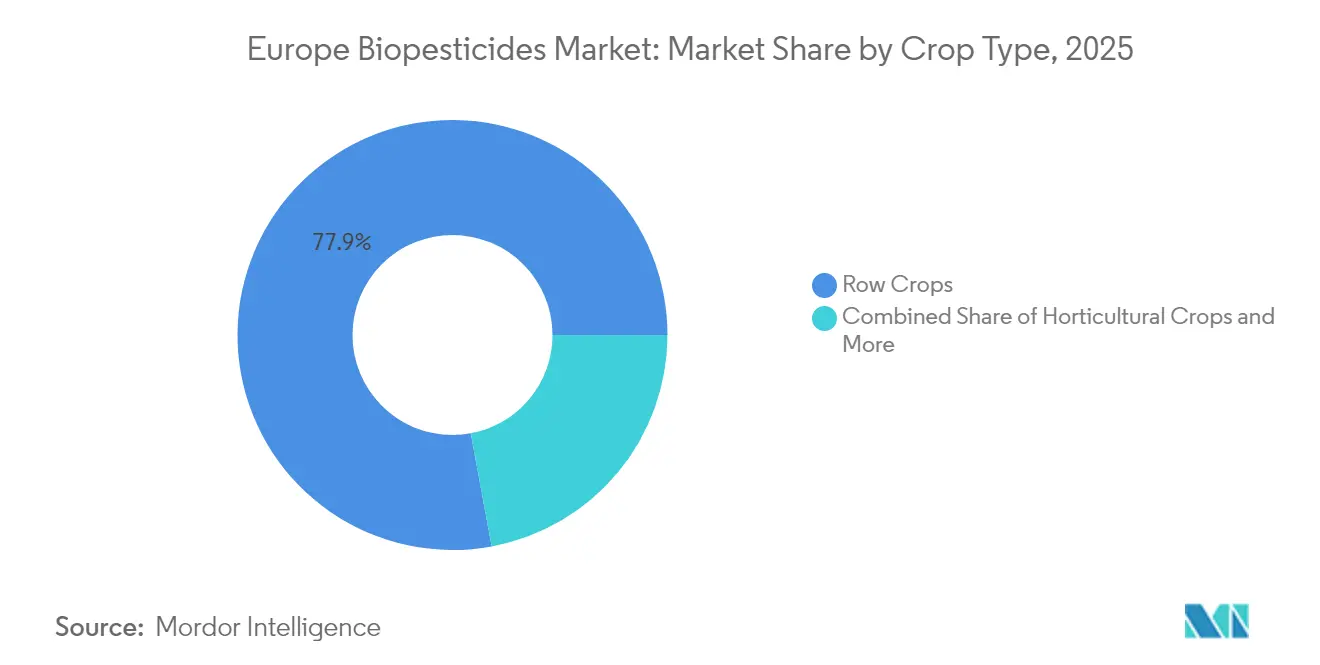
- By crop type, row crops accounted for 77.92% of the Europe biopesticides market size in 2025, while horticultural crops are projected to grow at an 10.92% CAGR between 2026 and 2031.
- By geography, France led with 28.05% of the Europe biopesticides market share in 2025, while Spain is advancing at an 10.86% CAGR during the forecast window.
Note: Market size and forecast figures in this report are generated using Mordor Intelligence’s proprietary estimation framework, updated with the latest available data and insights as of 2026.
Europe Biopesticides Market Trends and Insights
Drivers Impact Analysis*
| Driver | (~) % Impact on CAGR Forecast | Geographic Relevance | Impact Timeline |
|---|---|---|---|
| European Union (EU) Farm-to-Fork 50% chemical pesticide reduction mandate | +2.1% | EU-wide, strongest in Western Europe | Medium term (2-4 years) |
| Rapid growth of certified organic farmland acreage | +1.8% | Global EU, led by France, Germany, and Italy | Long term (≥ 4 years) |
| Accelerated bans on neonics and other synthetic actives | +1.5% | EU-wide with spillover to UK and Switzerland | Short term (≤ 2 years) |
| Rising resistance of key pests to conventional agrochemicals | +1.2% | Mediterranean core, expanding to Central Europe | Medium term (2-4 years) |
| RNA-i biocontrol breakthroughs in Mediterranean horticulture | +0.9% | Spain, Italy, Southern France, and Greece | Long term (≥ 4 years) |
| CEE (Central and Eastern Europe) cross-border carbon farming subsidies favoring biologics | +0.7% | Central and Eastern Europe, and Balkans | Medium term (2-4 years) |
| Source: Mordor Intelligence | |||
European Union (EU) Farm-to-Fork 50% chemical pesticide reduction mandate
The European Union Farm-to-Fork strategy mandates a 50% reduction in chemical pesticide use by 2030, forcing immediate shifts in purchasing policies among major cooperatives such as InVivo in France and BayWa in Germany. As synthetic registrations expire, growers are closing supply gaps with microbial fungicides and beneficial nematodes that satisfy the lower-residue thresholds now enforced on domestic and export channels. National action plans are moving faster than originally planned. Denmark has already restricted glyphosate applications near residential zones, and the Netherlands targets a 37% chemical reduction by 2027.[1]Source: European Environment Agency, “Agriculture and Food Systems,” EEA.EUROPA.EU
Rapid growth of certified organic farmland acreage
Certified organic acreage in the European Union rose in 2024, intensifying demand for OMRI-listed (Organic Materials Review Institute) inputs. Organic cereal premiums sit at EUR 150–200 (USD 161–214) per hectare above conventional pricing, giving growers the margin room to pay higher up-front costs for microbial and botanical products. Spain created hectares of organic land in the past years, while Estonia and Latvia led in conversion speed, surpassing a 25 % annual growth rate. This acreage surge underpins margin expansion for suppliers able to deliver residue-free, export-ready biological formulations.[2]Source: Eurostat, “Organic Farming Statistics,” EC.EUROPA.EU
Accelerated bans on neonics and other synthetic actives
The European Food Safety Authority (EFSA) tightened risk assessments in 2024, adding new limits on clothianidin and thiamethoxam that removed seed-treatment use on roughly 4.2 million hectares of row crops. Bioinsecticide sales based on Bacillus thuringiensis spores and Beauveria bassiana conidia have surged, taking 25 % penetration in German sugar beet acreage and a similar share in French maize. Residue-sensitive export buyers in North America and Asia have also reinforced the pivot to biological seed-treatment solutions.
RNA-i biocontrol breakthroughs in Mediterranean horticulture
Spanish research centers and Seipasa have advanced RNA interference (RNA-i) sprays that deactivate pest gene expression, achieving 85–90 % control of Colorado potato beetle and Mediterranean fruit fly under high-temperature field settings. Commercial rollouts in Valencia citrus groves and Italian greenhouse vegetables report season-long protection with no detected impact on pollinators. European Food Safety Authority is drafting RNA-i guidance, anticipated to shorten registration times by 2026, positioning early license holders for an accelerated revenue lift.[3]Source: Spanish Ministry of Agriculture Fisheries and Food, “Innovation Pipeline,” MAPA.GOB.ES
Restraints Impact Analysis*
| Restraint | (~) % Impact on CAGR Forecast | Geographic Relevance | Impact Timeline |
|---|---|---|---|
| High price premium and shorter shelf life than synthetics | -1.4% | EU-wide, most pronounced in price-sensitive Eastern Europe | Short term (≤ 2 years) |
| Lengthy and complex EU registration/Mutual Recognition path | -1.1% | EU-wide regulatory bottleneck | Medium term (2-4 years) |
| Variable field efficacy in cooler Northern Europe climates | -0.8% | Scandinavia, Northern Germany, Baltic states | Long term (≥ 4 years) |
| Volatile supply of microbial fermentation inputs | -0.6% | Global supply chain affecting all EU markets | Short term (≤ 2 years) |
| Source: Mordor Intelligence | |||
High price premium and shorter shelf life than synthetics
Average wholesale prices for microbial fungicides sit 20–30 % above synthetic competitors because of fermentation overheads, cold-chain storage, and higher distribution risk from 18–24-month shelf lives. The economic pinch affects commodity cereal growers in Poland and Romania, where margins remain tight. By contrast, Dutch greenhouse cucumber producers accept 40–50 % premiums given the export penalties linked to maximum residue limits.
Lengthy and complex EU registration/Mutual Recognition path
Submitting a single active substance under the European Union zonal evaluation system can cost EUR 3–4 million and take 3–4 years because each climate zone demands localized efficacy trials. Small start-ups often lack the capital to run parallel studies across three distinct regulatory zones, slowing technology diffusion despite recent fast-track proposals. Dossier backlogs stretch 18 months in Italy and Greece, according to national authorities.
*Our forecasts treat driver/restraint impacts as directional, not additive. The impact forecasts reflect baseline growth, mix effects, and variable interactions.
Segment Analysis
By Form: Fungal Bio-Control Solutions Anchor Adoption Momentum
Biofungicides generated 58.86 % of 2025 revenue, making them the volume backbone of the Europe biopesticides market. Their long track record against Botrytis cinerea on grapes and Fusarium on cereals supports repeat purchases across cool and warm zones alike. The combination of mature fermentation processes and predictable shelf life sets biofungicides ahead in distributor preference. Bioinsecticides are quickly closing the gap with a 10.34 % CAGR to 2031 as neonicotinoid bans expand and RNA-i sprays push control levels closer to synthetic analogues. The Europe biopesticides market size for biofungicides is set to outpace synthetic fungicides as European Union Growth Directive revisions cap future chemical registrations.
Emerging bioherbicide launches remain small in revenue share but have picked up momentum where local glyphosate bans apply, notably in Belgian cities and Danish waterways. Nematode and molluscicide sub-classes service niche high-value vegetable plots, leveraging premium price points that withstand raw material inflation. Because each form carries a distinct manufacturing model, cross-segment scale economies remain limited, yet EU Horizon research grants are now steering funds toward combined microbial consortia to lift control spectra.


By Crop Type: Row Crops Dominate, Horticulture Sets the Pace
Row crops commanded 77.92 % of revenue in 2025, securing the widest field footprint in the Europe biopesticides market. Cereal and oilseed farms in France and Germany have intensified microbial seed-treatment use to satisfy retailer residue mandates. Despite that dominance, horticultural crops are racing ahead at an 10.92 % CAGR, reflecting greenhouse reliance on beneficial insects for peppers, tomatoes, and cucumbers destined for northern supermarkets. The Europe biopesticides market size for horticulture is poised to benefit from planned glasshouse expansions in Spain and Poland, supported by regional subsidies covering biological inputs.
Cash crops such as specialty oilseeds and hemp enjoy balanced growth where national regulations allow only low-residue actives on ingredients for cosmetics and nutraceuticals. Meanwhile, sugar beet acreage in Germany and France is seeing strong adoption of Bacillus-based seed coatings that curb beet cyst nematode pressure without residue trade risks. Policymakers tying direct payments under the Common Agricultural Policy (CAP) to biodiversity performance will gradually close cost gaps between crop groups, further distributing biological usage into broad-acre rotations.
Geography Analysis
France captured 28.05 % of 2025 revenue, giving it the largest stake in the Europe biopesticides market. The Ecophyto plan and strong public-private research collaboration underpin deep integration of microbial fungicides in viticulture and cereals, with average farm spend on biologicals rising 17 % yearly since 2023. Cooperatives like Agrial have re-engineered supply contracts to prioritize low-residue inputs, making France a bellwether zone for label expansion. Spain is the fastest mover at an 10.86 % CAGR through 2031 because its Mediterranean climate yields consistent field efficacy. Andalusia’s greenhouse cluster uses multi-strain beneficial insects to protect tomato and pepper exports. Regional subsidies covering 70 % of RNA-i registration fees accelerate technology transfer into the citrus and olive sectors.
Germany and Italy post balanced mid-single-digit growth. Germany’s sugar beet sector has embraced microbial nematicides after pyrethroid restrictions, and Bayer trialed a new Bacillus amyloliquefaciens strain across 24,000 hectares of winter wheat in 2024. Italian wine growers are early adopters of RNA-i mildew control, and Tuscany consortia plan to shift 85 % of fungicide sprays to biologicals by 2028. The Netherlands exemplifies premium utilization with Europe biopesticides market share per hectare topping 12 % in 2024, driven by intensive greenhouse output. Dutch growers rely on year-round releases of predatory mites and parasitoids to meet the zero-residue mandates of German and Scandinavian retailers.
Scandinavian countries, though cool and variable in climate, are piloting cold-tolerant microbial blends developed by Andermatt Group, signaling future upside once formulation science overcomes temperature barriers. Central and Eastern European states remain price-sensitive but are unlocking demand through carbon-credit pilots that offset higher up-front costs. Poland’s maize program links microbial input verification to EU Emissions Trading System rewards, while Romania’s sugar beet processors pay growers bonuses for residue-free deliveries. Kosovo and Albania sit outside the European Union regulatory architecture yet often mirror EU bans through bilateral trade pacts, creating contiguous opportunities for distributors willing to tailor registration dossiers.
Competitive Landscape
The market is fragmented. Market leaders like Certis Europe B.V. (Mitsui & Co., Ltd.) lead through an early foothold in multiple European Union zones, leveraging in-house fermentation assets and broad cooperative agreements. Corteva Agriscience is increasing capacity by 60 % at its Bergamo plant to support an expanding portfolio of Granbio-branded microbial inoculants. Koppert B.V. dominates beneficial insect volumes and recently formed a joint venture with Tareks to tailor strains for the higher ambient temperatures of Mediterranean and Middle Eastern farms.
Strategic licensing is now central. Bayer AG and BASF SE pursue RNA-i exclusivity deals with regional biotech start-ups to gain differentiated efficacy thresholds that bypass pesticide resistance. Acquisition activity is accelerating the market. Supply chain resilience is emerging as a secondary advantage; companies with fermentation inputs diversified beyond Eastern Europe overcame 2024 nutrient broth disruptions faster, winning shelf-space from smaller rivals.
Regulatory aptitude sets another dividing line. Firms that maintain local regulatory affairs teams in three climate zones, maritime, Mediterranean, and continental, secure faster mutual recognition approvals. This competence widens the competitive gap because dossier delays can cost two growing seasons of revenue. Digital agronomy partners, notably Agmatix in Israel and Climate FieldView in the United States, are entering data-sharing arrangements with European biological suppliers to generate micro-climate efficacy models that sharpen application timing and boost grower confidence.
Europe Biopesticides Industry Leaders
Certis Europe B.V. (Mitsui & Co., Ltd.)
Corteva Agriscience
Koppert B.V.
Seipasa S.A.
Biolchim SPA (J.M. Huber Corporation)
- *Disclaimer: Major Players sorted in no particular order

Recent Industry Developments
- January 2025: Andermatt Group acquired Entocare CV in the Netherlands, enhancing its presence in the European biological pest control market through the use of beneficial insects. This acquisition strengthens Andermatt's position in the European biopesticides and biocontrol market, aligning with the European Union's increasing demand for sustainable crop protection solutions.
- November 2024: Seipasa's bioinsecticide Pirecris received new approvals in Spain, allowing its use on fruit trees, berries, apricots, and persimmons. This regulatory expansion reinforces Seipasa's position in the European biopesticides market and promotes broader adoption of sustainable crop protection solutions.
- July 2024: Andermatt Group acquired BioTEPP Inc., obtaining the virus-based bioinsecticide Virosoft CP4, designed for codling moth control in apples and pears. This acquisition enhances Andermatt’s European biopesticides portfolio, broadening sustainable pest control solutions for major fruit crops.


Europe Biopesticides Market Report Scope
Biofungicides, Bioherbicides, Bioinsecticides are covered as segments by Form. Cash Crops, Horticultural Crops, Row Crops are covered as segments by Crop Type. France, Germany, Italy, Netherlands, Russia, Spain, Turkey, United Kingdom are covered as segments by Country.Form
| Biofungicides |
| Bioherbicides |
| Bioinsecticides |
| Other Biopesticides |
Crop Type
| Cash Crops |
| Horticultural Crops |
| Row Crops |
Geography
| France |
| Germany |
| Italy |
| Netherlands |
| Russia |
| Spain |
| Turkey |
| United Kingdom |
| Rest of Europe |
| Form | Biofungicides |
| Bioherbicides | |
| Bioinsecticides | |
| Other Biopesticides | |
| Crop Type | Cash Crops |
| Horticultural Crops | |
| Row Crops | |
| Geography | France |
| Germany | |
| Italy | |
| Netherlands | |
| Russia | |
| Spain | |
| Turkey | |
| United Kingdom | |
| Rest of Europe |


Market Definition
- AVERAGE DOSAGE RATE - The average application rate is the average volume of biopesticides applied per hectare of farmland in the respective region/country.
- CROP TYPE - Crop type includes Row crops (Cereals, Pulses, Oilseeds), Horticultural Crops (Fruits and vegetables) and Cash Crops (Plantation Crops, Fibre Crops and Other Industrial Crops)
- FUNCTION - The Crop Protection function of agirucultural biological include products that prevent or control various biotic and abiotic stress.
- TYPE - Biopesticides prevent or control various pests, including insects, diseases, and weeds, from causing crop damage and yield loss.
| Keyword | Definition |
|---|---|
| Cash Crops | Cash crops are non-consumable crops sold as a whole or part of the crop to manufacture end-products to make a profit. |
| Integrated Pest Management (IPM) | IPM is an environment-friendly and sustainable approach to control pests in various crops. It involves a combination of methods, including biological controls, cultural practices, and selective use of pesticides. |
| Bacterial biocontrol agents | Bacteria used to control pests and diseases in crops. They work by producing toxins harmful to the target pests or competing with them for nutrients and space in the growing environment. Some examples of commonly used bacterial biocontrol agents include Bacillus thuringiensis (Bt), Pseudomonas fluorescens, and Streptomyces spp. |
| Plant Protection Product (PPP) | A plant protection product is a formulation applied to crops to protect from pests, such as weeds, diseases, or insects. They contain one or more active substances with other co-formulants such as solvents, carriers, inert material, wetting agents or adjuvants formulated to give optimum product efficacy. |
| Pathogen | A pathogen is an organism causing disease to its host, with the severity of the disease symptoms. |
| Parasitoids | Parasitoids are insects that lay their eggs on or within the host insect, with their larvae feeding on the host insect. In agriculture, parasitoids can be used as a form of biological pest control, as they help to control pest damage to crops and decrease the need for chemical pesticides. |
| Entomopathogenic Nematodes (EPN) | Entomopathogenic nematodes are parasitic roundworms that infect and kill pests by releasing bacteria from their gut. Entomopathogenic nematodes are a form of biocontrol agents used in agriculture. |
| Vesicular-arbuscular mycorrhiza (VAM) | VAM fungi are mycorrhizal species of fungus. They live in the roots of different higher-order plants. They develop a symbiotic relationship with the plants in the roots of these plants. |
| Fungal biocontrol agents | Fungal biocontrol agents are the beneficial fungi that control plant pests and diseases. They are an alternative to chemical pesticides. They infect and kill the pests or compete with pathogenic fungi for nutrients and space. |
| Biofertilizers | Biofertilizers contain beneficial microorganisms that enhance soil fertility and promote plant growth. |
| Biopesticides | Biopesticides are natural/bio-based compounds used to manage agricultural pests using specific biological effects. |
| Predators | Predators in agriculture are the organisms that feed on pests and help control pest damage to the crops. Some common predator species used in agriculture include ladybugs, lacewings, and predatory mites. |
| Biocontrol agents | Biocontrol agents are living organisms used to control pests and diseases in agriculture. They are alternatives to chemical pesticides and are known for their lesser impact on the environment and human health. |
| Organic Fertilizers | Organic fertilizer is composed of animal or vegetable matter used alone or in combination with one or more non-synthetically derived elements or compounds used for soil fertility and plant growth. |
| Protein hydrolysates (PHs) | Protein hydrolysate-based biostimulants contain free amino acids, oligopeptides, and polypeptides produced by enzymatic or chemical hydrolysis of proteins, primarily from vegetal or animal sources. |
| Biostimulants/Plant Growth Regulators (PGR) | Biostimulants/Plant Growth Regulators (PGR) are substances derived from natural resources to enhance plant growth and health by stimulating plant processes (metabolism). |
| Soil Amendments | Soil Amendments are substances applied to soil that improve soil health, such as soil fertility and soil structure. |
| Seaweed Extract | Seaweed extracts are rich in micro and macronutrients, proteins, polysaccharides, polyphenols, phytohormones, and osmolytes. These substances boost seed germination and crop establishment, total plant growth and productivity. |
| Compounds related to biocontrol and/or promoting growth (CRBPG) | Compounds related to biocontrol or promoting growth (CRBPG) are the ability of a bacteria to produce compounds for phytopathogen biocontrol and plant growth promotion. |
| Symbiotic Nitrogen-Fixing Bacteria | Symbiotic nitrogen-fixing bacteria such as Rhizobium obtain food and shelter from the host, and in return, they help by providing fixed nitrogen to the plants. |
| Nitrogen Fixation | Nitrogen fixation is a chemical process in soil which converts molecular nitrogen into ammonia or related nitrogenous compounds. |
| ARS (Agricultural Research Service) | ARS is the U.S. Department of Agriculture's chief scientific in-house research agency. It aims to find solutions to agricultural problems faced by the farmers in the country. |
| Phytosanitary Regulations | Phytosanitary regulations imposed by the respective government bodies check or prohibit the importation and marketing of certain insects, plant species, or products of these plants to prevent the introduction or spread of new plant pests or pathogens. |
| Ectomycorrhizae (ECM) | Ectomycorrhiza (ECM) is a symbiotic interaction of fungi with the feeder roots of higher plants in which both the plant and the fungi benefit through the association for survival. |


Research Methodology
Mordor Intelligence follows a four-step methodology in all our reports.
- Step-1: Identify Key Variables: In order to build a robust forecasting methodology, the variables and factors identified in Step-1 are tested against available historical market numbers. Through an iterative process, the variables required for market forecast are set and the model is built on the basis of these variables.
- Step-2: Build a Market Model: Market-size estimations for the forecast years are in nominal terms. Inflation is not a part of the pricing, and the average selling price (ASP) is kept constant throughout the forecast period.
- Step-3: Validate and Finalize: In this important step, all market numbers, variables and analyst calls are validated through an extensive network of primary research experts from the market studied. The respondents are selected across levels and functions to generate a holistic picture of the market studied.
- Step-4: Research Outputs: Syndicated Reports, Custom Consulting Assignments, Databases & Subscription Platforms.


