Market Overview
| Study Period | 2018 - 2031 |
|---|---|
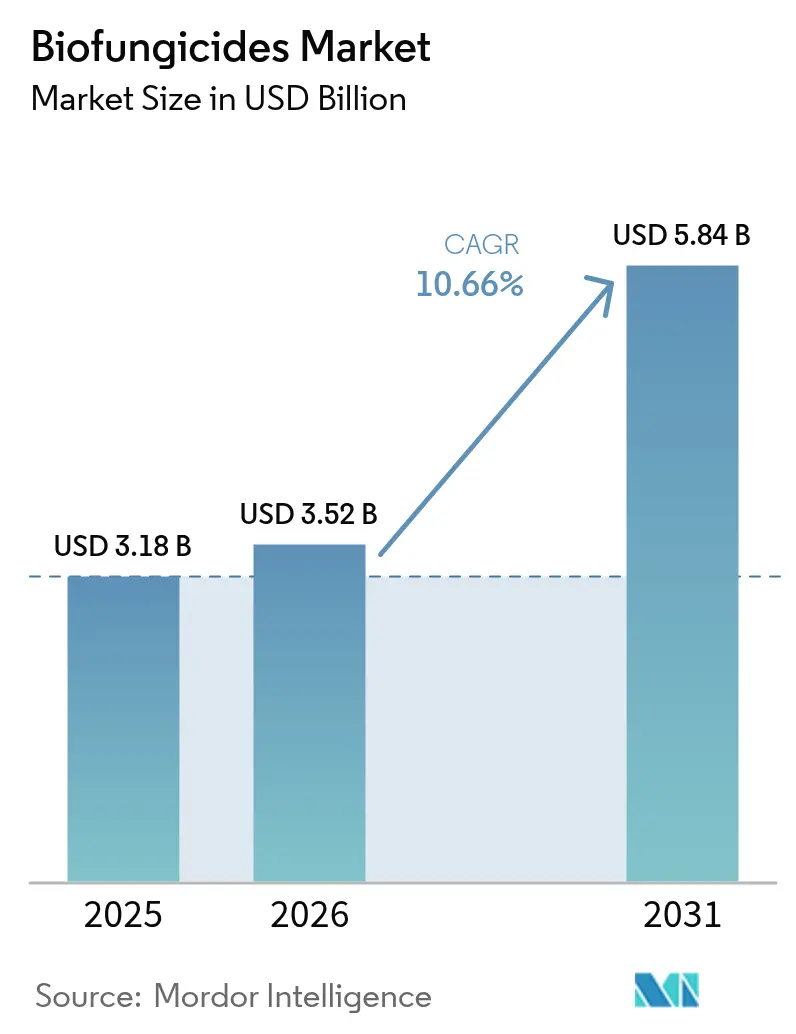
| Market Size (2026) | USD 3.52 Billion |
| Market Size (2031) | USD 5.84 Billion |
| Growth Rate (2026 - 2031) | 10.66% CAGR |
| Fastest Growing Market | North America |
| Largest Market | Europe |
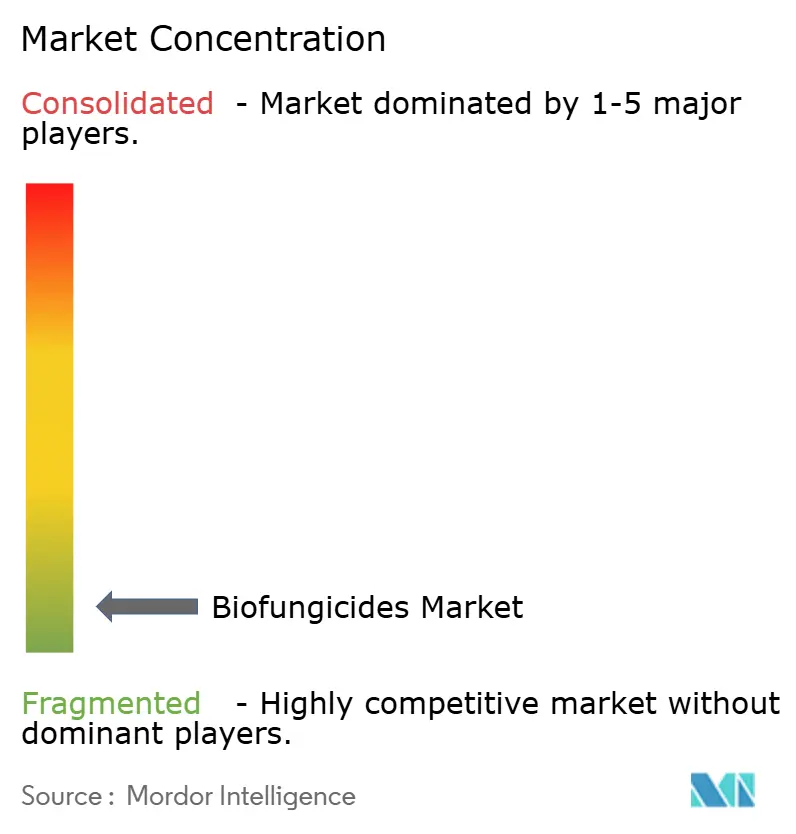
| Market Concentration | Low |
Major Players *Disclaimer: Major Players sorted in no particular order Image © Mordor Intelligence. Reuse requires attribution under CC BY 4.0. | |
Biofungicides Market Analysis by Mordor Intelligence
The biofungicides market size is expected to grow from USD 3.18 billion in 2025 to USD 3.52 billion in 2026 and is forecast to reach USD 5.84 billion by 2031 at 10.66% CAGR over 2026-2031. Accelerating regulatory curbs on chemical residues, rapid organic acreage gains, and sustained consumer preference for residue-free produce underpin growth momentum. Europe’s Farm to Fork pesticide-reduction targets and the United States Environmental Protection Agency’s (EPA) streamlined biopesticide registration pathway shorten commercialization cycles and encourage investment[1]Source: European Commission, “Farm to Fork Strategy,” europa.eu. Digital platforms that ship biologicals directly to farms at lower distribution costs widen smallholder access and spur adoption in emerging markets. Advances in micro-encapsulation extend product shelf life to 24 months, enabling global logistics for living microbial products. Competitive intensity stays high because the top five suppliers together command roughly 1% of global revenues, leaving ample headroom for consolidation and technology-driven differentiation.
Key Report Takeaways
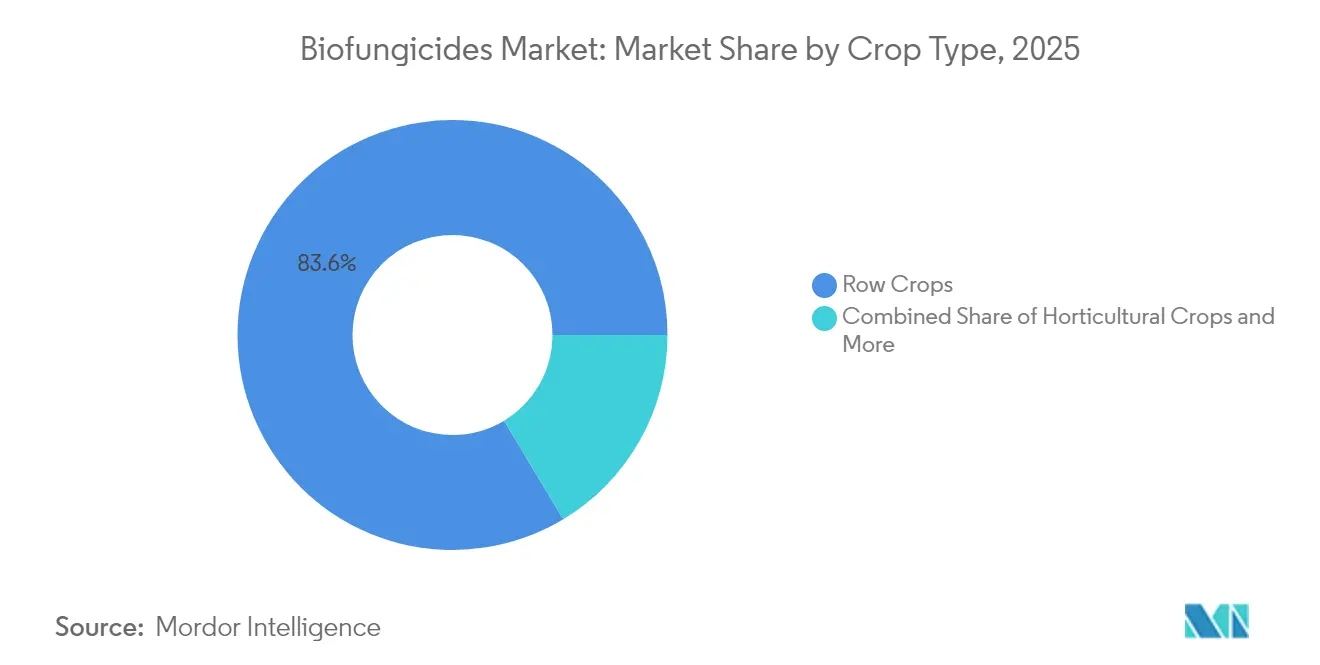
- By crop type, row crops led with 83.62% revenue share of the biofungicides market in 2025, while horticultural crops are projected to advance at an 10.98% CAGR through 2031.
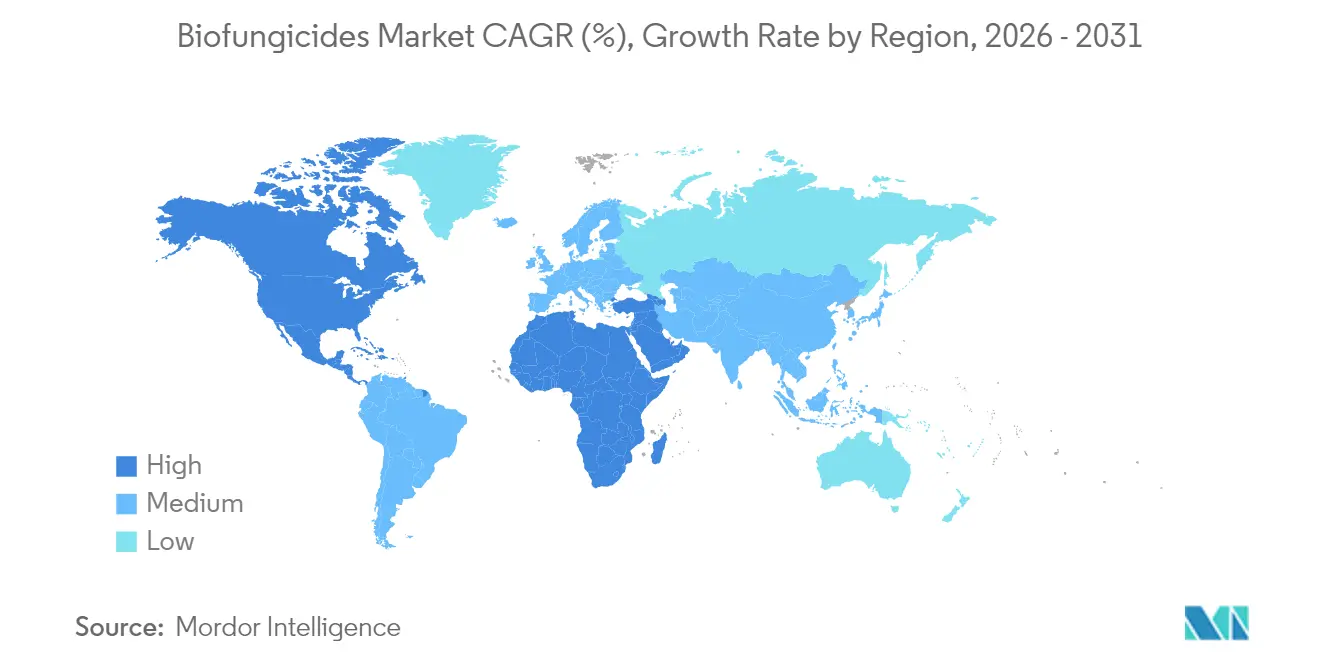
- By geography, Europe retained 40.35% of the biofungicides market share in 2025, while North America shows the fastest regional growth at an 11.38% CAGR for 2026-2031.
Note: Market size and forecast figures in this report are generated using Mordor Intelligence’s proprietary estimation framework, updated with the latest available data and insights as of 2026.
Global Biofungicides Market Trends and Insights
Drivers Impact Analysis*
| Driver | (~) % Impact on CAGR Forecast | Geographic Relevance | Impact Timeline |
|---|---|---|---|
| Expansion of organic farming acreage | +2.8% | Global, with strongest growth in North America and Europe | Medium term (2-4 years) |
| Regulatory bans on synthetic fungicide residues | +2.1% | Europe and North America, expanding to Asia-Pacific | Long term (≥ 4 years) |
| Rising consumer demand for residue-free produce | +1.9% | Global, led by developed markets | Short term (≤ 2 years) |
| Integration of biofungicides into IPM programs | +1.7% | North America and Europe, emerging in Asia-Pacific | Medium term (2-4 years) |
| E-commerce-enabled direct farm distribution | +1.4% | Global, with rapid adoption in emerging markets | Short term (≤ 2 years) |
| Micro-encapsulation extending product shelf life | +1.1% | Global, particularly beneficial in tropical regions | Long term (≥ 4 years) |
| Source: Mordor Intelligence | |||
Expansion of Organic Farming Acreage
Global certified organic land rose 1.6% in 2024 to 76.4 million hectares, and organic crop sales in the United States climbed 5.1% to USD 11.2 billion, creating steady demand for biofungicide compliance tools[2]Source: Research Institute of Organic Agriculture, “World of Organic Agriculture 2025,” fibl.org. European programs pay EUR 300 (USD 324) per hectare to growers converting to organic systems, making biological disease control economically attractive. Field trials show biofungicide-treated plots yielding 15-25% more than untreated organic controls. The premium price spread of 20-40% for certified produce offsets higher input costs, encouraging adoption across grains, fruits, and vegetables.
Regulatory Bans on Synthetic Fungicide Residues
The European Union banned active ingredients such as chlorothalonil and mancozeb in 2024 and reduced maximum residue limits by 60%, opening immediate market space for biological replacements. The EPA began reviewing 23 older fungicides, signaling possible curbs that further tilt decisions toward bio-based tools in the United States. China introduced a fast-track biofungicide registration channel that halves approval time to 12 months, creating new openings for innovators.
Rising Consumer Demand for Residue-Free Produce
Many shoppers now verify pesticide-free labels, and import inspections in countries like Japan and South Korea have rejected significant amounts of non-compliant shipments, pressuring exporters to shift to biofungicide programs. Retail chains demand zero detectable residues for the majority of deliveries. Conventional growers, therefore, integrate biological solutions to secure premium shelf space and protect brand reputation.
Integration of Biofungicides into IPM Programs
Integrated Pest Management (IPM) adoption reached 68% of U.S. commercial farms in 2024, up from 52% in 2022, delivering 12-18% higher net margins per ha through reduced resistance costs and insurance rebates. Decision-support software now combines weather data with disease models to trigger timely microbial sprays, improving control outcomes while trimming labor and fuel bills. Food manufacturers, including Cargill and Archer Daniels Midland, require documented IPM compliance throughout their supply chains, embedding biofungicides into mainstream agronomic practice.
Restraints Impact Analysis*
| Restraint | (~) % Impact on CAGR Forecast | Geographic Relevance | Impact Timeline |
|---|---|---|---|
| Higher price point versus chemical fungicides | -1.8% | Global, most pronounced in price-sensitive emerging markets | Short term (≤ 2 years) |
| Variable field efficacy across climates | -1.2% | Tropical and arid regions, seasonal variation in temperate zones | Medium term (2-4 years) |
| Cold-chain dependence for select microbial strains | -0.9% | Regions with limited refrigerated logistics infrastructure | Long term (≥ 4 years) |
| Patent thickets around next-gen Bacillus strains | -0.6% | Global, affecting innovation and market entry | Long term (≥ 4 years) |
| Source: Mordor Intelligence | |||
Higher Price Point Versus Chemical Fungicides
Per-hectare treatment costs for biofungicides are significantly higher than synthetic programs, creating challenges for adoption in farms with limited financial resources. While premium produce prices and reduced resistance-related expenses help to narrow the cost gap over time, the higher initial expenses make it difficult for smallholders to adopt without financial support. In some regions, subsidies are available to offset these costs, such as reimbursement programs in the European Union, but similar support is limited in other areas like Africa and parts of Asia.
Variable Field Efficacy across Climates
Trial data indicate that microbial products often experience reduced effectiveness under challenging environmental conditions, such as high temperatures and low humidity. This variability can result in inconsistent disease control, particularly in regions like Southeast Asia and sub-Saharan Africa, where such conditions are common. Ongoing research focuses on developing heat-tolerant strains and optimizing weather-based application schedules to enhance reliability. Growers remain cautious and hesitant to adopt these solutions widely until consistent field performance is demonstrated over time.
*Our forecasts treat driver/restraint impacts as directional, not additive. The impact forecasts reflect baseline growth, mix effects, and variable interactions.
Segment Analysis
By Crop Type: Biofungicides Gain Ground Beyond Row Crop Mainstays
Row crops commanded 83.62% of 2025 global revenue for the biofungicides market, reflecting economies of scale in corn, soybean, and wheat production and the ability to integrate biological seed treatments for season-long soil pathogen defense. Precision equipment applies variable microbial doses, trimming input costs and enhancing efficacy. The biofungicides market size for row crops is forecast to expand at a 10.21% CAGR through 2031, supported by crop insurance incentives that reward sustainable inputs.
Horticultural crops represent the fastest-growing slice, projected to grow at 10.98% CAGR, as supermarkets impose strict residue thresholds and consumers pay premiums for clean labels. Greenhouse vegetables capture an outsized share because controlled climates optimize microbial survival, while berries, grapes, and citrus follow close behind due to stringent export residue rules. Despite higher per-hectare spending, growers recoup costs through 20-40% price premiums and reduced rejections. Cash crops such as cotton and tobacco show flat penetration because entrenched chemical protocols still meet buyer audits, though emerging biological rotations could unlock moderate gains later in the forecast window.


Geography Analysis
Europe retained 40.35% biofungicides market share in 2025 due to rigorous pesticide curbs and Common Agricultural Policy eco-schemes that channel EUR 31 billion (USD 33.5 billion) annually into sustainable practices. Germany has significantly increased the use of biofungicides, supported by government grants for growers transitioning to organic farming systems. France has implemented mandatory integrated pest management (IPM) practices across all commercial farms, driving a notable rise in biofungicide adoption. Meanwhile, the Netherlands has showcased advanced usage intensity, utilizing robotic sprayers guided by disease prediction software to optimize application efficiency.
North America posts the strongest growth, with the biofungicides market size forecast to climb at 11.38% CAGR through 2031 on the back of technology innovation and favorable regulatory timelines. The U.S. Organic Certification Cost Share Program provided significant reimbursements for biological inputs, supporting the adoption of sustainable farming practices. Canada’s Pest Management Regulatory Agency streamlined review processes for biological products, encouraging new product launches by domestic startups. Mexico introduced government extension brigades that trained a large number of growers on biological crop protection, enhancing regional adoption.
Asia-Pacific offers substantial untapped potential for biofungicides. China’s latest Five-Year Plan includes major investments to expand sustainable agriculture, with a focus on establishing biofungicide manufacturing hubs in key regions. India has developed production units across multiple states under its National Mission for Sustainable Agriculture, reducing dependency on imports and customizing products for local conditions. Japan’s strict residue regulations have driven a significant increase in biological adoption among export-oriented growers, reflecting a broader regional trend toward sustainable practices.

Competitive Landscape
The biofungicides market remains highly fragmented, with Koppert B.V., Bioceres Crop Solutions, Biobest Group N.V., Seipasa SA, and Corteva Agriscience together holding a significant share of global revenue, indicating low concentration. Acquisition appetite is strong as multinationals seek rapid entry via proven microbial assets. Corteva’s USD 230 million purchase of Symborg in December 2024 gained proprietary Bacillus and Trichoderma lines plus European distribution.
Bioceres Crop Solutions allocated USD 45 million for an Argentine fermentation plant to reduce South American supply bottlenecks. Koppert’s new Mexican facility trims shipping distances and enhances freshness in North America. Technology fronts shift toward artificial intelligence-guided strain discovery, thermostable formulations, and combination products that deliver multiple modes of action.
Corteva Agriscience filed patents covering machine-learning-based selection of high-efficacy Bacillus variants in 2024, signaling data-driven R&D. Intellectual property thickets remain a barrier for start-ups, but patent pooling discussions could unlock faster innovation cycles. Direct-to-farmer e-commerce channels erode the traditional dealer stronghold, allowing small biotechnology companies to compete on equal footing without heavy distribution overheads.
Biofungicides Industry Leaders
Koppert B.V.
Bioceres Crop Solutions
Biobest Group N.V.
Corteva Agriscience
Seipasa SA
- *Disclaimer: Major Players sorted in no particular order

Recent Industry Developments
- November 2025: The U.S. Environmental Protection Agency (EPA) has issued a proposed registration decision for Biotalys’ EVOCA, a protein-based biofungicide designed to target fungal pathogens such as botrytis and powdery mildew in fruits and vegetables. The product features a new mode of action, and its active ingredient has been exempted from residue tolerance limits, emphasizing its safety profile.
- July 2025: UPL Corp Australia introduced Thiopron, a biofungicide for grapevines, at WineTech 2025. The product is designed to address fungal diseases such as powdery mildew and serves as a sustainable alternative to traditional fungicides, aligning with global and European trends in biological crop protection.
- January 2024: Certis Biologicals announced the launch of Convergence, a new biofungicide designed for use on corn, soybeans, and peanuts. The product integrates multiple microbial strains to provide broad-spectrum disease control and aligns with sustainable crop protection practices.


Global Biofungicides Market Report Scope
Cash Crops, Horticultural Crops, Row Crops are covered as segments by Crop Type. Africa, Asia-Pacific, Europe, Middle East, North America, South America are covered as segments by Region.Crop Type
| Cash Crops |
| Horticultural Crops |
| Row Crops |
Geography
| Africa | By Country | Egypt |
| Nigeria | ||
| South Africa | ||
| Rest of Africa | ||
| Asia-Pacific | By Country | Australia |
| China | ||
| India | ||
| Indonesia | ||
| Japan | ||
| Philippines | ||
| Thailand | ||
| Vietnam | ||
| Rest of Asia-Pacific | ||
| Europe | By Country | France |
| Germany | ||
| Italy | ||
| Netherlands | ||
| Russia | ||
| Spain | ||
| Turkey | ||
| United Kingdom | ||
| Rest of Europe | ||
| Middle East | By Country | Iran |
| Saudi Arabia | ||
| Rest of Middle East | ||
| North America | By Country | Canada |
| Mexico | ||
| United States | ||
| Rest of North America | ||
| South America | By Country | Argentina |
| Brazil | ||
| Rest of South America |
| Crop Type | Cash Crops | ||
| Horticultural Crops | |||
| Row Crops | |||
| Geography | Africa | By Country | Egypt |
| Nigeria | |||
| South Africa | |||
| Rest of Africa | |||
| Asia-Pacific | By Country | Australia | |
| China | |||
| India | |||
| Indonesia | |||
| Japan | |||
| Philippines | |||
| Thailand | |||
| Vietnam | |||
| Rest of Asia-Pacific | |||
| Europe | By Country | France | |
| Germany | |||
| Italy | |||
| Netherlands | |||
| Russia | |||
| Spain | |||
| Turkey | |||
| United Kingdom | |||
| Rest of Europe | |||
| Middle East | By Country | Iran | |
| Saudi Arabia | |||
| Rest of Middle East | |||
| North America | By Country | Canada | |
| Mexico | |||
| United States | |||
| Rest of North America | |||
| South America | By Country | Argentina | |
| Brazil | |||
| Rest of South America | |||


Market Definition
- AVERAGE DOSAGE RATE - The average application rate is the average volume of biofungicides applied per hectare of farmland in the respective region/country.
- CROP TYPE - Crop type includes Row crops (Cereals, Pulses, Oilseeds), Horticultural Crops (Fruits and vegetables) and Cash Crops (Plantation Crops, Fibre Crops and Other Industrial Crops)
- FUNCTION - The Crop Protection function of agirucultural biological include products that prevent or control various biotic and abiotic stress.
- TYPE - Biofungicides prevent or control disease-causing pests from causing crop damage and yield loss.
| Keyword | Definition |
|---|---|
| Cash Crops | Cash crops are non-consumable crops sold as a whole or part of the crop to manufacture end-products to make a profit. |
| Integrated Pest Management (IPM) | IPM is an environment-friendly and sustainable approach to control pests in various crops. It involves a combination of methods, including biological controls, cultural practices, and selective use of pesticides. |
| Bacterial biocontrol agents | Bacteria used to control pests and diseases in crops. They work by producing toxins harmful to the target pests or competing with them for nutrients and space in the growing environment. Some examples of commonly used bacterial biocontrol agents include Bacillus thuringiensis (Bt), Pseudomonas fluorescens, and Streptomyces spp. |
| Plant Protection Product (PPP) | A plant protection product is a formulation applied to crops to protect from pests, such as weeds, diseases, or insects. They contain one or more active substances with other co-formulants such as solvents, carriers, inert material, wetting agents or adjuvants formulated to give optimum product efficacy. |
| Pathogen | A pathogen is an organism causing disease to its host, with the severity of the disease symptoms. |
| Parasitoids | Parasitoids are insects that lay their eggs on or within the host insect, with their larvae feeding on the host insect. In agriculture, parasitoids can be used as a form of biological pest control, as they help to control pest damage to crops and decrease the need for chemical pesticides. |
| Entomopathogenic Nematodes (EPN) | Entomopathogenic nematodes are parasitic roundworms that infect and kill pests by releasing bacteria from their gut. Entomopathogenic nematodes are a form of biocontrol agents used in agriculture. |
| Vesicular-arbuscular mycorrhiza (VAM) | VAM fungi are mycorrhizal species of fungus. They live in the roots of different higher-order plants. They develop a symbiotic relationship with the plants in the roots of these plants. |
| Fungal biocontrol agents | Fungal biocontrol agents are the beneficial fungi that control plant pests and diseases. They are an alternative to chemical pesticides. They infect and kill the pests or compete with pathogenic fungi for nutrients and space. |
| Biofertilizers | Biofertilizers contain beneficial microorganisms that enhance soil fertility and promote plant growth. |
| Biopesticides | Biopesticides are natural/bio-based compounds used to manage agricultural pests using specific biological effects. |
| Predators | Predators in agriculture are the organisms that feed on pests and help control pest damage to the crops. Some common predator species used in agriculture include ladybugs, lacewings, and predatory mites. |
| Biocontrol agents | Biocontrol agents are living organisms used to control pests and diseases in agriculture. They are alternatives to chemical pesticides and are known for their lesser impact on the environment and human health. |
| Organic Fertilizers | Organic fertilizer is composed of animal or vegetable matter used alone or in combination with one or more non-synthetically derived elements or compounds used for soil fertility and plant growth. |
| Protein hydrolysates (PHs) | Protein hydrolysate-based biostimulants contain free amino acids, oligopeptides, and polypeptides produced by enzymatic or chemical hydrolysis of proteins, primarily from vegetal or animal sources. |
| Biostimulants/Plant Growth Regulators (PGR) | Biostimulants/Plant Growth Regulators (PGR) are substances derived from natural resources to enhance plant growth and health by stimulating plant processes (metabolism). |
| Soil Amendments | Soil Amendments are substances applied to soil that improve soil health, such as soil fertility and soil structure. |
| Seaweed Extract | Seaweed extracts are rich in micro and macronutrients, proteins, polysaccharides, polyphenols, phytohormones, and osmolytes. These substances boost seed germination and crop establishment, total plant growth and productivity. |
| Compounds related to biocontrol and/or promoting growth (CRBPG) | Compounds related to biocontrol or promoting growth (CRBPG) are the ability of a bacteria to produce compounds for phytopathogen biocontrol and plant growth promotion. |
| Symbiotic Nitrogen-Fixing Bacteria | Symbiotic nitrogen-fixing bacteria such as Rhizobium obtain food and shelter from the host, and in return, they help by providing fixed nitrogen to the plants. |
| Nitrogen Fixation | Nitrogen fixation is a chemical process in soil which converts molecular nitrogen into ammonia or related nitrogenous compounds. |
| ARS (Agricultural Research Service) | ARS is the U.S. Department of Agriculture's chief scientific in-house research agency. It aims to find solutions to agricultural problems faced by the farmers in the country. |
| Phytosanitary Regulations | Phytosanitary regulations imposed by the respective government bodies check or prohibit the importation and marketing of certain insects, plant species, or products of these plants to prevent the introduction or spread of new plant pests or pathogens. |
| Ectomycorrhizae (ECM) | Ectomycorrhiza (ECM) is a symbiotic interaction of fungi with the feeder roots of higher plants in which both the plant and the fungi benefit through the association for survival. |


Research Methodology
Mordor Intelligence follows a four-step methodology in all our reports.
- Step-1: Identify Key Variables: In order to build a robust forecasting methodology, the variables and factors identified in Step-1 are tested against available historical market numbers. Through an iterative process, the variables required for market forecast are set and the model is built on the basis of these variables.
- Step-2: Build a Market Model: Market-size estimations for the forecast years are in nominal terms. Inflation is not a part of the pricing, and the average selling price (ASP) is kept constant throughout the forecast period.
- Step-3: Validate and Finalize: In this important step, all market numbers, variables and analyst calls are validated through an extensive network of primary research experts from the market studied. The respondents are selected across levels and functions to generate a holistic picture of the market studied.
- Step-4: Research Outputs: Syndicated Reports, Custom Consulting Assignments, Databases & Subscription Platforms.


