Market Overview
| Study Period | 2018 - 2031 |
|---|---|
| Forecast Data Period | 2026 - 2031 |
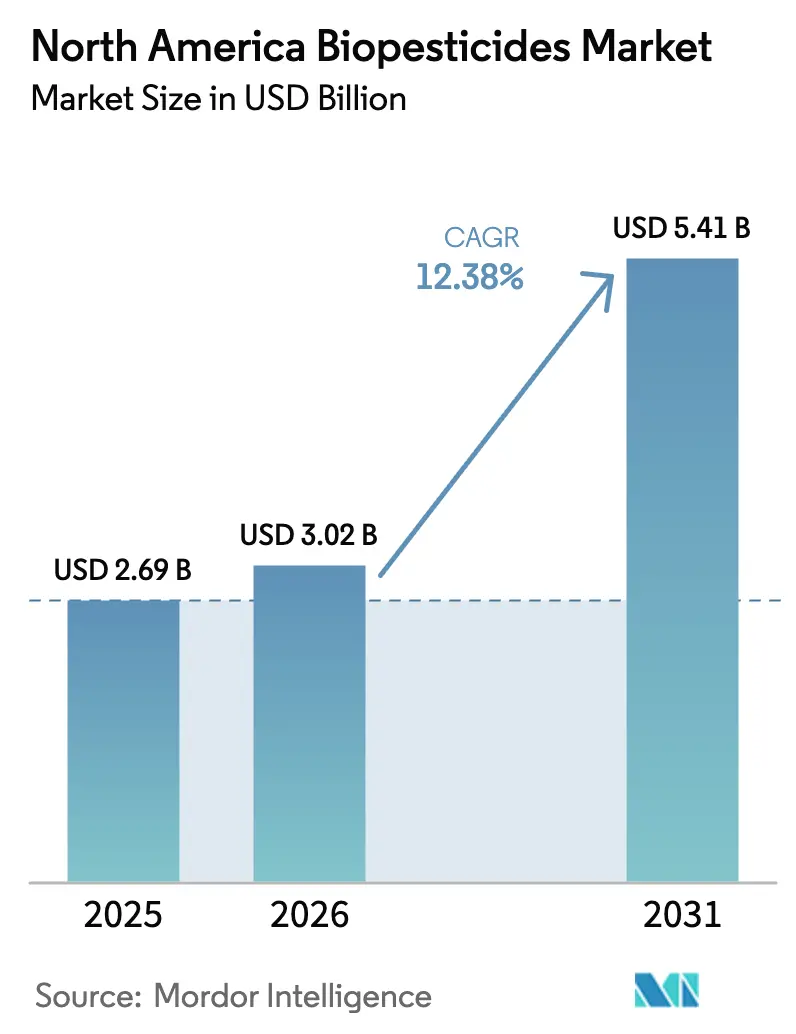
| Base Year Market Size (2025) | USD 2.69 Billion |
| Market Size (2026) | USD 3.02 Billion |
| Market Size (2031) | USD 5.41 Billion |
| Growth Rate (2026 - 2031) | 12.38% CAGR |
| Market Concentration | Low |
Major Players *Disclaimer: Major Players sorted in no particular order Image © Mordor Intelligence. Reuse requires attribution under CC BY 4.0. | |
North America Biopesticides Market Analysis by Mordor Intelligence
The North America biopesticides market size was valued at USD 2.69 billion in 2025 and estimated to grow from USD 3.02 billion in 2026 to reach USD 5.41 billion by 2031, at a CAGR of 12.38% during the forecast period (2026-2031). Uptake accelerates as growers replace broad-spectrum chemicals with residue-free biological agents that align with tightening Maximum Residue Limits in export destinations. Fast-track registrations from the United States Environmental Protection Agency (EPA) shorten time-to-market, while food-retailer zero-residue programs, greenhouse acreage expansion, and carbon-credit payments further stimulate adoption. Biological formulations now benefit from micro-encapsulation technologies that double shelf life and trim cold-chain costs, closing historical performance gaps with synthetics. Competitive intensity stays moderate because know-how, fermentation capacity, and regulatory expertise remain entry barriers even as new niche suppliers emerge.
Key Report Takeaways
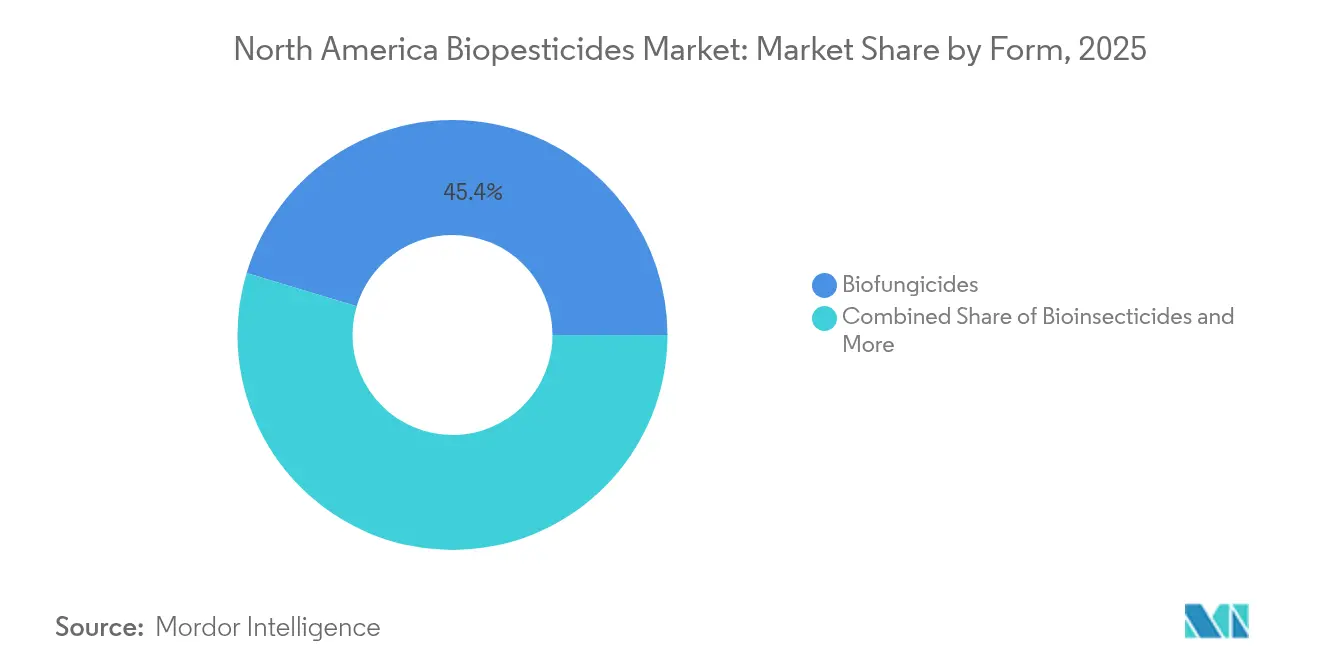
- By Form, biofungicides captured 45.35% of the North America biopesticides market share in 2025, while bioinsecticides are projected to register the fastest 14.03% CAGR through 2031.
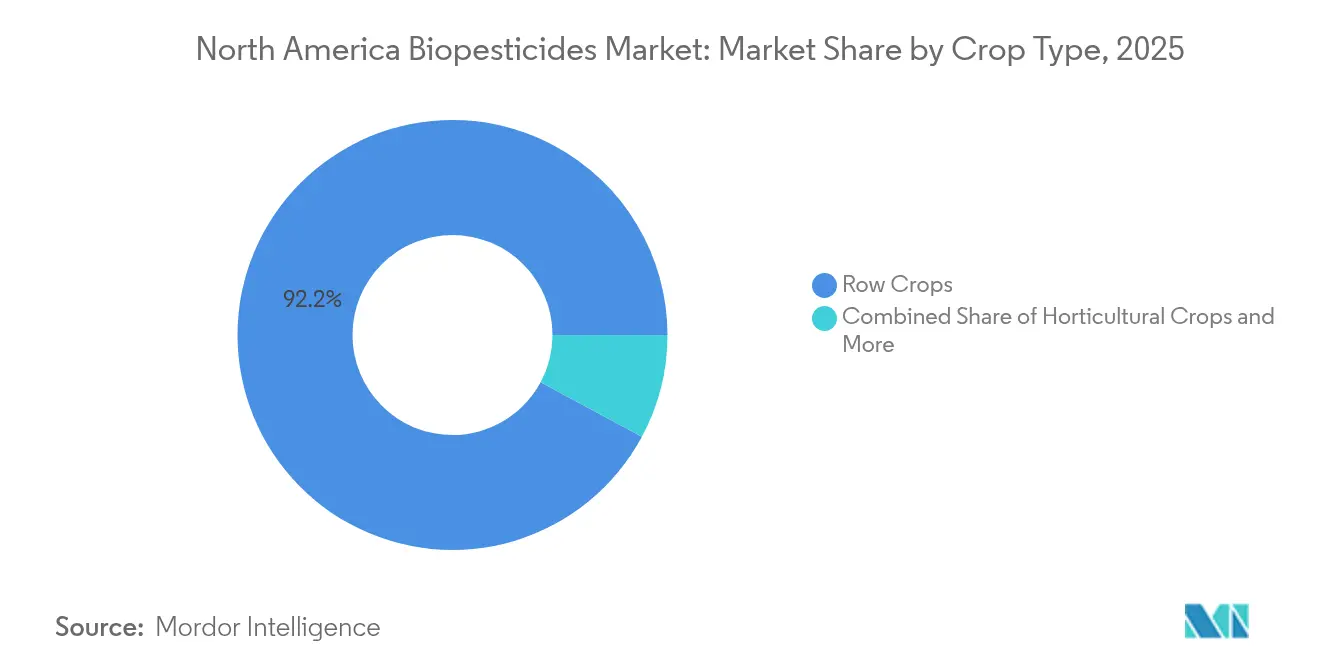
- By Crop Type, row crops accounted for 92.15% of the North America biopesticides market size in 2025 and are advancing at a 12.41% CAGR through 2031.
- By Geography, the United States held a dominant 68.74% revenue share in 2025, while Mexico is forecast to grow at a 14.05% CAGR to 2031.
Note: Market size and forecast figures in this report are generated using Mordor Intelligence’s proprietary estimation framework, updated with the latest available data and insights as of 2026.
North America Biopesticides Market Trends and Insights
Drivers Impact Analysis*
| Driver | (~) % Impact on CAGR Forecast | Geographic Relevance | Impact Timeline |
|---|---|---|---|
| Growing transition from chemical to residue-free crop-protection products | +3.2% | Global, with early adoption in California, Ontario, and Mexico's export regions | Medium term (2-4 years) |
| Regulatory fast-track approvals for biopesticide active ingredients | +2.8% | United States and Canada, limited impact in Mexico | Short term (≤ 2 years) |
| Expansion of controlled-environment agriculture acreage | +2.1% | North America core, concentrated in greenhouse clusters | Long term (≥ 4 years) |
| Advancements in micro-encapsulation and formulation technologies | +1.9% | Global, with R&D centers in North Carolina, Quebec, and California | Medium term (2-4 years) |
| Corporate sustainability pledges pushing grower adoption | +1.7% | United States and Canada, emerging in Mexico | Medium term (2-4 years) |
| Carbon-credit monetization for reduced chemical pesticide usage | +1.4% | United States primarily, pilot programs in Canada | Long term (≥ 4 years) |
| Source: Mordor Intelligence | |||
Growing Transition from Chemical to Residue-Free Crop-Protection Products
Pesticide-free produce has become a retail imperative as Walmart Incorporated adopted zero-residue sourcing standards in 2024, compelling suppliers to record measurable reductions in synthetic usage. High-value table grapes, berries, and leafy greens are under the greatest pressure because residue exceedances prompt shipment rejections. Export-oriented growers in Baja California, Florida, and British Columbia pre-emptively deploy Bacillus subtilis biofungicides and Beauveria bassiana bioinsecticides to comply with European Union thresholds. The trend strengthens integrated pest-management programs where biopesticides can be rotated to slow resistance development. As a result, many large agribusinesses now organize staff training modules focused on biological application timing and compatibility with existing crop-protection regimes.
Regulatory Fast-Track Approvals for Biopesticide Active Ingredients
The EPA’s Pesticide Registration Improvement Act (PRIA) limits review of biological submissions to 12 months, versus 36 months for synthetic chemicals [1]Source: United States Environmental Protection Agency, “Pesticide Registration Improvement Act,” epa.gov. Canada’s Pest Management Regulatory Agency (PMRA) offers a parallel fast-track process, while Mexico’s Servicio Nacional de Sanidad, Inocuidad y Calidad Agroalimentaria (SENASICA) retains traditional timelines that slow new entries. Accelerated clearances incentivize research and development investment in microorganisms such as Chromobacterium subtsugae and Trichoderma harzianum. Lower toxicology data requirements also cut development costs, letting mid-sized innovators compete with multinational firms. Consequently, launch pipelines for bioinsecticides and nematicides have swelled, shortening the innovation gap with synthetics.
Expansion of Controlled-Environment Agriculture Acreage
Controlled-environment agriculture (CEA), including greenhouses and vertical farms, grew 15% year on year in North America during 2024.[2]Source: United States Department of Agriculture, “Controlled-Environment Agriculture Research Initiative,” usda.gov Enclosed spaces amplify the efficacy of biologicals since temperature, humidity, and ultraviolet exposure are moderated, allowing beneficial fungi and bacteria to colonize plant surfaces effectively. Worker-safety regulations restrict chemical fumigants inside CEA structures, leaving biologicals as the practical alternative. Producers of greenhouse tomatoes and strawberries now integrate predator insects with entomopathogenic fungi to curtail whitefly and thrips outbreaks. The predictable microclimate also boosts return on investment for higher-priced formulations with extended residual activity.
Advancements in Micro-Encapsulation and Formulation Technologies
Encapsulation innovations stretch commercial shelf life from 18 to 36 months and allow storage at ambient temperatures.[3]Source: American Chemical Society, “Advances in Biopesticide Formulation Technology,” acs.org Corteva Agriscience obtained a United States Patent and Trademark Office (USPTO) patent in 2024 for a temperature-stable Bacillus thuringiensis coating that shields spores from oxidative stress. Such progress slashes refrigeration demand, which had added up to 30% to distribution expenses. Controlled-release capsules now synchronize spore germination with pest life cycles, elevating field efficacy and enabling fewer spray passes. Formulation science, therefore, narrows the convenience gap versus chemical counterparts, encouraging large retailers to stock biologicals through mainstream channels.
Restraints Impact Analysis*
| Restraint | (~) % Impact on CAGR Forecast | Geographic Relevance | Impact Timeline |
|---|---|---|---|
| Shorter shelf-life and cold-chain requirements | -2.3% | Global, particularly challenging in Mexico's distribution networks | Short term (≤ 2 years) |
| Limited field efficacy under extreme climatic conditions | -1.8% | Southwest United States, Northern Mexico, Prairie provinces | Medium term (2-4 years) |
| High price premiums over synthetic pesticides | -1.5% | Global, most pronounced in price-sensitive row crop applications | Short term (≤ 2 years) |
| Fragmented state-level registration requirements within the United States | -1.2% | United States exclusively, creating market entry barriers | Long term (≥ 4 years) |
| Source: Mordor Intelligence | |||
Shorter Shelf Life and Cold-Chain Requirements
Many microbial formulations lose viability at sustained temperatures above 30 °C, compelling manufacturers to use refrigerated freight in desert regions of Arizona and Chihuahua. Elevated logistics cost inflates retail prices by 15-20%, discouraging adoption among smallholders. Industry collaborations with cold-storage suppliers are expanding but remain uneven across rural distribution nodes. Advances in encapsulation are easing the constraint, yet tens of millions of acres still lack reliable chilled storage, limiting penetration in hot-climate field crops.
Limited Field Efficacy Under Extreme Climatic Conditions
Solar ultraviolet intensity and arid winds in the Sonoran Desert degrade microbial spores within hours, requiring repeat applications that erode cost competitiveness. Trials by the United States Department of Agriculture (USDA) in 2024 showed bioinsecticide mortality rates dropping 25% under heat spikes. Growers hedge by tank-mixing biologicals with low-toxicity synthetics, but split programs complicate residue-compliance paperwork. Product pipelines now prioritize UV blockers and humectants that protect spores, although commercial availability remains two to three seasons away.
*Our forecasts treat driver/restraint impacts as directional, not additive. The impact forecasts reflect baseline growth, mix effects, and variable interactions.
Segment Analysis
By Form: Bioinsecticides Drive Innovation While Biofungicides Maintain Dominance
Biofungicides commanded 45.35% of the North America biopesticides market share in 2025 due to proven control of soil and foliar pathogens that threaten high-value crops. Products based on Bacillus subtilis and Bacillus pumilus are widely used in fruit, vegetable, and ornamental sectors, where disease pressure and residue concerns intersect. The segment’s growth momentum is steady because new strains continuously improve disease suppression while registration pathways stay favorable. Micro-encapsulation has prolonged on-leaf persistence, enhancing protection during humid intervals when disease outbreaks peak. Integrated programs now rotate biological fungicides with reduced-risk synthetics to manage resistance without breaching retailer residue limits.
The bioinsecticide segment is set to grow at a 14.03% CAGR through 2031. Active ingredients such as Beauveria bassiana, Isaria fumosorosea, and Chromobacterium subtsugae offer targeted control of thrips, aphids, and lepidopteran larvae while preserving beneficial insects. Regulatory restrictions on neonicotinoids and pyrethroids accelerate market pull. Research consortia funded by greenhouse grower alliances focus on phage and viral bioinsecticides that promise single-application protection, highlighting the innovation trajectory. Market entrants often license university-developed strains, shortening discovery cycles and reinforcing a vibrant start-up ecosystem.


By Crop Type: Row Crops Dominate Despite Horticultural Innovation
Row crops absorbed 92.15% of biopesticide volumes in 2025, reflecting the vast acreage of corn, soybean, and cotton across the Midwest and Southern Plains. Seed-treatment formats anchor demand because they provide season-long root protection at planting, reducing the need for in-season foliar sprays. The North America biopesticides market size for row-crop seed treatments is projected to expand at a 12.41% CAGR as microbial consortia are blended with micronutrients that boost early vigor. Premium sensitivity persists, and adoption variability hinges on commodity price cycles.
Horticultural crops, although smaller in volume, present faster revenue growth. Greenhouse peppers, tomatoes, and cucumbers routinely deploy biologicals in enclosed systems where beneficial insect release pairs with microbial sprays to achieve zero-residue targets. Blueberry and almond orchards in California integrate Trichoderma biofungicides to suppress soil pathogens while supporting pollinator health, capturing grower premiums in export channels. Emerging biological nematicides address Meloidogyne infestations in root vegetables, creating new cross-sell opportunities for suppliers that specialize in nematode control.
Geography Analysis
The United States generated 68.74% of 2025 revenue due to advanced regulatory clarity and the concentration of organic acreage in California and Washington. California alone represented 35.0% of national consumption as state environmental rules tighten chemical options. The North America biopesticides market size, attributed to the United States greenhouse vegetables, is anticipated to grow significantly in the coming years as controlled-environment operators expand acreage near population centers.
Mexico marks the fastest regional expansion at 14.05% CAGR. Export-oriented producers in Sinaloa and Jalisco accelerate biological adoption to comply with European Union residue caps. SENASICA streamlined dossier formats, reducing the average registration time significantly. Supply chain cold-storage gaps continue to limit adoption in remote production zones. Government subsidy programs that reimburse a portion of the biological purchase price under the Program for Sustainable Agriculture further encourage demand.
Canada holds a significant revenue share, anchored by greenhouse hubs in Ontario and grain belts across Saskatchewan and Alberta. Canadian growers leverage Pest Management Regulatory Agency reciprocity with EPA registrations to gain quicker access to new strains. Adoption spreads from high-value greenhouse cucumbers into broad-acre canola, where biologicals now serve as seed-treatment partners that mitigate early root diseases. The rest of North America remains nascent but benefits from regional trade facilitation under the Canada-United States-Mexico Agreement (CUSMA).
Competitive Landscape
Corteva Agriscience led the supplier field in recent years, yet accounted for a small portion of total North America biopesticides revenue, underscoring the highly fragmented nature of this market. No other individual company held a significant share, and the combined share of the largest firms remained limited, leaving a long tail of numerous specialist producers that focus on single-pest or single-crop niches. Fragmentation reflects the large number of microbial strains, diverse crop targets, and the absence of one platform technology that can address all agronomic needs across climates.
Strategic moves, therefore, concentrate on micro-scale acquisitions and licensing deals rather than headline mergers. Marrone Bio Innovations licenses encapsulation patents to regional formulators, while Certis Biologicals extends private-label agreements with local distributors in the Great Plains to deepen route-to-market coverage. Biobest Group N.V. and Koppert B.V. both pursue partnerships with greenhouse vegetable cooperatives, exchanging biological inputs for pest-scouting data that enhance product refinements.
Incumbents defend pockets of influence through proprietary fermentation know-how and regulatory dossiers, yet start-ups leverage university research grants to introduce narrow-spectrum bioinsecticides that win fast-track approvals under the United States Environmental Protection Agency (EPA) biopesticide program. Digital agriculture firms such as Terramera Inc. integrate spore-viability sensors with drone-sprayer maps, lowering application costs and helping smaller brands build credibility. As climate-related pest shifts emerge, growers increasingly trial multiple biologicals each season, amplifying churn and preventing any supplier from locking in long-term share.
North America Biopesticides Industry Leaders
Corteva Agriscience
Certis Biologicals (Mitsui & Co., Ltd.)
Marrone Bio Innovations Inc. (Bioceres Crop Solutions Corp.)
Bioworks Inc.
Valent BioSciences LLC (Sumitomo Chemical Co., Ltd.)
- *Disclaimer: Major Players sorted in no particular order

Recent Industry Developments
- June 2025: BioWorks Inc. introduced PRINCIPLE WP, a bioinsecticide formulated with Beauveria bassiana, aimed at controlling pests such as thrips, aphids, and whiteflies. It is intended for application in greenhouse and field crops, providing growers in the U.S. and Canada with a sustainable and efficient pest management option.
- December 2024: UPL Corp (USA) introduced NIMAXXA, a microbial-based bionematicide seed treatment for soybeans and corn. The product provides triple protection by suppressing nematodes, enhancing root health, and improving nutrient uptake, supporting sustainable farming practices in the U.S. market.
- July 2024: Andermatt Group AG acquired BioTEPP Inc., a Canadian company recognized for its Virosoft CP4 granulovirus biopesticide, which targets codling moths. This acquisition enhances Andermatt’s presence in North America and broadens its biological crop protection portfolio.


North America Biopesticides Market Report Scope
The North America Biopesticides Market Report is Segmented by Form (Biofungicides, Bioherbicides, and Bioinsecticides), Crop Type (Cash Crops, Horticultural Crops, and Row Crops), and Geography (Canada, Mexico, and United States). The Market Forecasts are Provided in Terms of Value (USD) and Volume (Metric Tons).
Form
| Biofungicides |
| Bioherbicides |
| Bioinsecticides |
| Other Biopesticides |
Crop Type
| Cash Crops |
| Horticultural Crops |
| Row Crops |
Country
| Canada |
| Mexico |
| United States |
| Rest of North America |
| Form | Biofungicides |
| Bioherbicides | |
| Bioinsecticides | |
| Other Biopesticides | |
| Crop Type | Cash Crops |
| Horticultural Crops | |
| Row Crops | |
| Country | Canada |
| Mexico | |
| United States | |
| Rest of North America |


Market Definition
- AVERAGE DOSAGE RATE - The average application rate is the average volume of biopesticides applied per hectare of farmland in the respective region/country.
- CROP TYPE - Crop type includes Row crops (Cereals, Pulses, Oilseeds), Horticultural Crops (Fruits and vegetables) and Cash Crops (Plantation Crops, Fibre Crops and Other Industrial Crops)
- FUNCTION - The Crop Protection function of agirucultural biological include products that prevent or control various biotic and abiotic stress.
- TYPE - Biopesticides prevent or control various pests, including insects, diseases, and weeds, from causing crop damage and yield loss.
| Keyword | Definition |
|---|---|
| Cash Crops | Cash crops are non-consumable crops sold as a whole or part of the crop to manufacture end-products to make a profit. |
| Integrated Pest Management (IPM) | IPM is an environment-friendly and sustainable approach to control pests in various crops. It involves a combination of methods, including biological controls, cultural practices, and selective use of pesticides. |
| Bacterial biocontrol agents | Bacteria used to control pests and diseases in crops. They work by producing toxins harmful to the target pests or competing with them for nutrients and space in the growing environment. Some examples of commonly used bacterial biocontrol agents include Bacillus thuringiensis (Bt), Pseudomonas fluorescens, and Streptomyces spp. |
| Plant Protection Product (PPP) | A plant protection product is a formulation applied to crops to protect from pests, such as weeds, diseases, or insects. They contain one or more active substances with other co-formulants such as solvents, carriers, inert material, wetting agents or adjuvants formulated to give optimum product efficacy. |
| Pathogen | A pathogen is an organism causing disease to its host, with the severity of the disease symptoms. |
| Parasitoids | Parasitoids are insects that lay their eggs on or within the host insect, with their larvae feeding on the host insect. In agriculture, parasitoids can be used as a form of biological pest control, as they help to control pest damage to crops and decrease the need for chemical pesticides. |
| Entomopathogenic Nematodes (EPN) | Entomopathogenic nematodes are parasitic roundworms that infect and kill pests by releasing bacteria from their gut. Entomopathogenic nematodes are a form of biocontrol agents used in agriculture. |
| Vesicular-arbuscular mycorrhiza (VAM) | VAM fungi are mycorrhizal species of fungus. They live in the roots of different higher-order plants. They develop a symbiotic relationship with the plants in the roots of these plants. |
| Fungal biocontrol agents | Fungal biocontrol agents are the beneficial fungi that control plant pests and diseases. They are an alternative to chemical pesticides. They infect and kill the pests or compete with pathogenic fungi for nutrients and space. |
| Biofertilizers | Biofertilizers contain beneficial microorganisms that enhance soil fertility and promote plant growth. |
| Biopesticides | Biopesticides are natural/bio-based compounds used to manage agricultural pests using specific biological effects. |
| Predators | Predators in agriculture are the organisms that feed on pests and help control pest damage to the crops. Some common predator species used in agriculture include ladybugs, lacewings, and predatory mites. |
| Biocontrol agents | Biocontrol agents are living organisms used to control pests and diseases in agriculture. They are alternatives to chemical pesticides and are known for their lesser impact on the environment and human health. |
| Organic Fertilizers | Organic fertilizer is composed of animal or vegetable matter used alone or in combination with one or more non-synthetically derived elements or compounds used for soil fertility and plant growth. |
| Protein hydrolysates (PHs) | Protein hydrolysate-based biostimulants contain free amino acids, oligopeptides, and polypeptides produced by enzymatic or chemical hydrolysis of proteins, primarily from vegetal or animal sources. |
| Biostimulants/Plant Growth Regulators (PGR) | Biostimulants/Plant Growth Regulators (PGR) are substances derived from natural resources to enhance plant growth and health by stimulating plant processes (metabolism). |
| Soil Amendments | Soil Amendments are substances applied to soil that improve soil health, such as soil fertility and soil structure. |
| Seaweed Extract | Seaweed extracts are rich in micro and macronutrients, proteins, polysaccharides, polyphenols, phytohormones, and osmolytes. These substances boost seed germination and crop establishment, total plant growth and productivity. |
| Compounds related to biocontrol and/or promoting growth (CRBPG) | Compounds related to biocontrol or promoting growth (CRBPG) are the ability of a bacteria to produce compounds for phytopathogen biocontrol and plant growth promotion. |
| Symbiotic Nitrogen-Fixing Bacteria | Symbiotic nitrogen-fixing bacteria such as Rhizobium obtain food and shelter from the host, and in return, they help by providing fixed nitrogen to the plants. |
| Nitrogen Fixation | Nitrogen fixation is a chemical process in soil which converts molecular nitrogen into ammonia or related nitrogenous compounds. |
| ARS (Agricultural Research Service) | ARS is the U.S. Department of Agriculture's chief scientific in-house research agency. It aims to find solutions to agricultural problems faced by the farmers in the country. |
| Phytosanitary Regulations | Phytosanitary regulations imposed by the respective government bodies check or prohibit the importation and marketing of certain insects, plant species, or products of these plants to prevent the introduction or spread of new plant pests or pathogens. |
| Ectomycorrhizae (ECM) | Ectomycorrhiza (ECM) is a symbiotic interaction of fungi with the feeder roots of higher plants in which both the plant and the fungi benefit through the association for survival. |


Research Methodology
Mordor Intelligence follows a four-step methodology in all our reports.
- Step-1: Identify Key Variables: In order to build a robust forecasting methodology, the variables and factors identified in Step-1 are tested against available historical market numbers. Through an iterative process, the variables required for market forecast are set and the model is built on the basis of these variables.
- Step-2: Build a Market Model: Market-size estimations for the forecast years are in nominal terms. Inflation is not a part of the pricing, and the average selling price (ASP) is kept constant throughout the forecast period.
- Step-3: Validate and Finalize: In this important step, all market numbers, variables and analyst calls are validated through an extensive network of primary research experts from the market studied. The respondents are selected across levels and functions to generate a holistic picture of the market studied.
- Step-4: Research Outputs: Syndicated Reports, Custom Consulting Assignments, Databases & Subscription Platforms.


