Europe Agricultural Biologicals Market Size and Share
Market Overview
| Study Period | 2018 - 2031 |
|---|---|
| Forecast Data Period | 2026 - 2031 |
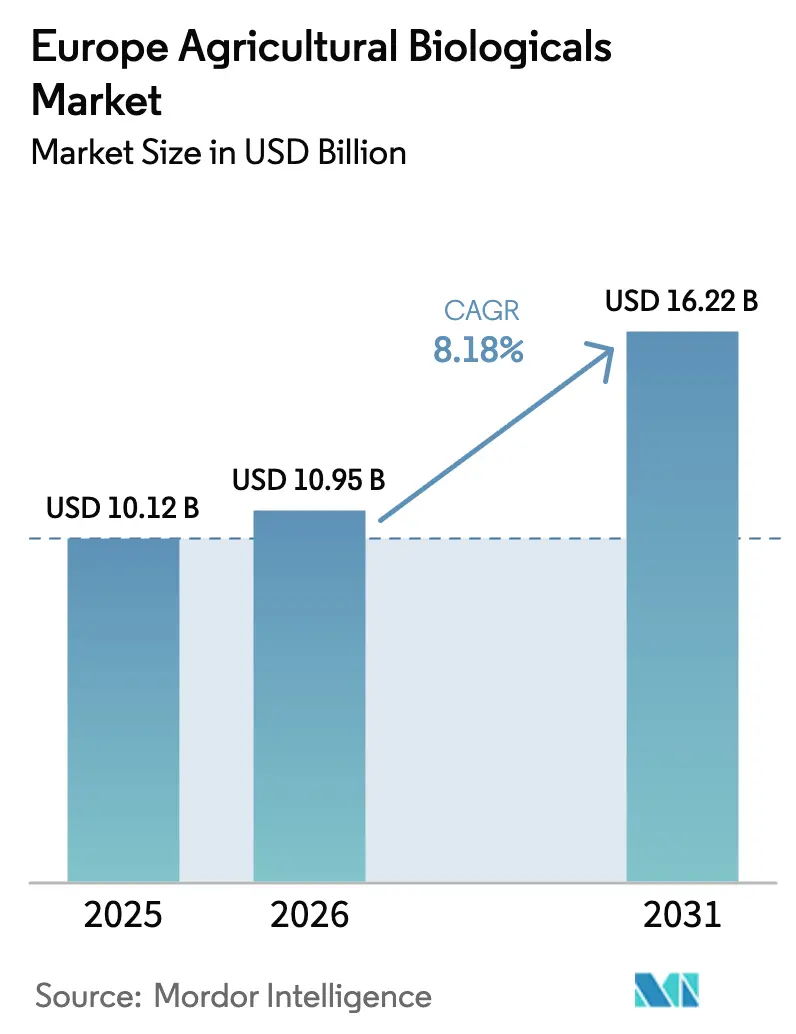
| Base Year Market Size (2025) | USD 10.12 Billion |
| Market Size (2026) | USD 10.95 Billion |
| Market Size (2031) | USD 16.22 Billion |
| Growth Rate (2026 - 2031) | 8.18% CAGR |
| Market Concentration | Low |
Major Players *Disclaimer: Major Players sorted in no particular order Image © Mordor Intelligence. Reuse requires attribution under CC BY 4.0. | |
Europe Agricultural Biologicals Market Analysis by Mordor Intelligence
The Europe agricultural biologicals market size is expected to grow from USD 10.12 billion in 2025 to USD 10.95 billion in 2026 and is forecast to reach USD 16.22 billion by 2031 at 8.18% CAGR over 2026-2031. This growth is driven by the European Union's Farm-to-Fork mandate, which aims to reduce chemical pesticide use by 50% by 2030, the ongoing conversion of farmland to certified organic status, and retailer initiatives requiring residue-free fresh produce. Demand is particularly strong in crop nutrition, where nitrogen-fixing and phosphorus-solubilizing microbes help reduce fertilizer costs while meeting stricter nutrient regulations. Crop protection is experiencing faster growth, supported by streamlined approval processes for biopesticides and the greenhouse fruit and vegetable sectors' focus on achieving zero detectable residues. Challenges such as performance variability in cooler soils, registration costs nearing USD 540,000 per active ingredient, and fermentation capacity constraints limit short-term growth. These challenges present opportunities for suppliers capable of developing cold-tolerant strains or securing dedicated fermentation facilities.
Key Report Takeaways
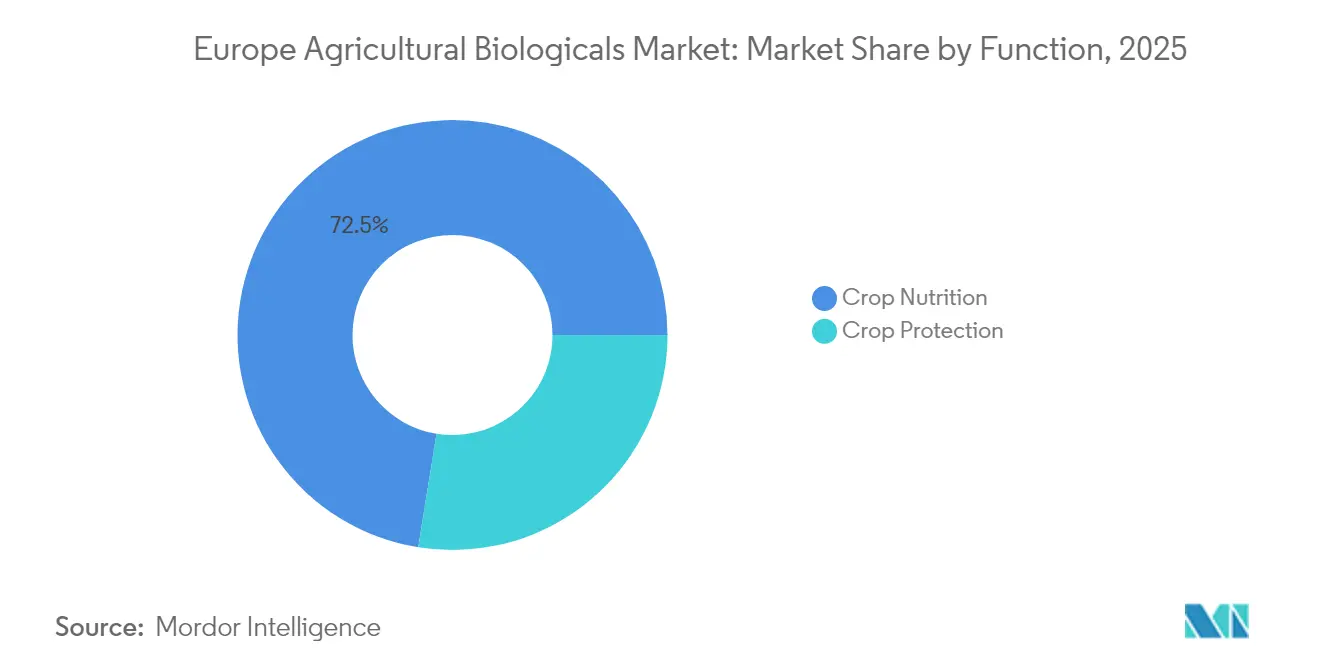
- By function, crop nutrition commanded 72.45% of the Europe agricultural biologicals market share in 2025, while crop protection is forecast to expand at a 9.64% CAGR through 2031.
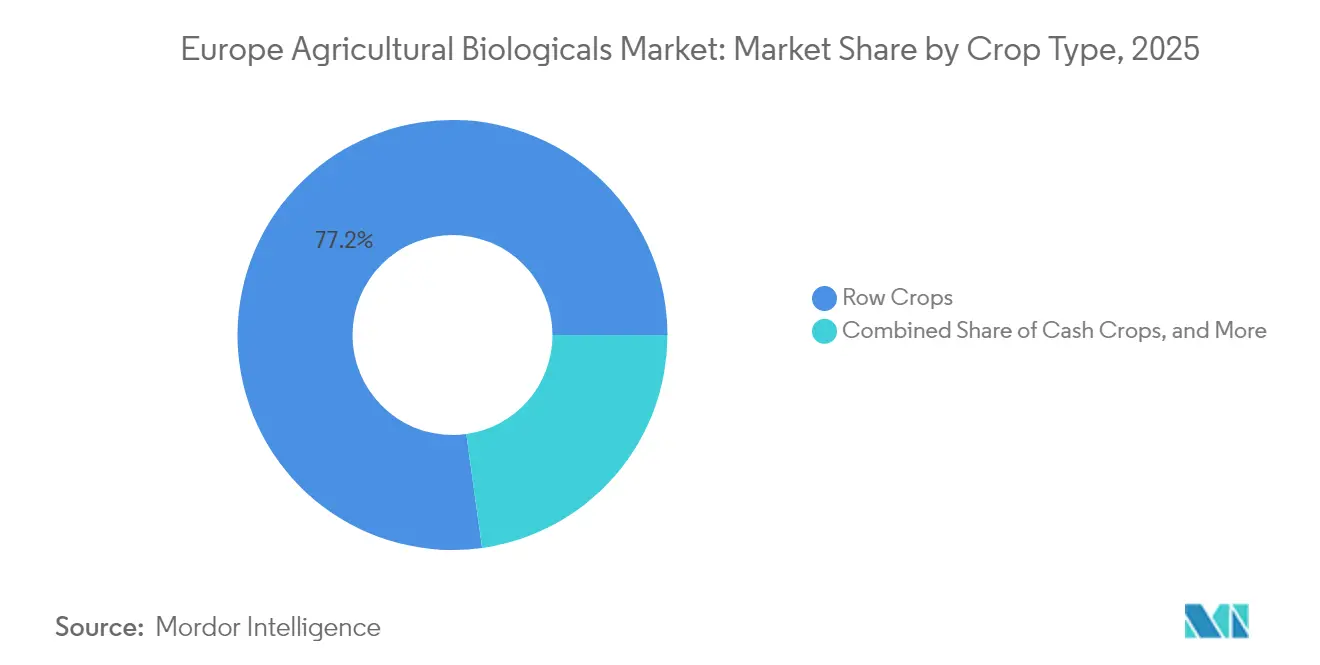
- By crop type, row crops held 77.20% of the Europe agricultural biologicals market share in 2025, whereas horticultural crops are set to post a 9.05% CAGR to 2031.
- By geography, France led with 16.70% share of the Europe agricultural biologicals market share in 2025 and is also forecast to expand at a 9.34% CAGR through 2031.
Note: Market size and forecast figures in this report are generated using Mordor Intelligence’s proprietary estimation framework, updated with the latest available data and insights as of 2026.
Europe Agricultural Biologicals Market Trends and Insights
Drivers Impact Analysis*
| Driver | (~) % Impact on CAGR Forecast | Geographic Relevance | Impact Timeline |
|---|---|---|---|
| European Union Farm-to-Fork Pesticide-Reduction Mandate | +2.1% | European Union, strongest in France, Germany, and Netherlands | Medium term (2-4 years) |
| Expansion of Certified Organic Farmland | +1.8% | Germany, France, Italy, Spain, and Austria | Long term (≥ 4 years) |
| Consumer Pull for Residue-Free Produce | +1.5% | Western Europe and growing in Central Europe | Medium term (2-4 years) |
| Fast-Track Biological Approvals Across European Countries | +1.3% | European Union with pilots in Netherlands and Denmark | Short term (≤ 2 years) |
| Retailer "Bio-Only" Sourcing Pledges | +1.0% | United Kingdom, Germany, France, and Netherlands | Medium term (2-4 years) |
| Carbon-Credit Monetization for Bio-Inputs | +0.9% | European Union, early movers in France and Netherlands | Long term (≥ 4 years) |
| Source: Mordor Intelligence | |||


European Union Farm-to-Fork Pesticide-Reduction Mandate
The binding target of a 50% reduction in pesticide use by 2030 establishes a regulatory baseline that synthetic chemicals cannot meet [1]Source: European Commission, “Farm to Fork Strategy,” europa.eu. France has implemented this target through the Ecophyto 2030 program, which ties USD 9.7 billion in subsidies to verified reductions in pesticide use, penalizing those who fail to comply. In Germany, the 2024 Plant Protection Act has banned the use of neonicotinoid seed treatments in cereals and oilseeds, encouraging the use of alternatives such as rhizosphere bacteria and entomopathogenic nematodes. The accelerated timeline for the 2030 target drives adoption but highlights supply chain challenges, as fermentation production is concentrated in Spain and the Netherlands. Suppliers capable of rapidly scaling production are well-positioned to gain an early advantage in the Europe agricultural biologicals market.
Expansion of Certified Organic Farmland
Organic acreage in the European Union reached 16.9 million hectares in 2024 and is projected to account for 25% of agricultural land by 2030 [2]Source: Eurostat, “Organic Farming Statistics,” ec.europa.eu. Germany leads with 1.9 million hectares, followed by France with 1.8 million hectares. Organic farming standards prohibit the use of synthetic inputs, ensuring a consistent demand for microbial inoculants, seaweed extracts, and biofungicides. Italy's organic wine acreage increased by 12% in 2024, driven by the adoption of copper-reducing biofungicides to meet the European Union's 4 kg/ha limit on copper usage. While this expansion supports long-term growth in volume, it also puts pressure on the limited fermentation capacity and increases input costs, posing challenges for smaller formulators that lack vertical integration.
Consumer Pull for Residue-Free Produce
A 2024 survey conducted by the European Food Safety Authority (EFSA) revealed that 68% of German consumers and 62% of French consumers are willing to pay a 15-20% premium for vegetables certified as residue-free [3]Source: European Food Safety Authority, “Biological Pesticides,” efsa.europa.eu. This highlights a growing consumer preference for safer and more sustainable agricultural practices. In response, retailers such as Rewe and Carrefour require growers to provide spray records that verify the exclusive use of biological methods. This shift has prompted significant changes in agricultural practices. In Spain, greenhouses in Almería transitioned 18% of tomato and pepper acreage to full biocontrol programs in 2024, utilizing Amblyseius swirskii mites and Beauveria bassiana sprays to comply with private-label standards. These programs aim to reduce chemical residues while maintaining crop productivity and yield. While this consumer-driven demand is extending beyond horticulture, adoption in row crops remains limited due to economic constraints, as the cost-effectiveness of such methods in large-scale farming is yet to be fully realized.
Fast-Track Biological Approvals Across European Countries
In 2024, the European Food Safety Authority (EFSA) introduced a dossier pathway that reduces data requirements by 30% for organisms approved in two member states, decreasing registration time from 24 months to 14 months and costs from USD 540,000 to USD 378,000. The Netherlands permits mutual recognition within 90 days, while Denmark provides provisional registrations prior to a full European Union review. These reduced barriers enable smaller innovators to enter the European agricultural biologicals market more quickly. The reliance on lighter data sets may lead to inconsistent field performance, potentially affecting grower confidence.
Restraints Impact Analysis*
| Restraint | (~) % Impact on CAGR Forecast | Geographic Relevance | Impact Timeline |
|---|---|---|---|
| Lengthy European Union Microbial Registration Timelines | -1.2% | European Union, especially Germany, France, and Italy | Medium term (2-4 years) |
| Field-Efficacy Variability in Temperate Climates | -0.9% | Northern Europe including United Kingdom, Germany, Poland, and Scandinavia | Short term (≤ 2 years) |
| Fermentation-Grade Capacity Bottlenecks | -0.7% | European Union with assets concentrated in Spain and Netherlands | Medium term (2-4 years) |
| Consolidated Distributors Squeezing Shelf Space | -0.5% | France, Germany, the United Kingdom, and Netherlands | Long term (≥ 4 years) |
| Source: Mordor Intelligence | |||
Lengthy European Union Microbial Registration Timelines
Even under the fast-track route, dossiers can cost up to USD 540,000 and may take up to 18 months for review. In 2024, Germany's regulator rejected 22% of applications due to insufficient field data, resulting in an additional year of trials. This highlights the stringent regulatory environment in Germany, which poses challenges for companies attempting to bring new products to market. The French Agency for Food, Environmental and Occupational Health and Safety, required supplemental toxicology data for 18% of biofertilizer submissions, resulting in an additional USD 162,000 in costs. These requirements reflect the increasing focus on safety and environmental impact in the European agricultural sector. While large multinationals can manage these expenses, smaller firms often delay product launches or exit the market, hindering the pace of innovation in the European agricultural biologicals market.
Field-Efficacy Variability in Temperate Climates
Soil temperatures below 10°C reduce microbial colonization, thereby limiting effectiveness. Trials conducted by Wageningen demonstrated that Bacillus subtilis reduced late blight by only 42% in Dutch potatoes, compared to 78% in Mediterranean fields. This significant difference highlights the impact of regional climatic conditions on microbial performance. In 2024, wheat growers in the United Kingdom reported nitrogen fixation rates that were 25% lower than the label claims, necessitating late synthetic top-dressing to meet crop nutrient requirements. Suppliers are developing cold-tolerant strains and employing encapsulation techniques to address these challenges; these measures increase costs by 15-20% and require additional regulatory approvals, potentially delaying the widespread adoption of these technologies.
*Our forecasts treat driver/restraint impacts as directional, not additive. The impact forecasts reflect baseline growth, mix effects, and variable interactions.
Segment Analysis
By Function: Crop Nutrition Dominance Anchors Revenue
Crop nutrition applications accounted for 72.45% of the Europe agricultural biologicals market share in 2025. This growth was driven by nitrogen-fixing rhizobia, azospirillum, and phosphorus-mobilizing mycorrhizae, which assist growers in adhering to the Nitrates Directive cap of 170 kg N/ha. Biofertilizers have gained traction as French wheat and German barley producers reduced synthetic nitrogen usage without compromising yields. Additionally, seaweed extract and humic acid biostimulants expanded their presence in Spain’s olive and citrus groves in 2024, helping to mitigate drought stress and enhance fruit size. Despite the broad nutrition base, commoditization has exerted pressure on pricing. Buyers demand agronomic evidence, compelling suppliers to fund multi-site trials, which in turn impacts profit margins.
Crop protection is the fastest-growing function in the market, with a projected CAGR of 9.64% through 2031. Simplified regulatory dossiers have facilitated market entry, while retailers increasingly demand zero-residue solutions. Bioinsecticides, led by Bacillus thuringiensis and spinosad, dominated the segment, covering 94% of Dutch greenhouse tomatoes in 2024. Biofungicides, including Trichoderma and Bacillus subtilis, reduced copper fungicide usage by 28% in French vineyards during the same year. Early-stage bioherbicides utilizing pelargonic acid have received organic approval in Switzerland and are projected to gain European Union clearance by 2026. Macrobials, such as predatory mites, now protect 82% of Dutch tomato hectares, with adoption rising in Spanish peppers and cucumbers. Suppliers offering integrated programs that combine nutrition and protection biologicals are differentiating themselves and fostering channel loyalty.


By Crop Type: Row Crop Meets Horticultural Value
Row crops represented 77.20% of the Europe agricultural biologicals market size in 2025, driven by the extensive cultivation of wheat, barley, corn, and oilseeds across the region. Wheat producers in France and Germany applied azospirillum and phosphate-solubilizing bacteria across 2.4 million hectares, reducing synthetic nitrogen usage by 20–30% while maintaining grain protein targets. In Poland and Romania, oilseed rape farmers doubled rhizobium inoculation rates between 2022 and 2024, supported by a 50% subsidy program. Maize growers in Italy’s Po Valley utilized mycorrhizae to reduce phosphate fertilizer use by 18% in alkaline soils. Despite the high volume of row crop applications, the per-hectare expenditure remains lower compared to horticulture, which limits the revenue potential for suppliers in this segment.
Horticultural crops are projected to achieve a 9.05% CAGR, supported by greenhouse vegetables, berries, and fruit orchards, where retailers enforce strict zero-tolerance residue policies. In Spain’s Almería region, biological input spending increased by 19% in 2024 across 31,000 hectares of tomatoes, peppers, and cucumbers. The Netherlands achieved 94% biological pest control coverage in tomato greenhouses by combining Amblyseius swirskii and Macrolophus pygmaeus predators. In France, apple orchards replaced 32% of synthetic insecticide applications with mating-disruption pheromones and Bacillus-based formulations in 2024. Italian vineyards in Tuscany and Piedmont applied seaweed biostimulants on 24% of their hectares to enhance drought resilience. The higher value of horticultural crops allows growers to absorb the premium costs of biological inputs, making this segment a lucrative market for suppliers.
Geography Analysis
France commanded the largest individual country share at 16.70% in 2025, and the segment is set to compound at 9.34% CAGR to 2031 under the Ecophyto 2030 scheme, which links EUR 9 billion (USD 9.7 billion) of payments to verifiable pesticide cuts. The country’s 1.8 million ha of certified organic farmland anchors baseline demand for biofertilizers and biopesticides. Bordeaux, Burgundy, and Champagne vineyards trimmed copper fungicide use by 28% in 2024 by integrating Trichoderma and Bacillus biofungicides, while cereal growers captured 120,000 carbon credits through nitrogen-fixing bacteria adoption. France’s leadership is reinforced by fast-track dossier teams within the French Agency for Food, Environmental and Occupational Health & Safety (ANSES) that processed 14 new microbial registrations in 2024, shortening time-to-market for local innovators.
Germany remains the second-largest country market, supported by 1.9 million ha of organic area and a 2024 Plant Protection Act amendment that bans neonicotinoid seed treatments and pushes growers toward rhizosphere bacteria and beneficial nematodes. Italy and Spain follow, driven by premium horticulture and wine. Italy’s organic wine acreage rose 12% in 2024, relying on copper-reducing biofungicides to satisfy strict appellation rules. Spain’s Almería greenhouse cluster lifted biological input spend 19% across 31,000 ha to meet retailer residue-free standards, pairing Amblyseius swirskii mites with microbial sprays. The Netherlands keeps world-leading penetration in greenhouse tomatoes, but lags in field cereals, where cool soils suppress microbial colonization. The United Kingdom accelerates adoption as Tesco’s 2024 pledge moves all contracted vegetables to bio-only programs by 2028, covering 12,000 ha.
The countries, including Poland, Romania, Turkey, and Russia, retained a combined share in 2025, but no single country within that group exceeded France’s 16.70%. Poland reimburses a major share of biological input costs on farms under 100 ha, doubling cereal and oilseed inoculation rates to 26% of acreage by 2024. Romania’s greenhouse vegetable sector deployed Bacillus thuringiensis and predatory mites on 18% of tomato and pepper hectares to meet export rules. Turkey’s 680,000 ha of organic land drives demand in hazelnuts, figs, and cotton. Russia’s use is nascent because of limited registration frameworks, yet domestic producers are scaling to serve 1.5 million ha of organic area.
Competitive Landscape
The Europe agricultural biologicals market is fragmented, with the top five suppliers, Koppert Biological Systems B.V., Biolchim S.p.A. (J.M. Huber Corporation), Agronutrition SAS (DE SANGOSSE Group), Trade Corporation International, S.A. (Rovensa Group), and Symborg, Inc. (Corteva Agriscience), accounting for a minor combined revenue share in 2024. This reflects the region's distinctive local agronomy needs and channel fragmentation. Multinational agrochemical companies are increasingly acquiring specialist biocontrol firms to offer bundled solutions that combine reduced-rate synthetic products with biologicals. Bayer expanded its portfolio through a 2025 German acquisition, adding seaweed extract and amino acid products, enabling the integration of mineral fertilizers with stress-mitigating biostimulants. Similarly, BASF invested USD 194 million in a 20,000 metric tons fermentation plant in France to address capacity constraints and ensure a steady supply of Bacillus-based fungicides.
Innovation efforts in the market are centered on developing cold-tolerant strains and encapsulation technologies to reduce variability in efficacy. A Dutch biotech company filed a European patent in 2024 for a microcapsule that maintains Trichoderma viability for 90 days in cool soils, tripling the current benchmarks. In 2025, Koppert introduced a digital scouting platform that integrates image analytics with biological prescriptions, aiming to enhance precision in timing and dosage. Additionally, venture capital is supporting vertical farming companies that are backward-integrating into beneficial insect rearing, enabling direct sales to greenhouse customers and bypassing traditional distribution channels.
Consolidation in distribution channels poses significant challenges for new entrants. InVivo’s 2024 cooperative roll-up resulted in 2,800 points of sale and exclusive partnerships with BASF and Bayer, limiting shelf space for independent players. In 2025, BayWa introduced bundled input packages that incentivized growers to purchase seeds, fertilizers, and biologicals from a single vendor, offering price discounts and thereby increasing the market share of larger suppliers. Smaller brands are responding by forming alliances or adopting direct-to-farmer e-commerce strategies. Both approaches require substantial commercial investments, which can divert resources from research and development budgets.
Europe Agricultural Biologicals Industry Leaders
Koppert Biological Systems B.V.
Biolchim S.p.A. (J.M. Huber Corporation)
Agronutrition SAS (DE SANGOSSE Group)
Trade Corporation International, S.A. (Rovensa Group)
Symborg, Inc. (Corteva Agriscience)
- *Disclaimer: Major Players sorted in no particular order


Recent Industry Developments
- June 2025: Bayer and Kimitec have introduced two new biological products resulting from their partnership: Ambition Complete Gen2 and Ambition Secure Gen2. Both products are currently undergoing regulatory approval and are part of Bayer’s Crop Performance Enhancer portfolio, reflecting the company's commitment to regenerative agricultural solutions in Spain.
- June 2025: Koppert has entered into a strategic partnership with Insect Science, designating the company as its preferred supplier of semiochemical solutions. This collaboration marks a significant step forward in the development of sustainable pest management tools for farmers worldwide. The agreement, based in the Netherlands, underscores a mutual commitment to fostering innovation in sustainable agriculture.
- October 2024: Elicit Plant, a company specializing in agricultural biosolutions, has partnered with BASF France Agro Division, a prominent provider of agricultural solutions, for the 2024-25 campaign. This collaboration aims to advance the development of the biostimulants EliSun-a and EliGrain-a, tailored for the sunflower and cereal markets in France.


Europe Agricultural Biologicals Market Report Scope
Crop Nutrition, Crop Protection are covered as segments by Function. Cash Crops, Horticultural Crops, Row Crops are covered as segments by Crop Type. France, Germany, Italy, Netherlands, Russia, Spain, Turkey, United Kingdom are covered as segments by Country.
| Crop Nutrition | Biofertilizer | Azospirillum |
| Azotobacter | ||
| Mycorrhiza | ||
| Phosphate-Solubilizing Bacteria | ||
| Rhizobium | ||
| Other Biofertilizers | ||
| Biostimulants | Amino Acids | |
| Fulvic Acid | ||
| Humic Acid | ||
| Protein Hydrolysates | ||
| Seaweed Extracts | ||
| Other Biostimulants | ||
| Organic Fertilizer | Manure | |
| Meal Based Fertilizers | ||
| Oilcakes | ||
| Other Organic Fertilizers | ||
| Crop Protection | Biocontrol Agents | Macrobials |
| Microbials | ||
| Biopesticides | Biofungicides | |
| Bioherbicides | ||
| Bioinsecticides | ||
| Other Biopesticides | ||
| Cash Crops |
| Horticultural Crops |
| Row Crops |
| France |
| Germany |
| Italy |
| Netherlands |
| Russia |
| Spain |
| Turkey |
| United Kingdom |
| Rest of Europe |
| By Function | Crop Nutrition | Biofertilizer | Azospirillum |
| Azotobacter | |||
| Mycorrhiza | |||
| Phosphate-Solubilizing Bacteria | |||
| Rhizobium | |||
| Other Biofertilizers | |||
| Biostimulants | Amino Acids | ||
| Fulvic Acid | |||
| Humic Acid | |||
| Protein Hydrolysates | |||
| Seaweed Extracts | |||
| Other Biostimulants | |||
| Organic Fertilizer | Manure | ||
| Meal Based Fertilizers | |||
| Oilcakes | |||
| Other Organic Fertilizers | |||
| Crop Protection | Biocontrol Agents | Macrobials | |
| Microbials | |||
| Biopesticides | Biofungicides | ||
| Bioherbicides | |||
| Bioinsecticides | |||
| Other Biopesticides | |||
| By Crop Type | Cash Crops | ||
| Horticultural Crops | |||
| Row Crops | |||
| By Geography | France | ||
| Germany | |||
| Italy | |||
| Netherlands | |||
| Russia | |||
| Spain | |||
| Turkey | |||
| United Kingdom | |||
| Rest of Europe | |||


Market Definition
- AVERAGE DOSAGE RATE - The average application rate is the average volume of agricultural biologicals applied per hectare of farmland in the respective region/country.
- CROP TYPE - Crop type includes Row crops (Cereals, Pulses, Oilseeds), Horticultural Crops (Fruits and vegetables) and Cash Crops (Plantation Crops, Fibre Crops and Other Industrial Crops)
- FUNCTION - Agricultural biological products provide crops with essential nutrients, prevent or control abiotic & biotic stresses, and enhance soil quality.
- TYPE - The Crop Nutrition function of agricultural biologicals includes organic fertilizer and Biofertilizer, whereas the Crop Protection function includes Biostimulants, Biopesticides and Biocontrol Agents.
| Keyword | Definition |
|---|---|
| Cash Crops | Cash crops are non-consumable crops sold as a whole or part of the crop to manufacture end-products to make a profit. |
| Integrated Pest Management (IPM) | IPM is an environment-friendly and sustainable approach to control pests in various crops. It involves a combination of methods, including biological controls, cultural practices, and selective use of pesticides. |
| Bacterial biocontrol agents | Bacteria used to control pests and diseases in crops. They work by producing toxins harmful to the target pests or competing with them for nutrients and space in the growing environment. Some examples of commonly used bacterial biocontrol agents include Bacillus thuringiensis (Bt), Pseudomonas fluorescens, and Streptomyces spp. |
| Plant Protection Product (PPP) | A plant protection product is a formulation applied to crops to protect from pests, such as weeds, diseases, or insects. They contain one or more active substances with other co-formulants such as solvents, carriers, inert material, wetting agents or adjuvants formulated to give optimum product efficacy. |
| Pathogen | A pathogen is an organism causing disease to its host, with the severity of the disease symptoms. |
| Parasitoids | Parasitoids are insects that lay their eggs on or within the host insect, with their larvae feeding on the host insect. In agriculture, parasitoids can be used as a form of biological pest control, as they help to control pest damage to crops and decrease the need for chemical pesticides. |
| Entomopathogenic Nematodes (EPN) | Entomopathogenic nematodes are parasitic roundworms that infect and kill pests by releasing bacteria from their gut. Entomopathogenic nematodes are a form of biocontrol agents used in agriculture. |
| Vesicular-arbuscular mycorrhiza (VAM) | VAM fungi are mycorrhizal species of fungus. They live in the roots of different higher-order plants. They develop a symbiotic relationship with the plants in the roots of these plants. |
| Fungal biocontrol agents | Fungal biocontrol agents are the beneficial fungi that control plant pests and diseases. They are an alternative to chemical pesticides. They infect and kill the pests or compete with pathogenic fungi for nutrients and space. |
| Biofertilizers | Biofertilizers contain beneficial microorganisms that enhance soil fertility and promote plant growth. |
| Biopesticides | Biopesticides are natural/bio-based compounds used to manage agricultural pests using specific biological effects. |
| Predators | Predators in agriculture are the organisms that feed on pests and help control pest damage to the crops. Some common predator species used in agriculture include ladybugs, lacewings, and predatory mites. |
| Biocontrol agents | Biocontrol agents are living organisms used to control pests and diseases in agriculture. They are alternatives to chemical pesticides and are known for their lesser impact on the environment and human health. |
| Organic Fertilizers | Organic fertilizer is composed of animal or vegetable matter used alone or in combination with one or more non-synthetically derived elements or compounds used for soil fertility and plant growth. |
| Protein hydrolysates (PHs) | Protein hydrolysate-based biostimulants contain free amino acids, oligopeptides, and polypeptides produced by enzymatic or chemical hydrolysis of proteins, primarily from vegetal or animal sources. |
| Biostimulants/Plant Growth Regulators (PGR) | Biostimulants/Plant Growth Regulators (PGR) are substances derived from natural resources to enhance plant growth and health by stimulating plant processes (metabolism). |
| Soil Amendments | Soil Amendments are substances applied to soil that improve soil health, such as soil fertility and soil structure. |
| Seaweed Extract | Seaweed extracts are rich in micro and macronutrients, proteins, polysaccharides, polyphenols, phytohormones, and osmolytes. These substances boost seed germination and crop establishment, total plant growth and productivity. |
| Compounds related to biocontrol and/or promoting growth (CRBPG) | Compounds related to biocontrol or promoting growth (CRBPG) are the ability of a bacteria to produce compounds for phytopathogen biocontrol and plant growth promotion. |
| Symbiotic Nitrogen-Fixing Bacteria | Symbiotic nitrogen-fixing bacteria such as Rhizobium obtain food and shelter from the host, and in return, they help by providing fixed nitrogen to the plants. |
| Nitrogen Fixation | Nitrogen fixation is a chemical process in soil which converts molecular nitrogen into ammonia or related nitrogenous compounds. |
| ARS (Agricultural Research Service) | ARS is the U.S. Department of Agriculture's chief scientific in-house research agency. It aims to find solutions to agricultural problems faced by the farmers in the country. |
| Phytosanitary Regulations | Phytosanitary regulations imposed by the respective government bodies check or prohibit the importation and marketing of certain insects, plant species, or products of these plants to prevent the introduction or spread of new plant pests or pathogens. |
| Ectomycorrhizae (ECM) | Ectomycorrhiza (ECM) is a symbiotic interaction of fungi with the feeder roots of higher plants in which both the plant and the fungi benefit through the association for survival. |


Research Methodology
Mordor Intelligence follows a four-step methodology in all our reports.
- Step-1: Identify Key Variables: In order to build a robust forecasting methodology, the variables and factors identified in Step-1 are tested against available historical market numbers. Through an iterative process, the variables required for market forecast are set and the model is built on the basis of these variables.
- Step-2: Build a Market Model: Market-size estimations for the forecast years are in nominal terms. Inflation is not a part of the pricing, and the average selling price (ASP) is kept constant throughout the forecast period.
- Step-3: Validate and Finalize: In this important step, all market numbers, variables and analyst calls are validated through an extensive network of primary research experts from the market studied. The respondents are selected across levels and functions to generate a holistic picture of the market studied.
- Step-4: Research Outputs: Syndicated Reports, Custom Consulting Assignments, Databases & Subscription Platforms.


