Africa Biopesticides Market Size and Share
Market Overview
| Study Period | 2018 - 2031 |
|---|---|
| Forecast Data Period | 2026 - 2031 |
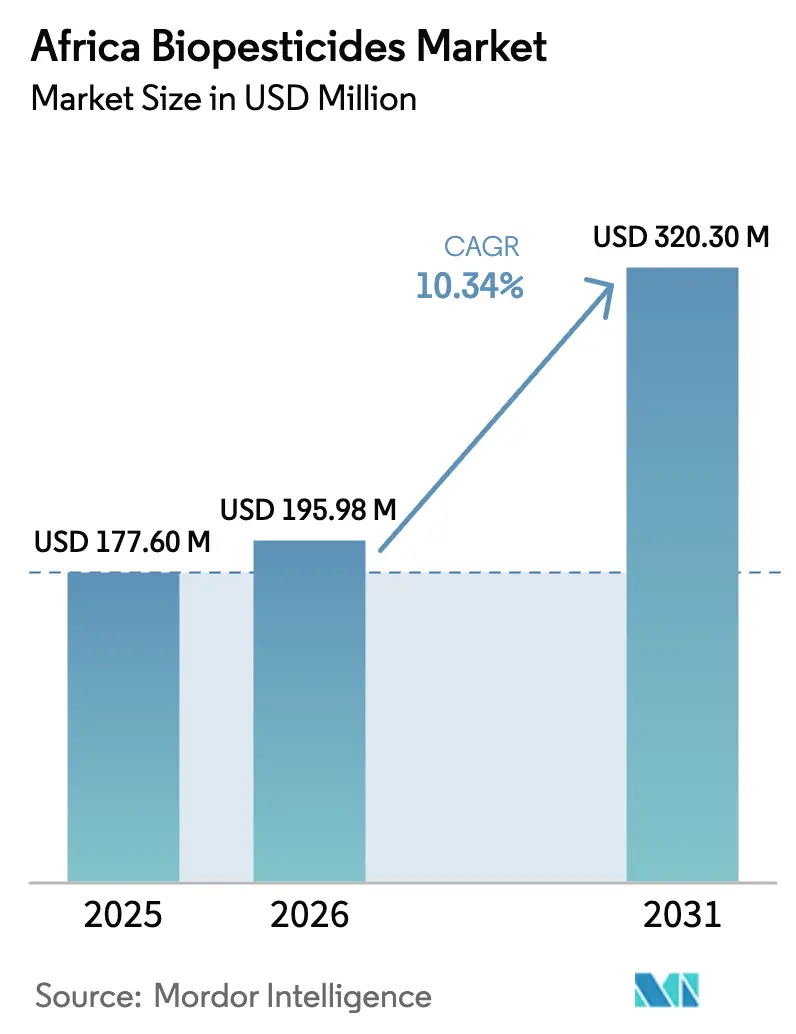
| Base Year Market Size (2025) | USD 177.6 Million |
| Market Size (2026) | USD 195.98 Million |
| Market Size (2031) | USD 320.3 Million |
| Growth Rate (2026 - 2031) | 10.34% CAGR |
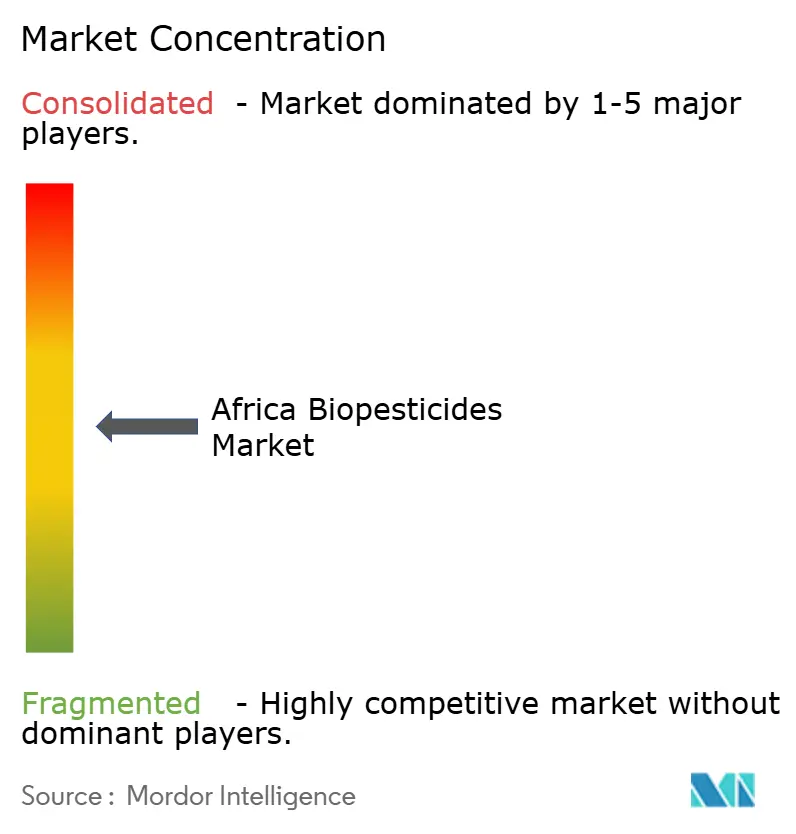
| Market Concentration | Medium |
Major Players *Disclaimer: Major Players sorted in no particular order Image © Mordor Intelligence. Reuse requires attribution under CC BY 4.0. | |
Africa Biopesticides Market Analysis by Mordor Intelligence
The Africa biopesticides market size in 2026 is estimated at USD 195.98 million, growing from 2025 value of USD 177.6 million with 2031 projections showing USD 320.3 million, growing at 10.34% CAGR over 2026-2031. Rapid growth is driven by residue-limit compliance for export crops, intensifying pest resistance, and government subsidy programs that lower farmer adoption hurdles. Cash-crop plantations, controlled-environment farms, and digital agronomy services are catalyzing demand, while microbial fermentation advances shorten product development cycles and attract blended-finance inflows. Competitive activity remains fluid because product registration timelines are shrinking in Egypt and Kenya, enabling both multinationals and regional specialists to scale quickly. However, cold-chain gaps, fragmented phytosanitary rules, and price sensitivity among smallholders temper the growth outlook.
Key Report Takeaways
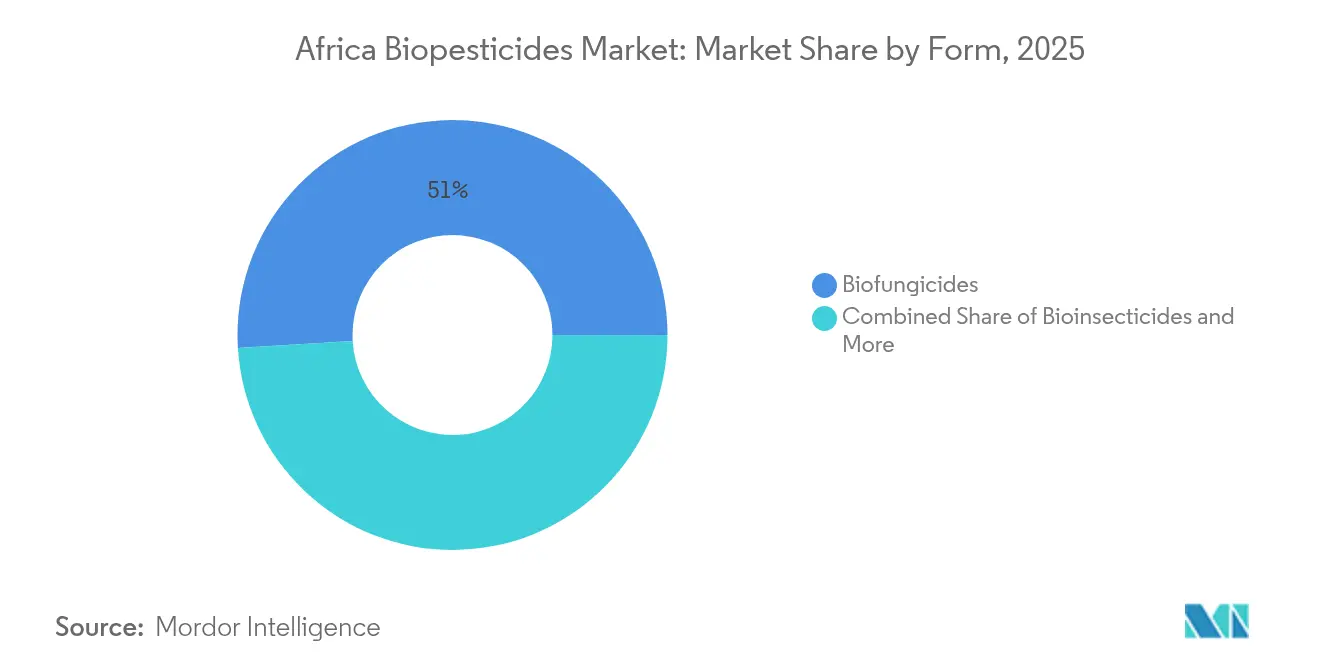
- By form, biofungicides held 50.96% of the Africa biopesticides market size in 2025 and is projected to expand at an 10.85% CAGR through 2031.
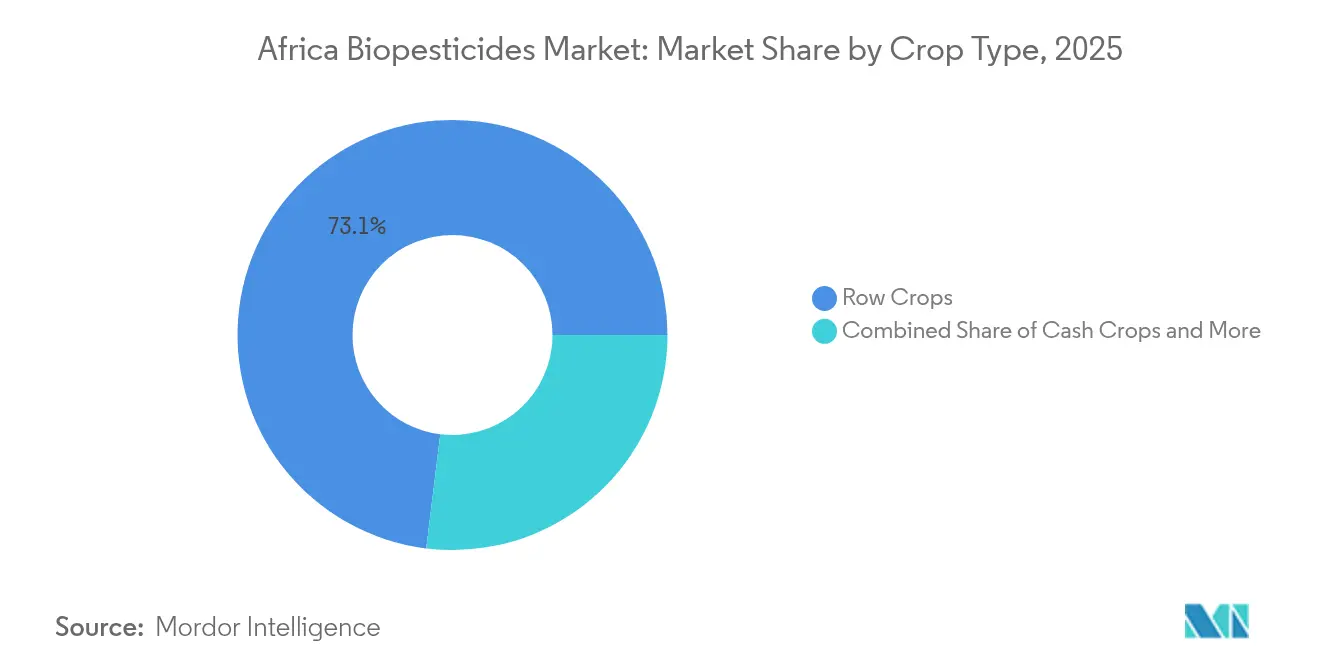
- By crop type, row crops held 73.05% of the Africa biopesticides market share in 2025, while cash crops are forecast to advance at an 10.88% CAGR to 2031.
- By geography, Nigeria controlled 15.62% share in 2025 and Egypt is set to grow at a 12.15% CAGR through 2031.
Note: Market size and forecast figures in this report are generated using Mordor Intelligence’s proprietary estimation framework, updated with the latest available data and insights as of 2026.
Africa Biopesticides Market Trends and Insights
Drivers Impact Analysis*
| Driver | (~) % Impact on CAGR Forecast | Geographic Relevance | Impact Timeline |
|---|---|---|---|
| Residue-free export crop demand | +2.8% | Egypt, Nigeria, South Africa, Kenya | Medium term (2-4 years) |
| Government subsidies and organic standards | +1.9% | Kenya, Nigeria, Ghana, Senegal | Long term (≥ 4 years) |
| Pest resistance to synthetic chemistry | +2.1% | Nigeria, Ghana, Mali | Short term (≤ 2 years) |
| Controlled-environment agriculture expansion | +0.8% | Lagos, Nairobi, Johannesburg, Cairo | Long term (≥ 4 years) |
| Mobile agronomy advisory services | +1.2% | Kenya, Nigeria, Ghana, Tanzania | Medium term (2-4 years) |
| Blended-finance for local biomanufacturing | +1.4% | Nigeria, Kenya, Ghana | Long term (≥ 4 years) |
| Source: Mordor Intelligence | |||
Residue-Free Export Crop Demand
The European Union’s tighter maximum residue limits enforced under the 2024 Farm to Fork Strategy slashed allowable pesticide residues by 40%, compelling African growers of cocoa, coffee, and fresh produce to transition to biological controls. Commodity buyers such as Cargill now require supplier certification that prioritizes biopesticides, a shift that protects USD 18.7 billion in African agricultural exports to Europe. Kenyan floriculture firms gained 23% price premiums after adopting residue-free protocols, illustrating clear monetary incentives. As compliance ties directly to export revenue, product demand accelerates, especially in Egypt, Kenya, and Ghana. The spillover effect is a surge in biofungicide and bioinsecticide registrations approved by national regulators. [1]Source: Biocontrol Coalition, “How Are Biopesticides Brought to Market Around the Globe,” biocontrolcoalition.eu
Government Subsidies and Organic Standards
African Union policy harmonization under Comprehensive Africa Agriculture Development Programme (CAADP) designated biological inputs as a strategic priority, leading to 15-30% price rebates for certified biopesticides in Kenya and Nigeria. Ghana’s regulator logged a 340% jump in biological product registration requests between 2024 and 2025, driven by clear organic standards that simplify market entry. Nigeria’s Agricultural Transformation Agenda channels USD 150 million annually toward sustainable-input vouchers, narrowing the price gap with synthetics. These incentives encourage multinationals to partner with local formulators, expanding product portfolios tailored to African crops. Over the long term, subsidy consistency anchors market growth even as private credit access broadens.[2]Source: International Institute of Tropical Agriculture, “Aflasafe: Aflatoxin Management,” iita.org
Pest Resistance to Synthetic Chemistry
Pyrethroid resistance in major African pest species has reached crisis levels, with fall armyworm populations showing 70-85% survival rates against conventional insecticides across key maize-growing regions in Nigeria, Ghana, and Zambia. The International Centre of Insect Physiology and Ecology documented that Spodoptera frugiperda has developed resistance mechanisms to 12 different synthetic active ingredients commonly used in African agriculture, forcing farmers to increase application rates by 200-300% to achieve historical efficacy levels. This resistance crisis has created an economic tipping point where biological alternatives become cost-competitive despite higher upfront prices, as synthetic pesticide efficacy declines and application frequency increases. Bacillus thuringiensis-based bioinsecticides maintain consistent efficacy against resistant pest populations because their protein-based mode of action differs fundamentally from synthetic chemistry, providing farmers with reliable crop protection when conventional options fail. The African Union's Pesticide Resistance Management Strategy, launched in 2024, explicitly recommends biological rotation programs as the primary tool for preserving synthetic pesticide effectiveness and managing resistance development. [3]Source: International Centre of Insect Physiology and Ecology, “Insecticide Resistance Monitoring,” icipe.org
Controlled-Environment Agriculture Expansion
More than 15 vertical farms licensed in Lagos since 2024 depend exclusively on biological controls to avoid chemical residues in closed systems. Controlled-environment agriculture (CEA) in Africa is projected to reach USD 2.1 billion by 2030, with growers capturing 40-60% price premiums for pesticide-free produce. Greenhouse operators in Kenya report biological protocols cutting crop losses to below 5%, compared with 15-20% in open fields. Internet-connected sensors optimize humidity and prompt precision releases of beneficial organisms. CEA growth across major cities thus sustains steady demand for high-potency biofungicides and parasitoids.
Restraints Impact Analysis*
| Restraint | (~) % Impact on CAGR Forecast | Geographic Relevance | Impact Timeline |
|---|---|---|---|
| Limited cold chain and warehousing | -1.8% | Rural areas in Sub-Saharan Africa | Short term (≤ 2 years) |
| Higher up-front cost versus synthetics | -1.4% | Smallholder regions across Africa | Medium term (2-4 years) |
| Spore viability losses from solar exposure | -0.9% | Sahel and East Africa | Short term (≤ 2 years) |
| Cross-border phytosanitary barriers | -0.7% | ECOWAS, EAC trade corridors | Long term (≥ 4 years) |
| Source: Mordor Intelligence | |||
Limited Cold Chain and Warehousing for Biologicals
Cold storage covers only 15% of African agricultural supply chains, exposing temperature-sensitive bio-products to 25 °C-plus conditions that cut microbial viability by 40-60%. The African Union estimates USD 2.8 billion in investment is required to close this gap. Retail mark-ups rise because distributors must fund insulated transport or risk product failure. Farmers forced to buy degraded products lose confidence, slowing repeat purchases. Ongoing cold-chain pilot projects remain small relative to need, limiting near-term market expansion.
Higher Up-Front Cost versus Synthetics
Biopesticides cost 130-150% more per hectare at retail, straining the liquidity of smallholders operating on thin margins. Microfinance default rates on biological input loans exceed those for synthetics by 25%, discouraging lenders. Despite longer-term soil-health gains, immediate yield responses vary, creating perceived risk. National voucher schemes cover only 20% of smallholders because of fiscal limits, so price gaps persist. Until localized production and scale efficiencies mature, cost sensitivity will constrain adoption momentum.
*Our forecasts treat driver/restraint impacts as directional, not additive. The impact forecasts reflect baseline growth, mix effects, and variable interactions.
Segment Analysis
By Form: Biofungicides Consolidate Leadership
Biofungicides secured 50.96% of the Africa biopesticides market share in 2025 and are forecast to post an 10.85% CAGR to 2031, underscoring their dominance in countering cocoa black pod and tomato late blight across humid belts. The Africa biopesticides market size tied to biofungicides reached USD 90.51 million in 2025, reflecting widespread uptake in Kenya’s floriculture clusters where Trichoderma formulations suppress Botrytis outbreaks. Continued product approvals in Egypt and Ghana suggest steady volume expansion as farmers chase residue-free certification.
Second-tier segments are gaining but from lower bases. Bioinsecticides leverage Bacillus thuringiensis and Beauveria strains to tackle armyworm infestations in maize belts. Bioherbicides remain niche, yet trials targeting Striga in sorghum show promising 70% weed-pressure reductions. Ongoing public-private research consortia are accelerating indigenous fungal screenings, which could elevate Africa-specific biofungicide pipelines and gradually diversify supplier rosters.


By Crop Type: Cash Crops Propel Premium Demand
Row crops held 73.05% of Africa biopesticides market size in 2025, reflecting baseline maize and sorghum acreage. However, cash crops such as cocoa and cut flowers will post the quickest 10.88% CAGR as exporters seek zero residue compliance for European Union (EU) and Gulf Cooperation Council (GCC) buyers. Ghanaian cocoa cooperatives accessing 23% export premiums after switching to biofungicides illustrate the financial upside.
Horticultural adoption intensifies inside greenhouse corridors because high-density planting elevates fungal risk. Post-harvest treatments for aflatoxin control in groundnuts also expand, driven by food-safety mandates. As price premiums persist, cash-crop growers reinvest in biological programs, reinforcing a virtuous cycle that widens the Africa biopesticides market.
Geography Analysis
Nigeria commanded 15.62% of 2025 revenues, mirroring the region’s vast cropland and diverse ecological zones. It anchors volume through maize and tomato demand, while Ghana and Tanzania accelerate export-driven uptake in cocoa and horticulture. Regional economic blocs are piloting joint registration systems that could shorten product launches by one year, strengthening growth prospects once harmonization matures.
Egypt is the fastest-growing market at a 12.15% CAGR, fueled by 45,000 hectares of greenhouse acreage supplying EU supermarkets. Government subsidies trimming biological input prices by 25% and streamlined approvals of 23 new products in 2024 underpin expansion. The country is projected to grow as the vertical farms flourish around Cairo.
South Africa maintains the continent’s most mature regulatory framework with 144 registered biopesticides. Commercial farms leverage seed-treatment innovations, yet smallholder uptake lags because of cost hurdles and rural cold-chain deficits. Looking forward, donor-sponsored cold-storage hubs and mobile agronomy apps could narrow adoption gaps across remote provinces.
Competitive Landscape
The Africa biopesticides market remains moderately fragmented; the top five firms captured 20.2% of 2024 revenues. UPL leads the market, using partnerships with 2,800 African agro-dealers to secure last-mile delivery. Certis Biologicals’ purchase of AgBiome fungicides deepens its cocoa and coffee disease portfolio, while blended-finance projects tie multinationals to local formulators receiving concessional capital. Eléphant Vert’s 2025 acquisition of BIO3G integrates European microbial assets with African distribution, broadening crop coverage.
Competitive advantage hinges on cold-chain investments and digital advisory tie-ins. Firms offering smartphone-based scouting and localized strain formulations differentiate themselves in cost-sensitive markets. As local manufacturing scales, early movers with technology-transfer agreements will compress unit costs, threatening import-dependent rivals.
In a price-sensitive market, maintaining product quality while keeping prices competitive is paramount. Industry players must invest in educational initiatives to raise awareness about the advantages of sustainable pesticides and their correct application methods. Furthermore, forging strong relationships with key stakeholders such as government agencies, agricultural extension services, and farmer cooperatives is vital.
Africa Biopesticides Industry Leaders
Certis USA LLC
Coromandel International Ltd
Koppert Biological Systems Inc.
T. Stanes and Company Limited
UPL Limited
- *Disclaimer: Major Players sorted in no particular order

Recent Industry Developments
- October 2025: FMC has introduced its pheromone technology to Côte d'Ivoire, marking the registration and launch of Sofero® Frugi. This bioinsecticide targets the mating cycle of fall armyworms, a significant pest in the area.
- March 2024: Certis Biologicals acquired AgBiome’s Howler and Theia assets, gaining field-proven biofungicides suited to black pod and late blight, and announced plans to register both in Ghana and Kenya by 2026.
- January 2024: Certis Biologicals has unveiled "Convergence," a potent biofungicide tailored for corn, soybeans, and peanuts. This innovative solution promises enhanced disease control and bolstered plant health, all in a single, cost-effective package for row crop farmers.


Africa Biopesticides Market Report Scope
| Biofungicides |
| Bioherbicides |
| Bioinsecticides |
| Other Biopesticides |
| Cash Crops |
| Horticultural Crops |
| Row Crops |
| Egypt |
| Nigeria |
| South Africa |
| Rest of Africa |
| Form | Biofungicides |
| Bioherbicides | |
| Bioinsecticides | |
| Other Biopesticides | |
| Crop Type | Cash Crops |
| Horticultural Crops | |
| Row Crops | |
| Country | Egypt |
| Nigeria | |
| South Africa | |
| Rest of Africa |


Market Definition
- AVERAGE DOSAGE RATE - The average application rate is the average volume of biopesticides applied per hectare of farmland in the respective region/country.
- CROP TYPE - Crop type includes Row crops (Cereals, Pulses, Oilseeds), Horticultural Crops (Fruits and vegetables) and Cash Crops (Plantation Crops, Fibre Crops and Other Industrial Crops)
- FUNCTION - The Crop Protection function of agirucultural biological include products that prevent or control various biotic and abiotic stress.
- TYPE - Biopesticides prevent or control various pests, including insects, diseases, and weeds, from causing crop damage and yield loss.
| Keyword | Definition |
|---|---|
| Cash Crops | Cash crops are non-consumable crops sold as a whole or part of the crop to manufacture end-products to make a profit. |
| Integrated Pest Management (IPM) | IPM is an environment-friendly and sustainable approach to control pests in various crops. It involves a combination of methods, including biological controls, cultural practices, and selective use of pesticides. |
| Bacterial biocontrol agents | Bacteria used to control pests and diseases in crops. They work by producing toxins harmful to the target pests or competing with them for nutrients and space in the growing environment. Some examples of commonly used bacterial biocontrol agents include Bacillus thuringiensis (Bt), Pseudomonas fluorescens, and Streptomyces spp. |
| Plant Protection Product (PPP) | A plant protection product is a formulation applied to crops to protect from pests, such as weeds, diseases, or insects. They contain one or more active substances with other co-formulants such as solvents, carriers, inert material, wetting agents or adjuvants formulated to give optimum product efficacy. |
| Pathogen | A pathogen is an organism causing disease to its host, with the severity of the disease symptoms. |
| Parasitoids | Parasitoids are insects that lay their eggs on or within the host insect, with their larvae feeding on the host insect. In agriculture, parasitoids can be used as a form of biological pest control, as they help to control pest damage to crops and decrease the need for chemical pesticides. |
| Entomopathogenic Nematodes (EPN) | Entomopathogenic nematodes are parasitic roundworms that infect and kill pests by releasing bacteria from their gut. Entomopathogenic nematodes are a form of biocontrol agents used in agriculture. |
| Vesicular-arbuscular mycorrhiza (VAM) | VAM fungi are mycorrhizal species of fungus. They live in the roots of different higher-order plants. They develop a symbiotic relationship with the plants in the roots of these plants. |
| Fungal biocontrol agents | Fungal biocontrol agents are the beneficial fungi that control plant pests and diseases. They are an alternative to chemical pesticides. They infect and kill the pests or compete with pathogenic fungi for nutrients and space. |
| Biofertilizers | Biofertilizers contain beneficial microorganisms that enhance soil fertility and promote plant growth. |
| Biopesticides | Biopesticides are natural/bio-based compounds used to manage agricultural pests using specific biological effects. |
| Predators | Predators in agriculture are the organisms that feed on pests and help control pest damage to the crops. Some common predator species used in agriculture include ladybugs, lacewings, and predatory mites. |
| Biocontrol agents | Biocontrol agents are living organisms used to control pests and diseases in agriculture. They are alternatives to chemical pesticides and are known for their lesser impact on the environment and human health. |
| Organic Fertilizers | Organic fertilizer is composed of animal or vegetable matter used alone or in combination with one or more non-synthetically derived elements or compounds used for soil fertility and plant growth. |
| Protein hydrolysates (PHs) | Protein hydrolysate-based biostimulants contain free amino acids, oligopeptides, and polypeptides produced by enzymatic or chemical hydrolysis of proteins, primarily from vegetal or animal sources. |
| Biostimulants/Plant Growth Regulators (PGR) | Biostimulants/Plant Growth Regulators (PGR) are substances derived from natural resources to enhance plant growth and health by stimulating plant processes (metabolism). |
| Soil Amendments | Soil Amendments are substances applied to soil that improve soil health, such as soil fertility and soil structure. |
| Seaweed Extract | Seaweed extracts are rich in micro and macronutrients, proteins, polysaccharides, polyphenols, phytohormones, and osmolytes. These substances boost seed germination and crop establishment, total plant growth and productivity. |
| Compounds related to biocontrol and/or promoting growth (CRBPG) | Compounds related to biocontrol or promoting growth (CRBPG) are the ability of a bacteria to produce compounds for phytopathogen biocontrol and plant growth promotion. |
| Symbiotic Nitrogen-Fixing Bacteria | Symbiotic nitrogen-fixing bacteria such as Rhizobium obtain food and shelter from the host, and in return, they help by providing fixed nitrogen to the plants. |
| Nitrogen Fixation | Nitrogen fixation is a chemical process in soil which converts molecular nitrogen into ammonia or related nitrogenous compounds. |
| ARS (Agricultural Research Service) | ARS is the U.S. Department of Agriculture's chief scientific in-house research agency. It aims to find solutions to agricultural problems faced by the farmers in the country. |
| Phytosanitary Regulations | Phytosanitary regulations imposed by the respective government bodies check or prohibit the importation and marketing of certain insects, plant species, or products of these plants to prevent the introduction or spread of new plant pests or pathogens. |
| Ectomycorrhizae (ECM) | Ectomycorrhiza (ECM) is a symbiotic interaction of fungi with the feeder roots of higher plants in which both the plant and the fungi benefit through the association for survival. |


Research Methodology
Mordor Intelligence follows a four-step methodology in all our reports.
- Step-1: Identify Key Variables: In order to build a robust forecasting methodology, the variables and factors identified in Step-1 are tested against available historical market numbers. Through an iterative process, the variables required for market forecast are set and the model is built on the basis of these variables.
- Step-2: Build a Market Model: Market-size estimations for the forecast years are in nominal terms. Inflation is not a part of the pricing, and the average selling price (ASP) is kept constant throughout the forecast period.
- Step-3: Validate and Finalize: In this important step, all market numbers, variables and analyst calls are validated through an extensive network of primary research experts from the market studied. The respondents are selected across levels and functions to generate a holistic picture of the market studied.
- Step-4: Research Outputs: Syndicated Reports, Custom Consulting Assignments, Databases & Subscription Platforms.


