Market Overview
| Study Period | 2020 - 2031 |
|---|---|
| Forecast Data Period | 2026 - 2031 |
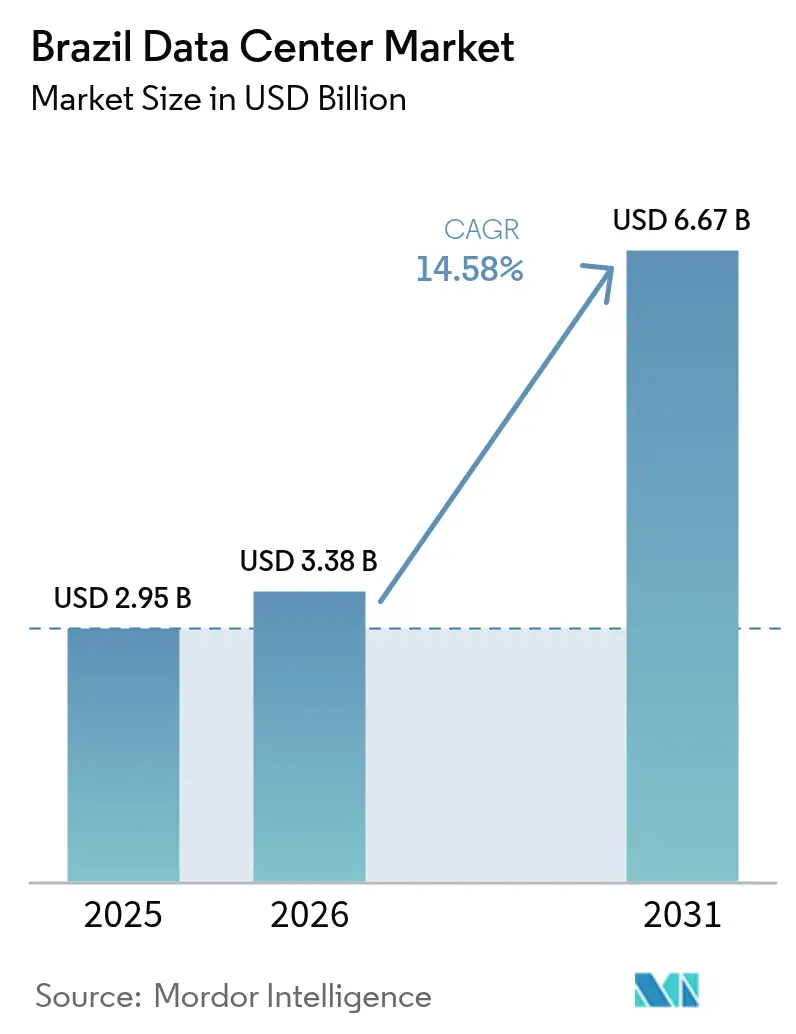
| Base Year Market Size (2025) | USD 2.95 Billion |
| Market Size (2026) | USD 3.38 Billion |
| Market Size (2031) | USD 6.67 Billion |
| Growth Rate (2026 - 2031) | 14.58% CAGR |
| Market Concentration | Medium |
Major Players *Disclaimer: Major Players sorted in no particular order Image © Mordor Intelligence. Reuse requires attribution under CC BY 4.0. | |
Brazil Data Center Market Analysis by Mordor Intelligence
The Brazil data center market size reached 0.95 thousand MW of IT load capacity in 2025 and is projected to climb to 1.46 thousand MW by 2030, advancing at an 8.91% CAGR. The Brazil data center market is expected to grow from USD 2.95 billion in 2025 to USD 3.38 billion in 2026 and is forecast to reach USD 6.67 billion by 2031 at 14.58% CAGR over 2026-2031. The market segment shares and estimates are calculated and reported in terms of MW. Growth momentum stems from hyperscale cloud investments, an 85% renewable-energy generation mix, and federal incentives that ease import tariffs for qualifying green facilities. Submarine-cable landings in Fortaleza and government-funded transmission upgrades reduce latency and extend renewable power to secondary cities, supporting edge and AI campuses. At the same time, import duties of up to 100% on IT hardware and multi-level permitting remain near-term headwinds that the Redata program seeks to resolve.
Key Report Takeaways
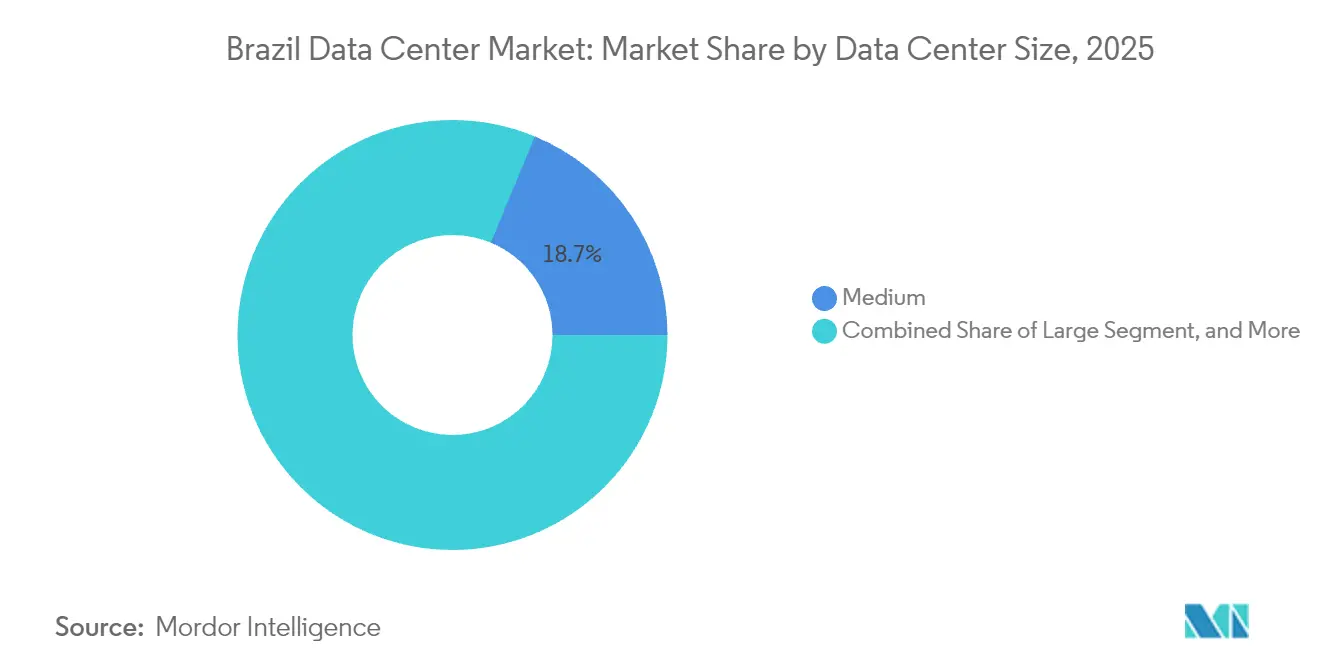
- By data center size, medium facilities led with 18.74% of the Brazilian data center market share in 2025, while large facilities are forecast to expand at a 8.86% CAGR through 2031.
- By tier type, Tier 3 dominated with a 7.06% share of the Brazil data center market in 2025; Tier 4 is projected to achieve a 9.03% CAGR to 2031.
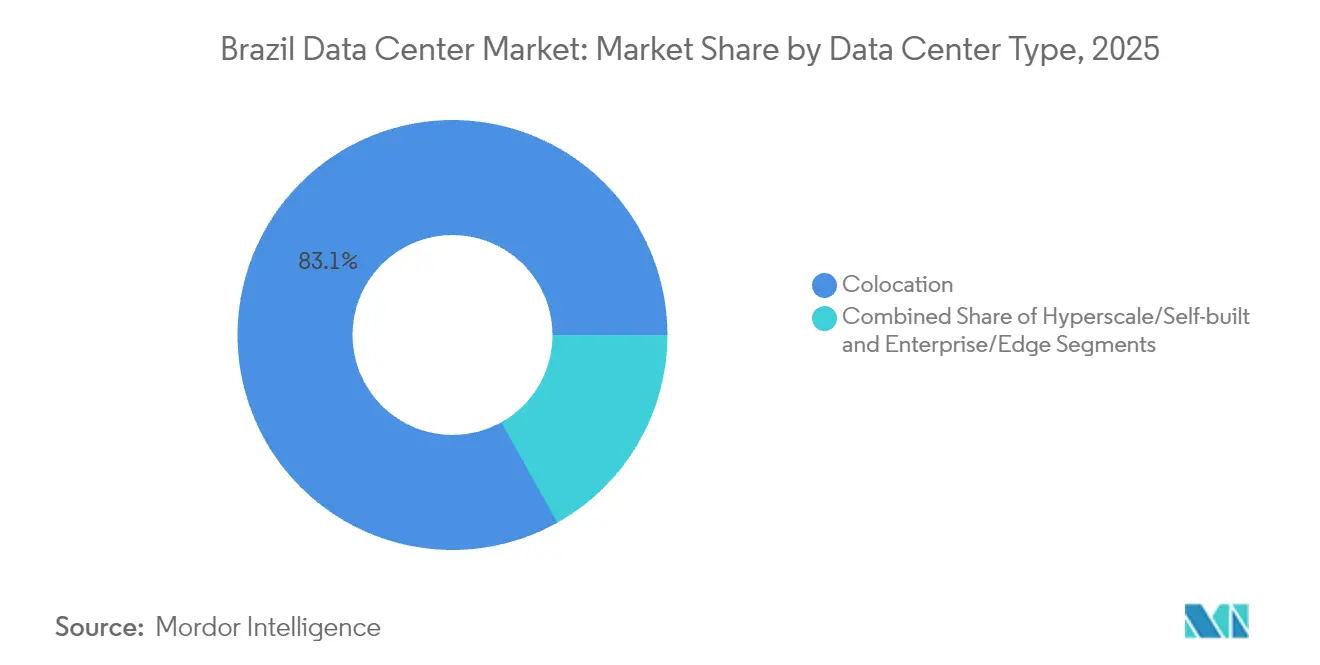
- By data center type, colocation captured an 83.12% share of the Brazil data center market in 2025, whereas hyperscale deployments are set to grow at a 9.84% CAGR over the forecast period.
- By end user, IT and Telecom held a 48.02% share of the Brazil data center market in 2025, while BFSI is poised for the fastest 9.11% CAGR through 2031.
- By hotspot, São Paulo commanded a 42.10% share of the Brazilian data center market in 2025; Rio de Janeiro is expected to log a 9.33% CAGR by 2031.
Note: Market size and forecast figures in this report are generated using Mordor Intelligence’s proprietary estimation framework, updated with the latest available data and insights as of 2026.
Brazil Data Center Market Trends and Insights
Drivers Impact Analysis*
| Driver | (~) % Impact on CAGR Forecast | Geographic Relevance | Impact Timeline |
|---|---|---|---|
| Cloud adoption-driven hyperscale expansion | +2.8% | São Paulo, Rio de Janeiro | Medium term (2-4 years) |
| Abundant renewable-energy mix cuts carbon intensity | +2.1% | National, early gains in Northeast and South | Long term (≥4 years) |
| Rising smartphone usage fuels data creation | +1.7% | National, faster in North and Northeast | Short term (≤2 years) |
| Federal tax-incentive policy for green data centers | +1.9% | National, renewable zones | Medium term (2-4 years) |
| AI mega-campuses in cooler southern states | +1.5% | Rio Grande do Sul, Santa Catarina | Long term (≥4 years) |
| Fortaleza subsea-cable hub enables edge latency gains | +1.2% | Northeast, spill-over nationwide | Medium term (2-4 years) |
| Source: Mordor Intelligence | |||


Cloud Adoption-Driven Hyperscale Expansion
Enterprises shifting to cloud-native workloads are fueling hyperscale capacity, as illustrated by Microsoft’s USD 2.7 billion and Amazon’s USD 1.8 billion commitments, which eclipse previous capital cycles.[2]Swinhoe, Dan, “Microsoft to Invest $2.7 Billion in Cloud and AI Infrastructure in Brazil,” datacenterdynamics.com Hyperscalers partner with local operators, such as Ascenty and Scala, to navigate licensing, grid interconnection, and environmental regulations, thereby compressing construction timelines. Hyperscale footprints are adding power at a 10.1% CAGR, outpacing the broader Brazil data center market, as firms seek scalable, cloud-integrated solutions over traditional retail colocation. The trend is anchored in São Paulo and Rio de Janeiro, while radiating to cooler southern states where land and renewable power are cost-competitive. Wholesale leasing models grow in tandem, enabling enterprises to offset capex while maintaining control of high-density racks.
Abundant Renewable-Energy Mix Cuts Carbon Intensity
Renewables already supply more than 85% of Brazil’s grid, giving operators a low-carbon advantage for energy-intensive AI clusters. Hydroelectricity remains the backbone, while wind and solar costs continue to fall, lowering the levelized cost of energy by 27% and 46% respectively, by 2040. A USD 9 billion federal transmission plan links interior wind corridors to urban consumption centers, opening new zones for hyperscale campuses that still need fiber backhaul. Corporate power-purchase agreements indexed to renewable energy certificates attract international investors committed to science-based decarbonization targets. Strict water-efficiency standards in the upcoming Redata rules further align facility design with sustainability mandates.
Rising Smartphone Usage Fuels Data Creation
Smartphone ownership reached 87.6% of the population aged 10 and above in 2024, while internet penetration increased to 88%, driving a surge in video streaming and mobile banking traffic.[1]Nery, Carmen, “88% of Brazilians Aged 10+ Used the Internet in 2023,” agenciadenoticias.ibge.gov.br North and Northeast regions posted double-digit gains in connectivity, pushing demand for distributed edge nodes that localize content delivery and reduce backbone congestion. E-commerce revenue is forecast to reach USD 81.3 billion by 2027, amplifying transactional loads on payment gateways hosted in local data centers. Telecom operators are rolling out 5G cores that rely on network functions virtualization, resulting in an increase in micro-data center installations near radio sites. Emerging AI chatbots delivered over mobile devices further multiply real-time compute cycles at edge locations.
Federal Tax-Incentive Policy for Green Data Centers
The Redata framework, slated for launch in late 2025, waives import duties that can double equipment costs, provided operators source 100% renewable power and reserve 10% capacity for domestic use. Government projections indicate the policy could unlock USD 2 trillion in cumulative investments by 2035, shifting comparative advantage away from alternatives in Chile and Mexico. The exemption covers servers, batteries, and switchgear not produced locally, harmonizing customs procedures under the Ex-Tarifário regime and accelerating customs clearance to fewer than 10 days. Redata also institutes expedited environmental licensing for projects in designated digital corridors, cutting permitting backlogs that have historically spanned 18 months.
Restraints Impact Analysis*
| Restraint | (~) % Impact on CAGR Forecast | Geographic Relevance | Impact Timeline |
|---|---|---|---|
| High import tariffs inflate IT equipment CAPEX | -1.8% | National | Short term (≤2 years) |
| Complex multi-level permitting slows projects | -1.3% | National, state variations | Medium term (2-4 years) |
| Water-stress-driven social opposition at coastal sites | -0.9% | Coastal Northeast, select metros | Long term (≥4 years) |
| Shortage of skilled high-density-DC technicians | -0.7% | São Paulo, Rio de Janeiro, emerging markets | Medium term (2-4 years) |
| Source: Mordor Intelligence | |||
High Import Tariffs Inflate IT Equipment CAPEX
Brazil imposes duties that can reach 100% on critical hardware, raising outlays to USD 40–50 million per MW and constraining new builds. Although the Ex-Tarifário program offers case-by-case reductions, cumbersome applications deter timely procurement. Multinationals sometimes reroute shipments through free-trade zones in Manaus, which adds to the logistics complexity. Tariff uncertainty complicates financial modeling and raises risk premiums demanded by institutional investors. Redata’s blanket exemption is expected to restore parity with peers in Colombia and Peru, but only for projects that satisfy strict renewable-energy and domestic-capacity thresholds.
Complex Multi-Level Permitting Slows Projects
Developers must liaise with federal entities, such as ANATEL and IBAMA, as well as state environmental bodies and municipal planners, often repeating impact assessments for each layer. Disparate documentation standards prolong review cycles, while indigenous consultation requirements can trigger injunctions. The TikTok facility in Ceará faced a year-long delay after community groups challenged water-use projections in court. Resolution 779 streamlined telecom licensing, yet environmental approvals remain fragmented. Some states now designate data centers as strategic infrastructure, shortening local procedures, but a lack of nationwide harmonization keeps lead times among the region’s longest.
*Our forecasts treat driver/restraint impacts as directional, not additive. The impact forecasts reflect baseline growth, mix effects, and variable interactions.
Segment Analysis
By Data Center Size: Larger Facilities Gain Momentum
The segment holding a 18.74% share in 2025 consists of medium facilities ranging from 5 MW to 20 MW that serve enterprise colocation and regional cloud nodes. They remain core to current deployments because they strike a balance between capital efficiency and proximity to dense user clusters. Large facilities, however, are projected to record the highest 8.86% CAGR as hyperscalers consolidate dispersed footprints into multi-building campuses requiring 40 MW blocks. Brazil data center market size for large-footprint builds is set to rise sharply as AI systems push rack densities beyond 30 kW. Land acquisition outside São Paulo’s urban perimeter enables operators to secure lower real estate costs while tapping into the same fiber rings. Investments in dual 138 kV grid feeds and on-site substations support power scaling without encroaching on municipal distribution networks.
The Brazilian data center market is now observing design shifts toward modular power shells that accommodate successive 20 MW increments. Medium facilities incorporate pre-fabricated pods to quickly add capacity for cloud peering nodes, thereby preserving their relevance. Small (sub-5 MW) sites continue to underpin edge and 5G deployments in secondary cities, but their growth lags behind the overall market. Mega facilities above 100 MW are nascent; Scala’s AI City could alter share dynamics if the first 600 MW phase comes online before 2028. Overall, graduated capacity tiers enable operators to address diverse workload profiles, ranging from latency-sensitive retail services to GPU-intensive AI training clusters.


By Tier Type: Tier 4 Uptake Accelerates
Tier 3 data centers dominated the market with a 7.06% share in 2025, providing 99.982% uptime through N+1 redundancy and affordable price points. They serve the majority of enterprise and government workloads that demand robust resiliency without incurring a premium cost. Tier 4 footprints, though smaller in base, are forecast to log a 9.03% CAGR as financial services, gaming, and AI developers migrate to fully fault-tolerant environments. The Brazil data center market size for Tier 4 builds expands amid stricter uptime clauses in cloud outsourcing regulations and the SBCE carbon-trading rule, which values energy-efficient design.
Operators retrofit existing halls with 2N power chains and distributed redundant cooling to upgrade to Tier 4 without disrupting client operations. São Paulo metro leads conversions, followed by Rio de Janeiro, where AI City plans employ fault-tolerant architecture from inception. Tier 1-2 facilities cater to edge caching, disaster recovery, and local council archives, particularly in states that offer property tax rebates for first-time data center entrants. Rising cybersecurity norms from ANPD are pushing even mid-sized firms to consider Tier 3 minimums, prompting an overall increase in baseline redundancy standards across the Brazilian data center market.
By Data Center Type: Colocation Retains Scale Advantage
Colocation captured 83.12% of the installed capacity in 2025, as enterprises and regional cloud nodes favor shared infrastructure for its cost-effectiveness and high cross-connect density. Carrier-neutral models owned by Ascenty, Scala, and Elea house more than 80 domestic and international network service providers, fostering rich peering ecosystems. Yet hyperscale self-builds exhibit a 9.84% CAGR, reflecting cloud giants’ long-term capacity planning and AI hardware specifications that exceed existing colocation design envelopes. The Brazil data center market share of hyperscale campuses rises as Microsoft and Amazon secure contiguous land near 500 kV power corridors, locking in 20-year utility contracts.
Retail colocation remains steady, buoyed by SMB digital migration, while wholesale suites grow faster due to bank and e-commerce consolidation of on-premises rooms. Edge micro-data-center clusters along 5G towers emerge in conjunction with telecom firms such as V.tal, yet still contribute a single-digit slice to national load. Operators are increasingly selling heat reuse to district heating projects in Curitiba and Porto Alegre, adding new revenue streams while bolstering their ESG credentials.
By End User: BFSI Outpaces Baseline
IT and Telecom companies accounted for 48.02% of capacity in 2025, driven by continual network densification and content distribution needs. They anchor anchor-tenant agreements that de-risk new builds, especially in metro São Paulo. BFSI workloads, however, exhibit the fastest 9.11% CAGR, driven by digital bank rollouts, open-finance APIs, and Central Bank Resolution 4,893 requirements that mandate data localization. Transaction volumes linked to Pix instant-payment rails surge, demanding low-latency processing hubs in multiple availability zones.
E-commerce retailers adopt omnichannel logistics systems that run predictive analytics within local zones to minimize cart abandonment. Government digital ID and AI policy pilots add sovereign cloud demand, often co-located but firewalled from commercial tenants for security. Manufacturing utilizes real-time SCADA analytics and AR-assisted maintenance, facilitated by edge nodes integrated with private 5G, particularly in the vicinity of auto clusters in Minas Gerais. Media and entertainment push 4K streaming caches into Fortaleza and Salvador for northern audiences, broadening regional load distribution.
Geography Analysis
São Paulo contributed 42.10% of the IT load capacity in 2025, primarily due to its dense enterprise base, extensive 4,500-kilometer fiber network, and access to skilled labor. The Brazil data center market size within the metro area adds capacity through brownfield expansions in Campinas and Vinhedo, aided by land prices near USD 32 per square meter that remain competitive relative to those in central business districts. Power availability from dual 138 kV feeders allows phased growth without triggering major utility substation upgrades.
Rio de Janeiro logs the fastest 9.33% CAGR to 2031 on the back of state-backed incentives and submarine-cable connectivity. The Rio AI City campus enhances the city’s profile for GPU clusters, while its proximity to offshore energy platforms drives the need for low-latency computing in seismic imaging and real-time drilling analytics. Lease rates remain 12% below São Paulo averages, supporting workload migration for cost optimization.
Rest-of-Brazil load expands as Fortaleza leverages 18 subsea systems to position itself as Latin America’s second-largest interconnection hub. Wind-rich Ceará supplies competitive renewable power at load factors exceeding 45%, attracting edge nodes from gaming and content providers. Southern states, such as Rio Grande do Sul, offer ambient temperatures 4 °C lower on average than São Paulo, which can cut PUE by up to 0.15 for AI facilities using economization. Federal grants for data centers in economically disadvantaged regions further stimulate builds in Goiânia and Belém, diversifying geographic risk.
Competitive Landscape
Five operators control more than 70% of live and committed capacity, signaling moderate concentration. Ascenty operates 28 sites and continues to expand its footprint with a proprietary dark-fiber backbone that spans Brazil, Chile, and Mexico. Scala operates 23 facilities and plans a 4.7 GW mega campus that would significantly expand national capacity if fully implemented. Elea leverages 12 sites, primarily located in Rio de Janeiro and southern regions, differentiating itself through renewable energy procurement agreements.
Institutional capital flows intensify: Patria allocated USD 1 billion for a new platform targeting brownfield takeovers, while Brookfield seeks partners to recapitalize Ascenty.[3]Magalhaes, Luciana, “Brookfield Seeks Partner for Ascenty,” reuters.com Joint ventures with utilities and transmission firms de-risk power access and align ESG targets. Technology adoption centers on immersion-cooling pilots for 100 kW AI racks, lithium-ion UPS retrofits that cut footprint by 40%, and on-site solar paired with flow batteries to shave peak tariffs.
White-space opportunities emerge in secondary metros where fiber backbones intersect renewable zones; Fortaleza, Salvador, and Curitiba are among the near-term prospects. Barriers to entry include capital intensity, permitting complexity, and a scarcity of multi-disciplinary engineering talent. Nevertheless, telecom carriers like V.tal leverage right-of-way privileges to build tower-adjacent micro-facilities, testing a federated edge model that could fragment low-capacity tiers over time.
Brazil Data Center Industry Leaders
Scala Data Centers Participações S A
Ascenty Data Centers E Telecomunicações S A
ODATA S A
Equinix, Inc
Microsoft Corporation
- *Disclaimer: Major Players sorted in no particular order


Recent Industry Developments
- September 2025: RT-One has begun construction of a 100 MW renewable-powered AI data center in Uberlândia, Minas Gerais, with plans to scale to 400 MW, and partners include Hitachi, WEG, Siemens, and Vertiv.
- September 2025: Alibaba Cloud has confirmed its first data center in Brazil as part of a 380 billion yuan global AI infrastructure program.
- June 2025: Acting President Geraldo Alckmin announced the imminent rollout of Redata, which will grant tax exemptions to green data center projects.
- May 2025: Patria launched a USD 1 billion platform for greenfield builds and acquisitions across Brazil.
- May 2025: Scala broke ground on a 560 MW power substation in São Paulo to support campus expansion.
- January 2025: V.tal subsidiary Tecto revealed plans for a 200 MW campus in the São Paulo metropolitan area.


Brazil Data Center Market Report Scope
Rio de Janeiro, Sao Paulo are covered as segments by Hotspot. Large, Massive, Medium, Mega, Small are covered as segments by Data Center Size. Tier 1 and 2, Tier 3, Tier 4 are covered as segments by Tier Type. Non-Utilized, Utilized are covered as segments by Absorption.By Data Center Size
| Large |
| Massive |
| Medium |
| Mega |
| Small |
By Tier Type
| Tier 1 and 2 |
| Tier 3 |
| Tier 4 |
By Data Center Type
| Hyperscale / Self-built | ||
| Enterprise / Edge | ||
| Colocation | Non-Utilized | |
| Utilized | Retail Colocation | |
| Wholesale Colocation | ||
By End User
| BFSI |
| IT and ITES |
| E-Commerce |
| Government |
| Manufacturing |
| Media and Entertainment |
| Telecom |
| Other End Users |
By Hotspot
| São Paulo |
| Rio de Janeiro |
| Rest of Brazil |
| By Data Center Size | Large | ||
| Massive | |||
| Medium | |||
| Mega | |||
| Small | |||
| By Tier Type | Tier 1 and 2 | ||
| Tier 3 | |||
| Tier 4 | |||
| By Data Center Type | Hyperscale / Self-built | ||
| Enterprise / Edge | |||
| Colocation | Non-Utilized | ||
| Utilized | Retail Colocation | ||
| Wholesale Colocation | |||
| By End User | BFSI | ||
| IT and ITES | |||
| E-Commerce | |||
| Government | |||
| Manufacturing | |||
| Media and Entertainment | |||
| Telecom | |||
| Other End Users | |||
| By Hotspot | São Paulo | ||
| Rio de Janeiro | |||
| Rest of Brazil | |||


Market Definition
- IT LOAD CAPACITY - The IT load capacity or installed capacity, refers to the amount of energy consumed by servers and network equipments placed in a rack installed. It is measured in megawatt (MW).
- ABSORPTION RATE - It denotes the extend to which the data center capacity has been leased out. For instance, a 100 MW DC has leased out 75 MW, then absorption rate would be 75%. It is also referred as utilization rate and leased-out capacity.
- RAISED FLOOR SPACE - It is an elevated space build over the floor. This gap between the original floor and the elevated floor is used to accommodate wiring, cooling, and other data center equipment. This arrangement assist in having proper wiring and cooling infrastructure. It is measured in square feet (ft^2).
- DATA CENTER SIZE - Data Center Size is segmented based on the raised floor space allocated to the data center facilities. Mega DC - # of Racks must be more than 9000 or RFS (raised floor space) must be more than 225001 Sq. ft; Massive DC - # of Racks must be in between 9000 and 3001 or RFS must be in between 225000 Sq. ft and 75001 Sq. ft; Large DC - # of Racks must be in between 3000 and 801 or RFS must be in between 75000 Sq. ft and 20001 Sq. ft; Medium DC # of Racks must be in between 800 and 201 or RFS must be in between 20000 Sq. ft and 5001 Sq. ft; Small DC - # of Racks must be less than 200 or RFS must be less than 5000 Sq. ft.
- TIER TYPE - According to Uptime Institute the data centers are classified into four tiers based on the proficiencies of redundant equipment of the data center infrastructure. In this segment the data center are segmented as Tier 1,Tier 2, Tier 3 and Tier 4.
- COLOCATION TYPE - The segment is segregated into 3 categories namely Retail, Wholesale and Hyperscale Colocation service. The categorization is done based on the amount of IT load leased out to potential customers. Retail colocation service has leased capacity less than 250 kW; Wholesale colocation services has leased capacity between 251 kW and 4 MW and Hyperscale colocation services has leased capacity more than 4 MW.
- END CONSUMERS - The Data Center Market operates on a B2B basis. BFSI, Government, Cloud Operators, Media and Entertainment, E-Commerce, Telecom and Manufacturing are the major end-consumers in the market studied. The scope only includes colocation service operators catering to the increasing digitalization of the end-user industries.
| Keyword | Definition |
|---|---|
| Rack Unit | Generally referred as U or RU, it is the unit of measurement for the server unit housed in the racks in the data center. 1U is equal to 1.75 inches. |
| Rack Density | It defines the amount of power consumed by the equipment and server housed in a rack. It is measured in kilowatt (kW). This factor plays a critical role in data center design and, cooling and power planning. |
| IT Load Capacity | The IT load capacity or installed capacity, refers to the amount of energy consumed by servers and network equipment placed in a rack installed. It is measured in megawatt (MW). |
| Absorption Rate | It denotes how much of the data center capacity has been leased out. For instance, if a 100 MW DC has leased out 75 MW, then the absorption rate would be 75%. It is also referred to as utilization rate and leased-out capacity. |
| Raised Floor Space | It is an elevated space built over the floor. This gap between the original floor and the elevated floor is used to accommodate wiring, cooling, and other data center equipment. This arrangement assists in having proper wiring and cooling infrastructure. It is measured in square feet/meter. |
| Computer Room Air Conditioner (CRAC) | It is a device used to monitor and maintain the temperature, air circulation, and humidity inside the server room in the data center. |
| Aisle | It is the open space between the rows of racks. This open space is critical for maintaining the optimal temperature (20-25 °C) in the server room. There are primarily two aisles inside the server room, a hot aisle and a cold aisle. |
| Cold Aisle | It is the aisle wherein the front of the rack faces the aisle. Here, chilled air is directed into the aisle so that it can enter the front of the racks and maintain the temperature. |
| Hot Aisle | It is the aisle where the back of the racks faces the aisle. Here, the heat dissipated from the equipment’s in the rack is directed to the outlet vent of the CRAC. |
| Critical Load | It includes the servers and other computer equipment whose uptime is critical for data center operation. |
| Power Usage Effectiveness (PUE) | It is a metric which defines the efficiency of a data center. It is calculated by: (𝑇𝑜𝑡𝑎𝑙 𝐷𝑎𝑡𝑎 𝐶𝑒𝑛𝑡𝑒𝑟 𝐸𝑛𝑒𝑟𝑔𝑦 𝐶𝑜𝑛𝑠𝑢𝑚𝑝𝑡𝑖𝑜𝑛)/(𝑇𝑜𝑡𝑎𝑙 𝐼𝑇 𝐸𝑞𝑢𝑖𝑝𝑚𝑒𝑛𝑡 𝐸𝑛𝑒𝑟𝑔𝑦 𝐶𝑜𝑛𝑠𝑢𝑚𝑝𝑡𝑖𝑜𝑛). Further, a data center with a PUE of 1.2-1.5 is considered highly efficient, whereas, a data center with a PUE >2 is considered highly inefficient. |
| Redundancy | It is defined as a system design wherein additional component (UPS, generators, CRAC) is added so that in case of power outage, equipment failure, the IT equipment should not be affected. |
| Uninterruptible Power Supply (UPS) | It is a device that is connected in series with the utility power supply, storing energy in batteries such that the supply from UPS is continuous to IT equipment even during utility power is snapped. The UPS primarily supports the IT equipment only. |
| Generators | Just like UPS, generators are placed in the data center to ensure an uninterrupted power supply, avoiding downtime. Data center facilities have diesel generators and commonly, 48-hour diesel is stored in the facility to prevent disruption. |
| N | It denotes the tools and equipment required for a data center to function at full load. Only "N" indicates that there is no backup to the equipment in the event of any failure. |
| N+1 | Referred to as 'Need plus one', it denotes the additional equipment setup available to avoid downtime in case of failure. A data center is considered N+1 when there is one additional unit for every 4 components. For instance, if a data center has 4 UPS systems, then for to achieve N+1, an additional UPS system would be required. |
| 2N | It refers to fully redundant design wherein two independent power distribution system is deployed. Therefore, in the event of a complete failure of one distribution system, the other system will still supply power to the data center. |
| In-Row Cooling | It is the cooling design system installed between racks in a row where it draws warm air from the hot aisle and supplies cool air to the cold aisle, thereby maintaining the temperature. |
| Tier 1 | Tier classification determines the preparedness of a data center facility to sustain data center operation. A data center is classified as Tier 1 data center when it has a non-redundant (N) power component (UPS, generators), cooling components, and power distribution system (from utility power grids). The Tier 1 data center has an uptime of 99.67% and an annual downtime of <28.8 hours. |
| Tier 2 | A data center is classified as Tier 2 data center when it has a redundant power and cooling components (N+1) and a single non-redundant distribution system. Redundant components include extra generators, UPS, chillers, heat rejection equipment, and fuel tanks. The Tier 2 data center has an uptime of 99.74% and an annual downtime of <22 hours. |
| Tier 3 | A data center having redundant power and cooling components and multiple power distribution systems is referred to as a Tier 3 data center. The facility is resistant to planned (facility maintenance) and unplanned (power outage, cooling failure) disruption. The Tier 3 data center has an uptime of 99.98% and an annual downtime of <1.6 hours. |
| Tier 4 | It is the most tolerant type of data center. A Tier 4 data center has multiple, independent redundant power and cooling components and multiple power distribution paths. All IT equipment are dual powered, making them fault tolerant in case of any disruption, thereby ensuring interrupted operation. The Tier 4 data center has an uptime of 99.74% and an annual downtime of <26.3 minutes. |
| Small Data Center | Data center that has floor space area of ≤ 5,000 Sq. ft or the number of racks that can be installed is ≤ 200 is classified as a small data center. |
| Medium Data Center | Data center which has floor space area between 5,001-20,000 Sq. ft, or the number of racks that can be installed is between 201-800, is classified as a medium data center. |
| Large Data Center | Data center which has floor space area between 20,001-75,000 Sq. ft, or the number of racks that can be installed is between 801-3,000, is classified as a large data center. |
| Massive Data Center | Data center which has floor space area between 75,001-225,000 Sq. ft, or the number of racks that can be installed is between 3001-9,000, is classified as a massive data center. |
| Mega Data Center | Data center that has a floor space area of ≥ 225,001 Sq. ft or the number of racks that can be installed is ≥ 9001 is classified as a mega data center. |
| Retail Colocation | It refers to those customers who have a capacity requirement of 250 kW or less. These services are majorly opted by small and medium enterprises (SMEs). |
| Wholesale Colocation | It refers to those customers who have a capacity requirement between 250 kW to 4 MW. These services are majorly opted by medium to large enterprises. |
| Hyperscale Colocation | It refers to those customers who have a capacity requirement greater than 4 MW. The hyperscale demand primarily originates from large-scale cloud players, IT companies, BFSI, and OTT players (like Netflix, Hulu, and HBO+). |
| Mobile Data Speed | It is the mobile internet speed a user experiences via their smartphones. This speed is primarily dependent on the carrier technology being used in the smartphone. The carrier technologies available in the market are 2G, 3G, 4G, and 5G, where 2G provides the slowest speed while 5G is the fastest. |
| Fiber Connectivity Network | It is a network of optical fiber cables deployed across the country, connecting rural and urban regions with high-speed internet connection. It is measured in kilometer (km). |
| Data Traffic per Smartphone | It is a measure of average data consumption by a smartphone user in a month. It is measured in gigabyte (GB). |
| Broadband Data Speed | It is the internet speed that is supplied over the fixed cable connection. Commonly, copper cable and optic fiber cable are used in both residential and commercial use. Here, optic cable fiber provides faster internet speed than copper cable. |
| Submarine Cable | A submarine cable is a fiber optic cable laid down at two or more landing points. Through this cable, communication and internet connectivity between countries across the globe is established. These cables can transmit 100-200 terabits per second (Tbps) from one point to another. |
| Carbon Footprint | It is the measure of carbon dioxide generated during the regular operation of a data center. Since, coal, and oil & gas are the primary source of power generation, consumption of this power contributes to carbon emissions. Data center operators are incorporating renewable energy sources to curb the carbon footprint emerging in their facilities. |


Research Methodology
Mordor Intelligence follows a four-step methodology in all our reports.
- Step-1: Identify Key Variables: In order to build a robust forecasting methodology, the variables and factors identified in Step-1 are tested against available historical market numbers. Through an iterative process, the variables required for market forecast are set and the model is built on the basis of these variables.
- Step-2: Build a Market Model: Market-size estimations for the forecast years are in nominal terms. Inflation is not a part of the pricing, and the average selling price (ASP) is kept constant throughout the forecast period for each country.
- Step-3: Validate and Finalize: In this important step, all market numbers, variables and analyst calls are validated through an extensive network of primary research experts from the market studied. The respondents are selected across levels and functions to generate a holistic picture of the market studied.
- Step-4: Research Outputs: Syndicated Reports, Custom Consulting Assignments, Databases & Subscription Platforms


