Market Overview
| Study Period | 2021 - 2031 |
|---|---|
| Forecast Data Period | 2026 - 2031 |
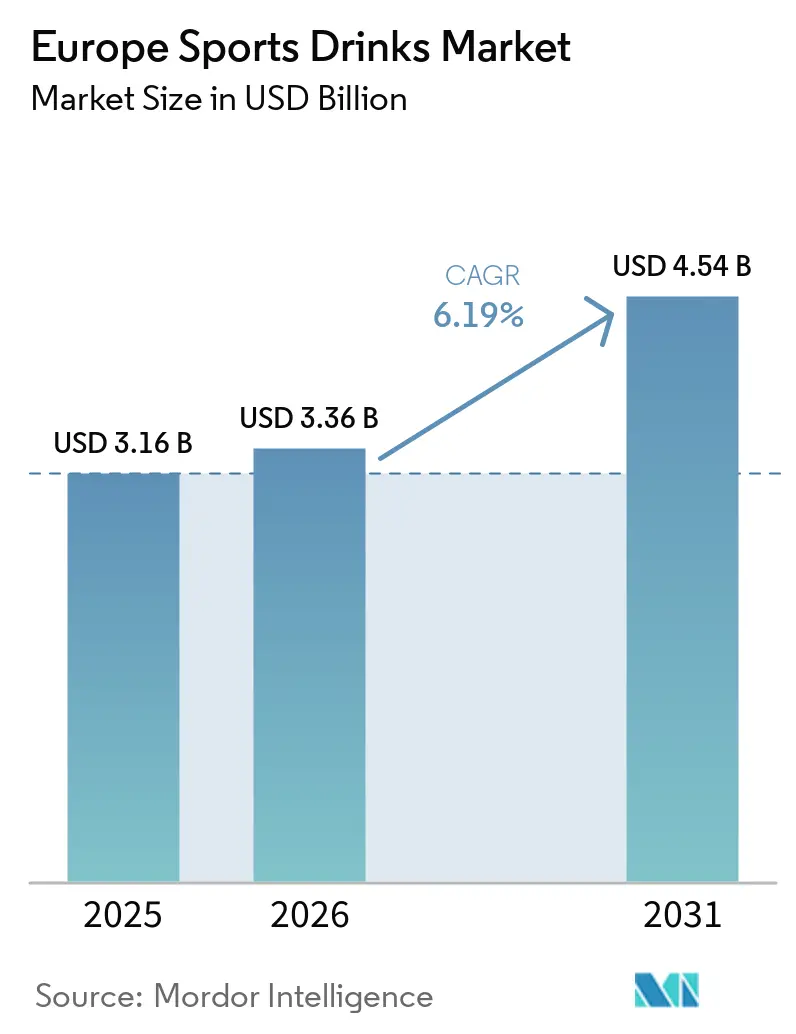
| Base Year Market Size (2025) | USD 3.16 Billion |
| Market Size (2026) | USD 3.36 Billion |
| Market Size (2031) | USD 4.54 Billion |
| Growth Rate (2026 - 2031) | 6.19% CAGR |
| Market Concentration | Medium |
Major Players
*Disclaimer: Major Players sorted in no particular order Image © Mordor Intelligence. Reuse requires attribution under CC BY 4.0. |
|
Europe Sports Drinks Market Analysis by Mordor Intelligence
The Europe sports drinks market size is expected to grow from USD 3.16 billion in 2025 to USD 3.36 billion in 2026 and is forecast to reach USD 4.54 billion by 2031 at 6.19% CAGR over 2026-2031. Rising fitness club memberships, the spread of sugar-free formulations that meet European Union calorie-reduction goals, and regulatory incentives favoring recycled-content packaging are reinforcing demand. Multinational leaders still command shelf visibility and advertising scale, yet premium challengers that spotlight plant-based electrolytes and personalization are winning high-margin share. Deposit-return schemes, fluctuations in ingredient costs for potassium salts and natural sweeteners, and the phase-out of PFAS coatings remain the primary cost headwinds for all participants. Overall, the Europe sports drinks market continues to evolve toward cleaner labels, aluminum packaging, and digital engagement features that turn one-off purchases into ongoing hydration programs.
Key Report Takeaways
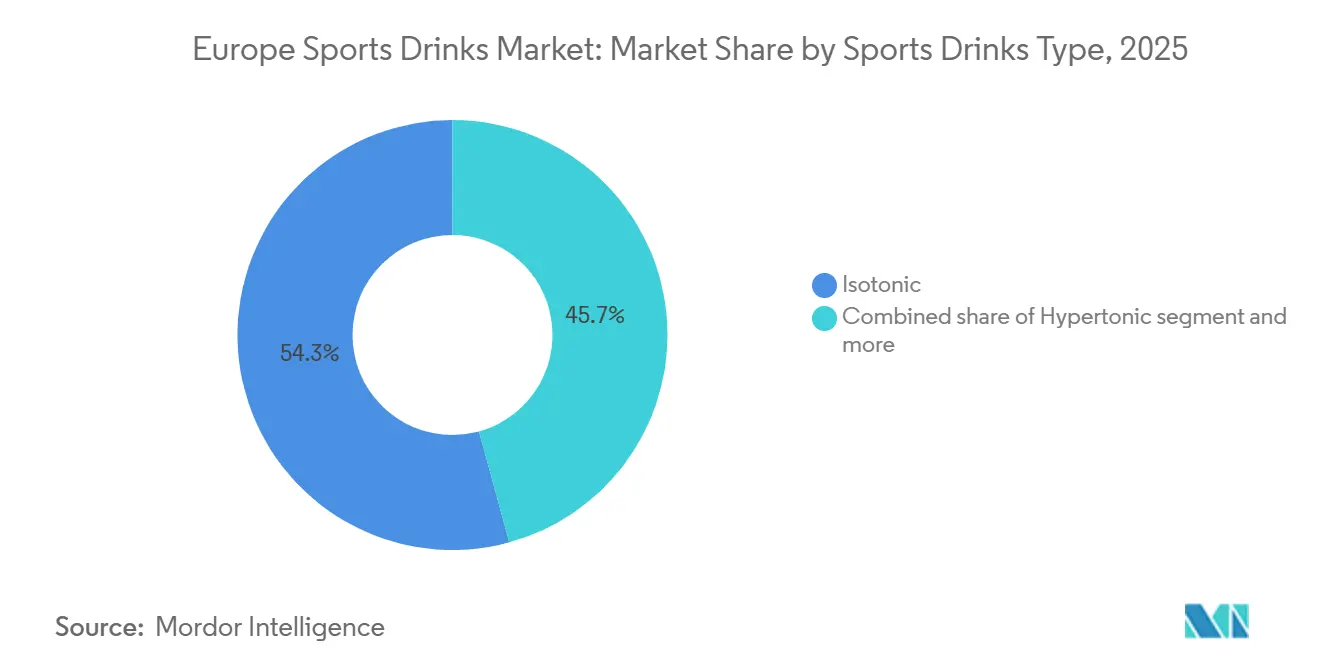
- By product type, isotonic variants led with a 54.26% Europe sports drinks market share in 2025, while hypertonic drinks are forecast to expand at a 6.77% CAGR from 2026 to 2031.
- By packaging, PET bottles retained 93.22% of category revenue in 2025, whereas metal cans are set to grow at a 7.23% CAGR through 2031.
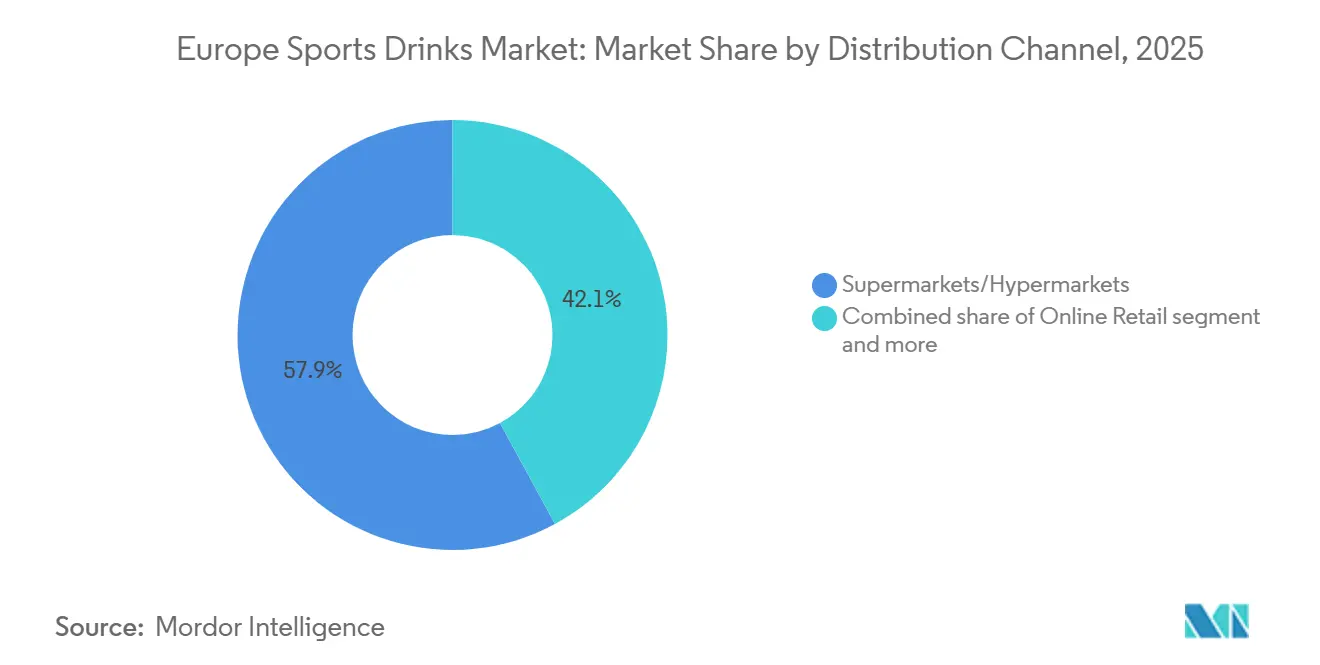
- By distribution channel, supermarkets/hypermarkets accounted for 57.98% of 2025 sales, but online retail is poised for a 7.68% CAGR to 2031.
- By geography, Germany generated 27.41% of the 2025 value, and Spain is on track for the fastest 7.31% CAGR between 2026 and 2031.
Note: Market size and forecast figures in this report are generated using Mordor Intelligence’s proprietary estimation framework, updated with the latest available data and insights as of 2026.
Europe Sports Drinks Market Trends and Insights
Drivers Impact Analysis*
| Driver | (~) % Impact on CAGR Forecast | Geographic Relevance | Impact Timeline |
|---|---|---|---|
| Increasing engagement in sports and physical activities | +1.2% | Pan European, with concentration in Germany, United Kingdom, Netherlands | Medium term (2-4 years) |
| Surge in demand for hydration and electrolyte solutions | +1.1% | Global, with heightened relevance in Southern Europe (Spain, Italy) due to warmer climates | Short term (≤ 2 years) |
| Emergence of sugar-free and low-calorie product variants | +0.9% | United Kingdom, Germany, Netherlands, Sweden | Medium term (2-4 years) |
| Product innovation and formulation diversification | +0.8% | Pan European, driven by European Union sugar-reduction commitments | Short term (≤ 2 years) |
| Increasing number of sports events globally | +0.6% | Western Europe (Germany, United Kingdom, France, Netherlands) | Long term (≥ 4 years) |
| Expansion of distribution and retail channels | +0.7% | Pan European, with early adoption in digitally mature markets (Netherlands, Sweden) | Medium term (2-4 years) |
| Source: Mordor Intelligence | |||


Increasing engagement in sports and physical activities
Rising participation in sports and physical activities across Europe is driving growth in the sports drinks market, as a growing number of consumers seek functional hydration solutions to support exercise, recovery, and overall well-being. Public health authorities and governments are promoting active lifestyles to address lifestyle-related health concerns, broadening the market from professional athletes to include recreational and casual exercisers. This trend is integrating sports drinks into everyday fitness routines, moving beyond their traditional role as niche performance-focused products. According to Sport England, approximately 213,400 people participated in track and field athletics in England between November 2023 and November 2024, highlighting sustained engagement in organized physical activities that require effective hydration [1]Source: Sports England "Adults aged 16+ who have taken part in sport and physical activity at least twice in the last 28 days," sportengland-production-files. Additionally, the World Health Organization’s 2024 physical activity guidelines, which recommend 150 minutes of moderate-intensity exercise per week, are being incorporated into national health policies in countries such as Germany, the Netherlands, and Sweden [2]Source: World Health Organization, "Physical activity," who.int. These policies, along with employer wellness programs and public health campaigns, are indirectly boosting sports drink consumption.
Surge in demand for hydration and electrolyte solutions
Electrolyte science is aligning with increasing consumer demands for transparency, as peer-reviewed research published in 2024 demonstrates that hypotonic formulations (osmolality below 270 mOsm/kg) enhance gastric emptying and fluid absorption rates by up to 30% compared to plain water, particularly during prolonged exercise in ambient temperatures exceeding 25°C [3]Source: National Library of Medicine (NIH), "Osmolality and Tonicity of Isotonic Beverages," pmc.ncbi.nlm.nih.gov. This physiological benefit is being emphasized in marketing strategies, with brands prominently showcasing sodium, potassium, and magnesium content on front-of-pack labels to distinguish themselves from functional waters with minimal electrolyte content. Southern European markets, including Spain, Italy, and southern France, show higher per-capita consumption due to extended summer training seasons and elevated sweat-loss rates, providing a buffer against economic downturns that may reduce discretionary spending in cooler regions. The European Food Safety Authority's 2024 guidance on electrolyte health claims allows manufacturers to state that sodium supports normal muscle function, provided formulations meet specified thresholds.
Increasing number of sports events globally
Sports events and fitness club memberships are increasingly becoming a middle-class norm across Northern and Western Europe, with countries like the Netherlands, Germany, and Sweden achieving penetration rates in 2024. This growth is driven by the rise of low-cost gym chains and corporate wellness subsidies. As a result, the market for sports drinks is expanding beyond competitive athletes to include yoga practitioners, Pilates enthusiasts, and recreational cyclists who view hydration as part of holistic wellness rather than solely for performance enhancement. Brands are adapting to this trend by introducing lower-sugar isotonic variants and smaller-format bottles (330 m compared to the traditional 500 m) to cater to shorter workout durations and calorie-conscious consumers. Geographically, Eastern European markets, such as Poland, are experiencing double-digit growth in gym memberships. This presents early-mover opportunities for brands that establish distribution partnerships with regional fitness chains before multinational competitors dominate shelf space.
Emergence of sugar-free and low-calorie product variants
The development of sugar-free and low-calorie sports drink variants is driving market growth in Europe, supported by increasing health awareness, a rising prevalence of lifestyle-related diseases, and clearer regulatory frameworks for alternative sweeteners. As consumers become more mindful of sugar consumption, sports drink brands are reformulating products to reduce or eliminate added sugars while preserving functionality and taste. This trend is enhancing the category's appeal among health-conscious consumers seeking hydration and performance benefits without negatively impacting metabolic health. Health concerns and regulatory measures are reinforcing this shift. According to the International Diabetes Federation, Portugal had the highest adult diabetes prevalence in Europe at 14.3% in 2024, followed by Croatia at 13.7%, driving demand for low-sugar beverage options across the region [4]Source: International Diabetes Federation, Diabetes Atlas," diabetesatlas.org. Additionally, EU Regulation 1333/2008 on food additives, which permits the use of stevia glycosides (E960) at levels up to 330 mg/L in flavored drinks, provides regulatory clarity that facilitates innovation and reformulation efforts. However, consumer acceptance of sugar substitutes varies across regions. Northern European markets, including Germany, the Netherlands, and Sweden, exhibit higher acceptance of stevia’s flavor profile.
Restraints Impact Analysis*
| Restraint | (~) % Impact on CAGR Forecast | Geographic Relevance | Impact Timeline |
|---|---|---|---|
| Functional waters and enhancers pose competition | -0.7% | Pan European, with highest intensity in Germany, United Kingdom, Netherlands | Short term (≤ 2 years) |
| Consumer apprehensions regarding artificial additives | -0.5% | Western Europe (Germany, France, Netherlands, Sweden) | Medium term (2-4 years) |
| Environmental issues tied to packaging and waste | -0.6% | Pan European, driven by European Union Packaging Regulation 2025/40 | Long term (≥ 4 years) |
| Volatility in supply inputs for potassium salts and natural sweeteners | -0.4% | Global, with spillover to European manufacturing hubs | Short term (≤ 2 years) |
| Source: Mordor Intelligence | |||
Functional waters and enhancers pose competition
Enhanced water products, fortified with vitamins, minerals, or botanicals but without the carbohydrate content of traditional sports drinks, are impacting isotonic drink volumes in the casual-exercise segment. In this segment, consumers prioritize hydration over glycogen replenishment. These products are priced lower than branded sports drinks while offering similar electrolyte content, presenting a strong value proposition for price-sensitive consumers in discount retail channels such as Aldi and Lidl. The European Union's tap-water quality standards, which ensure potable water across all member states, diminish the perceived necessity for bottled hydration solutions. This trend is particularly evident among environmentally conscious consumers who view single-use packaging as wasteful. Competitive intensity is notably high in Germany, the United Kingdom, and the Netherlands, where private-label penetration in the broader beverage category exceeds. This indicates low brand loyalty in markets where functional differentiation is minimal.
Consumer apprehensions regarding artificial additives
Clean-label demands are prompting reformulation cycles as consumers increasingly scrutinize ingredient lists for synthetic additives, including tartrazine (E102), sunset yellow (E110), and artificial flavors derived from petrochemical sources. While the European Food Safety Authority's Regulation 1333/2008 permits the use of these additives, it mandates warning labels for products containing certain azo dyes, cautioning that they "may have an adverse effect on activity and attention in children." This requirement often stigmatizes such formulations and leads retailers to delist non-compliant SKUs. Natural color alternatives, such as anthocyanins from purple carrots or beta-carotene from algae, are 3-5 times more expensive than synthetic dyes and are less stable under UV light, posing challenges for shelf-life management in ambient-temperature distribution channels. Western European markets, including Germany, France, the Netherlands, and Sweden, demonstrate the highest sensitivity to artificial additives.
*Our forecasts treat driver/restraint impacts as directional, not additive. The impact forecasts reflect baseline growth, mix effects, and variable interactions.
Segment Analysis
By Sports Drink Type: Hypertonic Gains as Recovery Science Matures
In 2025, isotonic drinks accounted for 54.26% of revenue, driven by their balanced osmolality, which matches blood plasma for efficient absorption. This makes them a preferred choice for moderate-intensity activities such as gym workouts, recreational cycling, and team sports. Hypotonic drinks, with carbohydrate concentrations below 4%, are tailored for rapid fluid absorption and cater to niche segments like youth sports and training in hot climates, where sweat loss surpasses energy expenditure. Hypertonic drinks are projected to grow at a CAGR of 6.77% through 2031, exceeding the market average growth rate of 6.12%. These formulations are increasingly adopted by endurance athletes and CrossFit enthusiasts for carbohydrate-dense recovery strategies that emphasize glycogen replenishment over immediate hydration.
With carbohydrate concentrations of 8-10% (compared to 6-8% in isotonic drinks), hypertonic drinks have an osmolality above 300 mOsm/kg, which slows gastric emptying but provides sustained energy release during ultra-marathons, triathlons, and extended training sessions. Electrolyte-enhanced water, a zero-calorie subcategory, is gaining market share in casual-exercise segments as consumers seek hydration without the 80-120 calories typically found in a 500 ml bottle of traditional isotonic drinks. The "others" category includes emerging products such as protein-electrolyte blends and adaptogen-infused recovery drinks. While these formats remain small-scale, they are attracting venture capital investments and gaining shelf space in specialty retail outlets.


By Packaging Type: Metal Cans Surge on Regulatory Mandates
PET bottles accounted for 93.22% of the 2025 packaging market share, supported by lower initial capital costs (filling lines are 30-40% less expensive than can lines) and strong consumer familiarity. However, they face challenges from extended producer responsibility (EPR) fees, which add EUR 0.05-0.10 per unit, and deposit-return schemes that require reverse-logistics infrastructure. Aseptic packages and Tetra Pak pouches cater to niche segments, such as children's sports drinks and on-the-go formats, offering ambient-temperature stability and lightweight portability. However, their multi-layer construction (polyethylene, aluminum foil, paperboard) complicates recycling processes, limiting their adoption in sustainability-focused retail chains.
Metal cans are projected to grow at a CAGR of 7.23% through 2031, driven by the European Union's Packaging Regulation 2025/40. This regulation mandates recycled content in aluminum beverage containers by 2030 and promotes infinite recyclability over single-use plastics. Aluminum's properties, 100% recyclability without quality degradation, lighter weight compared to glass, and superior barrier protection compared to PET, are positioning cans as the preferred format for sustainability. European aluminum producers have committed to achieving 100% recycled can ends and 100% beverage-can recycling rates by 2030. However, the transition to cans is capital-intensive, requiring brands to invest EUR 5-10 million per production facility to retrofit filling lines. This creates barriers for smaller players and consolidates market share among multinational incumbents with diversified manufacturing capabilities.
By Distribution Channel: Online Retail Gains as E-Commerce Matures
Supermarkets and hypermarkets accounted for 57.98% of the distribution in 2025, supported by their ability to provide chilled storage, strategically place impulse-purchase items near checkout counters, and offer promotional bundles (e.g., buy-two-get-one-free) that drive increased sales volumes. Convenience stores cater to on-the-go consumption needs, attracting commuters and gym-goers who prioritize convenience over cost. Meanwhile, specialty stores, such as sports nutrition retailers and health-food chains, target performance-oriented consumers who are willing to pay a premium for products with functional benefits like BCAA fortification or adaptogen blends.
Online retail is projected to grow at a CAGR of 7.68% through 2031, leveraging the fact that 77% of European Union internet users now shop online. E-commerce platforms are increasingly adopting subscription models to secure recurring revenue. For instance, brands like Gatorade and Powerade are testing auto-replenishment programs that offer monthly deliveries at discounts. Additionally, direct-to-consumer (DTC) channels enable brands to bypass retailer margins and collect first-party data on purchase frequency and flavor preferences. The continued dominance of offline channels is due to consumer preferences for immediate availability and the ability to physically evaluate beverages, which restricts the disruptive potential of e-commerce in the short term.
Geography Analysis
Germany accounted for 27.41% of the 2025 regional revenue, supported by its extensive network of discount retailers, including Aldi, Lidl, and Rewe, which offer sports drinks priced at EUR 0.99-1.49 per 500 ml bottle. These prices are lower than premium pricing in specialty channels. Additionally, Germany benefits from high per-capita sports participation. The United Kingdom sports drink market, along with Italy and France, represents mature markets with moderate growth, driven by established fitness cultures and strong brand recognition for multinational players such as Gatorade, Powerade, and Lucozade Sport. The Netherlands, Poland, Belgium, and Sweden are experiencing mid-single-digit growth, supported by increasing fitness club memberships and rising disposable incomes, particularly in Eastern European markets.
Spain is the fastest-growing market, with a CAGR of 7.31% through 2031. This growth is driven by the Mediterranean climate, which extends outdoor training seasons to 10-11 months annually, and government initiatives promoting active lifestyles among youth. These initiatives include subsidized gym memberships for students, investments in public sports facilities, and urban infrastructure that supports cycling and outdoor exercise. Such measures are expanding the base of regular and recreational athletes, further accelerating market growth.
Eastern European markets, including Poland, are experiencing double-digit growth in gym memberships. This growth is driving demand for fitness-related products, creating early-mover opportunities for brands to establish distribution partnerships with regional fitness chains. By securing these partnerships, brands can gain a competitive edge and occupy shelf space before multinational competitors enter the market. In contrast, Nordic markets such as Sweden, Denmark, and Finland are showing premiumization trends, with consumers willing to spend EUR 2.50-3.00 per bottle on organic, plant-based, or functional formulations.
Competitive Landscape
The Europe sports drinks market is moderately consolidated, operating within an oligopolistic structure. PepsiCo, The Coca-Cola Company, and Suntory Beverage & Food Europe collectively account for a significant share of regional revenue. Their scale enables advantages such as prime shelf placement, extensive media reach, and the financial capacity to upgrade packaging lines for aluminum containers. PepsiCo’s Gatorade Anna illustrates the potential of AI integration, transforming a single beverage into a data-driven subscription model that increases consumer retention. The Coca-Cola Company enhances digital engagement through NFC-enabled “Smart Cans,” which support loyalty programs and augmented reality experiences.
Opportunities remain in niche areas such as plant-based electrolyte products and hypertonic recovery formulations. Smaller brands like Vitamin Well AB and iPro Sport Holdings are establishing defensible positions by focusing on clean-label offerings and functional product enhancements. Meanwhile, private-label products in discount channels (e.g., Aldi, Lidl) are increasing competition, pressuring branded players to justify price premiums through innovation rather than relying on established brand equity.
Regulatory compliance is influencing competitive dynamics. The European Union's Packaging Regulation 2025/40, which requires 50% recycled content in aluminum containers by 2030, benefits larger incumbents with diversified manufacturing capabilities and the resources to upgrade filling lines. In contrast, smaller players face challenges such as margin compression due to extended producer responsibility (EPR) fees and the costs associated with deposit-return scheme infrastructure.
Europe Sports Drinks Industry Leaders
-
PepsiCo, Inc.
-
Suntory Holdings Limited
-
The Coca-Cola Company
-
Carlsberg A/S
-
Otsuka Holdings Co. Ltd.
- *Disclaimer: Major Players sorted in no particular order

Recent Industry Developments
- December 2025: IRONMAN and Precision Fuel & Hydration (PF&H) announced that PF&H will serve as the Official Hydration Partner for the global IRONMAN and IRONMAN 70.3 series starting in 2026. This expanded partnership builds on PF&H’s regional involvement since 2024 and now encompasses all international events, including the 2026 IRONMAN World Championship in Kona, Hawai‘i, and the 2026 IRONMAN 70.3 World Championship in Nice, France. PF&H’s PH 1000 electrolyte drink, formulated to support fluid and sodium balance, will be available on-course at all races, while carbohydrate fueling will continue to be provided by partner Maurten.
- September 2025: Gatorade introduced Hydration Booster, a powdered carbohydrate-electrolyte drink mix, in the United Kingdom. Designed for rapid and convenient hydration, it caters to busy, active lifestyles. Supported by over 55 years of scientific research from the Gatorade Sports Science Institute, each sachet mixes with water to provide a balanced combination of electrolytes, carbohydrates, and essential B vitamins, helping individuals stay energized and refreshed throughout the day.
- March 2024: Vitamin Well launched its next-generation sports drink range, Vitamin Well Sport, targeting active individuals seeking improved hydration and performance support. The range includes two variants: Vitamin Well Sport 001, which contains carbohydrates, electrolytes, magnesium, and vitamins D, B6, and B12 to aid fluid replacement, endurance, muscle function, and fatigue reduction; and Vitamin Well Sport 002, a low-calorie, sugar-free option with vitamins and minerals but no added carbohydrates. Both formulas are ready-to-drink solutions designed for hydration after exercise or physical activity.


Europe Sports Drinks Market Report Scope
Sports drinks are flavored, non-caffeinated beverages designed to rapidly replace water, electrolytes (sodium, potassium, magnesium, calcium), and carbohydrates (sugar) lost through sweat and energy expenditure during high-intensity or prolonged exercise. The Europe Sports Drinks Market Report is Segmented by Sports Drinks Type (Isotonic, Hypertonic, Hypotonic, and More), Packaging Type (PET Bottles, Metal Can, Aseptic Packages, and Tetra-Pak Pouches), by Distribution Channel (Supermarkets/Hypermarkets, Online Retail, Specialty Stores, and More), and by Geography (Germany, Italy, Netherlands, and More). The Market Forecasts are Provided in Terms of Value and Volume.
Sports Drink Type
| Isotonic |
| Hypotonic |
| Hypertonic |
| Electrolyte-Enhanced Water |
| Others |
Packaging Type
| PET Bottles |
| Metal Can |
| Aseptic packages |
| Tetra-Pak Pouches |
Distribution Channel
| Supermarkets/Hypermarkets |
| Convenience Stores |
| Specialty Stores |
| Online Retail |
| Others |
Geography
| Spain |
| United Kingdom |
| France |
| Germany |
| Russia |
| Italy |
| Netherlands |
| Rest of Europe |
| Other Applications |
| Sports Drink Type | Isotonic |
| Hypotonic | |
| Hypertonic | |
| Electrolyte-Enhanced Water | |
| Others | |
| Packaging Type | PET Bottles |
| Metal Can | |
| Aseptic packages | |
| Tetra-Pak Pouches | |
| Distribution Channel | Supermarkets/Hypermarkets |
| Convenience Stores | |
| Specialty Stores | |
| Online Retail | |
| Others | |
| Geography | Spain |
| United Kingdom | |
| France | |
| Germany | |
| Russia | |
| Italy | |
| Netherlands | |
| Rest of Europe | |
| Other Applications |


Market Definition
- Carbonated Soft Drinks (CSDs) - Carbonated soft drinks (CSDs) refer to non-alcoholic beverages that are carbonated and typically flavored, containing dissolved carbon dioxide to create effervescence. These beverages commonly include cola, lemon-lime, orange, and various fruit-flavored sodas. Marketed in cans, bottles, or fountain dispense.
- Juices - We have considered packaged juices which encompass non-alcoholic beverages derived from fruits, vegetables, or a combination thereof, processed and sealed in various packaging formats such as bottles, cartons, or pouches. Excluding fresh juices, this market segment involves commercially prepared and preserved juices, often with added preservatives and flavors.
- Ready-to-Drink (RTD) Tea and RTD Coffee - Ready-to-Drink (RTD) tea and RTD coffee are pre-packaged, non-alcoholic beverages that are brewed and prepared for consumption without further dilution. RTD tea typically includes various tea varieties, infused with flavors and sweeteners, and comes in bottles, cans, or cartons. Similarly, RTD coffee involves pre-brewed coffee formulations, often mixed with milk, sugar, or flavorings, and is conveniently packaged for on-the-go consumption.
- Energy Drinks - Energy drinks are non-alcoholic beverages formulated to provide a quick boost of energy and alertness. Whereas, sports drinks are beverages designed to hydrate and replenish electrolytes, particularly after physical exertion, exercise, or intense activity
| Keyword | Definition |
|---|---|
| Carbonated Soft Drinks | Carbonated soft drinks (CSDs) are a combination of carbonated water and flavouring, sweetened by sugar or a non-sugar sweeteners. |
| Standard Cola | Standard Cola is defined as the original flavor of cola soda. |
| Diet Cola | A cola-based soft drink containing no or low amounts of sugar |
| Fruit Flavored Carbonates | A carbonated beverage prepared from fruit juice/fruit flavor with carbonated water and containing sugar, dextrose, invert sugar or liquid glucose either singly or in combination. It may contain peel oil and fruit essences. |
| Juice | Juice is a drink made from the extraction or pressing of the natural liquid contained in fruit and vegetables. |
| 100% Juice | Fruit/vegetable juice made from fruit in the form of its juice with no water added to make up the volume. It is not permitted to add sugars, sweeteners, preservatives, flavourings or colourings to fruit juice. |
| Juice Drinks (up to 24% Juice) | Fruit/vegetable juice drinks with up to 24% fruits/vegetable extract. |
| Nectars (25-99% Juice) | Juices that can have between 25 and 99% of fruit, with the minimum legal limits defined depending on the type of fruit |
| Juice concentrates | Juice Concentrates are those form of juices when most of this liquid is removed resulting in a thick, syrupy product known as juice concentrate. |
| RTD Coffee | Packaged coffee beverages that are sold in a prepared form and are ready for consumption at the time of purchase. |
| Iced Coffee | An iced coffee is a cold version of coffee, usually a combination of hot espresso and milk with ice added to it. |
| Cold Brew Coffee | Cold brew also called cold water extraction or cold pressing is made by steeping ground coffee in room-temperature water for several hours. |
| RTD Tea | Ready-to-drink (RTD) tea is a packaged tea product ready for immediate consumption without brewing or preparation |
| Iced Tea | Ice tea or iced tea is a drink made from tea without milk but with sugar and sometimes fruit flavourings, drunk cold. |
| Green Tea | Green tea is a tea beverage which promotes mental alertness, relieving digestive symptoms and promoting weight loss. |
| Herbal Tea | Herbal tea beverages are made from the infusion or decoction of herbs, spices, or other plant material in hot water. |
| Energy Drink | A type of drink containing stimulant compounds, usually caffeine, which is marketed as providing mental and physical stimulation. They may or may not be carbonated and may also contain sugar, other sweeteners, or herbal extracts, among numerous possible ingredients. |
| Sugar-free or Low-calories Energy Drinks | Sugar-free or Low-calories Energy Drinks are sugar-free, artificially sweetened energy drinks with few or no calories. |
| Traditional Energy Drink | Traditional Energy Drinks are functional soft drinks containing ingredients designed to boost the consumer's energy. |
| Natural/Oraganic Energy Drinks | Natural/Organic energy drinks are energy drinks free of artificial sweeteners and synthetic colorings. Instead, they contain naturally derived ingredients such as green tea, yerba mate, and botanical extracts. |
| Energy Shots | A small but highly concentrated energy drink that contains large amounts of caffeine and/or other stimulants. The quantity is comparatively smaller compared to energy drinks. |
| Sports Drink | Sports drinks are beverages designed specifically for the rapid supply of fluid, carbohydrates, and electrolytes before, during or after exercise. |
| Isotonic | Isotonic drinks contain similar concentrations of salt and sugar as in the human body, and are designed to quickly replace fluids lost during exercise but with an increase of carbohydrate. |
| Hypertonic | Hypertonic drinks have a higher concentration of salt and sugar than the human body. They are best drunk after exercise as it is important to replace glycogen levels quickly after exercise. |
| Hypotonic | Hypotonic drinks are designed to quickly replace fluids lost during exercise. They have very low carbohydrate content and a lower concentration of salt and sugar than the human body. |
| Electrolyte-Enhanced Water | Electrolyte water is water infused with electrically-charged minerals, such as sodium, potassium, calcium, and magnesium. |
| Protein-based Sport Drinks | Protein-based sports drinks are those sports drinks which has added protein in it that will improve performance and reduce muscle protein breakdown. |
| On-Trade | The on-trade refers to places that sell beverages for immediate consumption on the premises like bars, restaurants, and pubs |
| Off-Trade | Off-trade usually means places like liquor stores, supermarkets and other places where you don't consume the beverage right away. |
| Convenience Store | A retail business that provides the public with a convenient location to quickly purchase a wide variety of consumable products and services, generally food and gasoline. |
| Specialty store | A specialty store is a shop/store that carries a deep assortment of brands, styles, or models within a relatively narrow category of goods |
| Online Retail | Online retail is a type of eCommerce whereby a business sells goods or services directly to consumers from a website. |
| Aseptic Packaging | Aseptic packaging refers to the filling of a cold, commercially sterile product under sterile conditions into a presterilized container and closure under sterile conditions to form a seal that effectively excludes microorganisms. These includes tetra packs, cartons, pouches etc. |
| PET Bottle | PET bottle means a bottle made of polyethylene terephthalate. |
| Metal Cans | Metal containers made of aluminum or tin- plated or zinc-plated steel, which are commonly used for packaging food, beverages or other products. |
| Disposable Cups | Disposable Cup means a cup or other container designed for single use to serve beverages, such as water, cold drinks, hot drinks and alcoholic beverages. |
| Gen Z | A way of referring to the group of people who were born in the late 1990s and early 2000s. |
| Millenial | Anyone born between 1981 and 1996 (ages 23 to 38 in 2019) is considered a Millennial |
| Taurine | Taurine is an amino acid that supports immune health and nervous system function. |
| Bars & Pubs | It is a drinking establishment licensed to serve alcoholic drinks for consumption on the premises. |
| Café | It is a foodservice establishment serving refreshments (mainly coffee) and light meals. |
| On the go | It means doing / dealing with while busily engaged with something and not diverting plans in order to accommodate. |
| Internet Penetration | The Internet Penetration Rate corresponds to the percentage of the total population of a given country or region that uses the Internet. |
| Vending Machine | A machine that dispenses small articles such as food, drinks, or cigarettes when a coin or token is inserted |
| Discount store | A discount store or discounter offers a retail format in which products are sold at prices that are in principle lower than an actual or supposed "full retail price". Discounters rely on bulk purchasing and efficient distribution to keep down costs. |
| Clean Label | Clean label on the beverage market are drinks that are made from few ingredients of natural origin and are not or only slightly processed. |
| Caffeine | An alkaloid compound which is a stimulant of the central nervous system. It is mainly used recreationally, as a mild cognitive enhancer to increase alertness and attentional performance. |
| Extreme sport | Action sports, adventure sports or extreme sports are activities perceived as involving a high degree of risk. |
| High-intensity interval training | It incorporates several rounds that alternate between several minutes of high intensity movements to significantly increase the heart rate to at least 80% of one's maximum heart rate, followed by short periods of lower intensity movements. |
| Shelf life | The length of time for which an item remains usable, fit for consumption, or saleable. |
| Cream Soda | Cream soda is a sweet soft drink. Generally flavored with vanilla and based on the taste of an ice cream float |
| Root Beer | Root beer is a sweet North American soft drink traditionally made using the root bark of the sassafras tree Sassafras albidum or the vine of Smilax ornata as the primary flavor. Root beer is typically, but not exclusively, non-alcoholic, caffeine-free, sweet, and carbonated. |
| Vanilla Soda | A carbonated soft drink flavoured with vanilla. |
| Dairy-Free | A product that does not contain any milk or milk products from cows, sheep or goats. |
| Caffeine-Free Energy Drinks | Caffeine-free energy drinks rely on other ingredients to boost the energy. Popular choices include amino acids, B vitamins, and electrolytes. |


Research Methodology
Mordor Intelligence follows a four-step methodology in all our reports.
- Step-1: IDENTIFY KEY VARIABLES: In order to build a robust forecasting methodology, the variables and factors identified in Step 1 are tested against available historical market numbers. Through an iterative process, the variables required for market forecast are set, and the model is built on the basis of these variables.
- Step-2: Build a Market Model: Market-size estimations for the forecast years are in nominal terms. Inflation is not a part of the pricing, and the average selling price (ASP) is kept constant throughout the forecast period for each country.
- Step-3: Validate and Finalize: In this important step, all market numbers, variables, and analyst calls are validated through an extensive network of primary research experts from the market studied. The respondents are selected across levels and functions to generate a holistic picture of the market studied.
- Step-4: Research Outputs: Syndicated reports, custom consulting assignments, databases & subscription platforms


