Europe Polyamide Market Size and Share
Market Overview
| Study Period | 2020 - 2031 |
|---|---|
| Forecast Data Period | 2026 - 2031 |
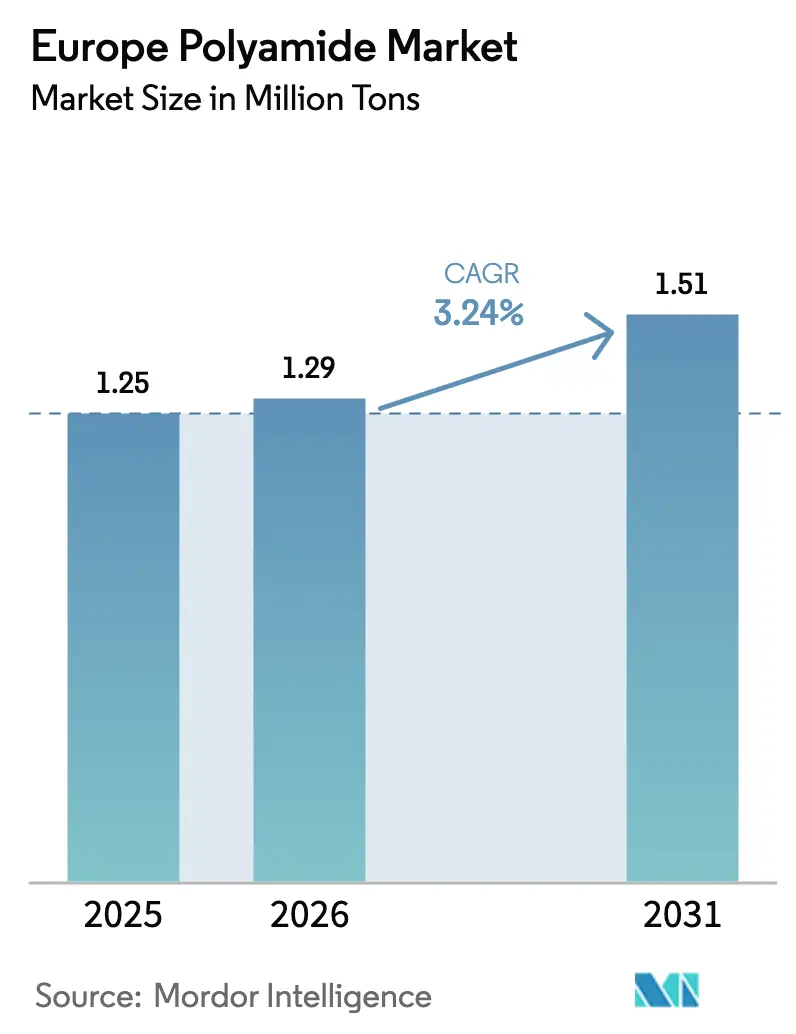
| Base Year Market Size (2025) | 1.25 Million tons |
| Market Volume (2026) | 1.29 Million tons |
| Market Volume (2031) | 1.51 Million tons |
| Growth Rate (2026 - 2031) | 3.24% CAGR |
| Market Concentration | High |
Major Players *Disclaimer: Major Players sorted in no particular order Image © Mordor Intelligence. Reuse requires attribution under CC BY 4.0. | |
Europe Polyamide Market Analysis by Mordor Intelligence
The Europe Polyamide Market size was valued at 1.25 Million tons in 2025 and estimated to grow from 1.29 Million tons in 2026 to reach 1.51 Million tons by 2031, at a CAGR of 3.24% during the forecast period (2026-2031). This outlook is shaped by tightening vehicle CO₂ limits, aerospace fuel-efficiency targets, and EU circular-economy legislation, all of which lift demand for advanced resin grades suited to light-weight structures and closed-loop recycling programs. Automotive OEMs intensify the shift from metal to polymer for under-hood, body-in-white, and e-powertrain parts, driving continuous grade innovation among compounders able to guarantee mechanical integrity at 150–180 °C. Parallel momentum comes from aerospace interior programs that require flame-retardant, low-smoke formulations with high dimensional stability under cabin pressurization cycles. At the same time, feedstock volatility, stricter VOC caps, and low-cost Asian supply put pressure on commodity PA6 margins, prompting European suppliers to streamline portfolios around specialty and recycled content offerings. Near-shoring in Hungary, Poland, and the Czech Republic adds fresh capacity close to EU end-users and mitigates geopolitical freight risk, while chemical-recycling pilots funded by Paris and Brussels start to close the materials loop for post-consumer carpets, nets, and molded scrap.
Key Report Takeaways
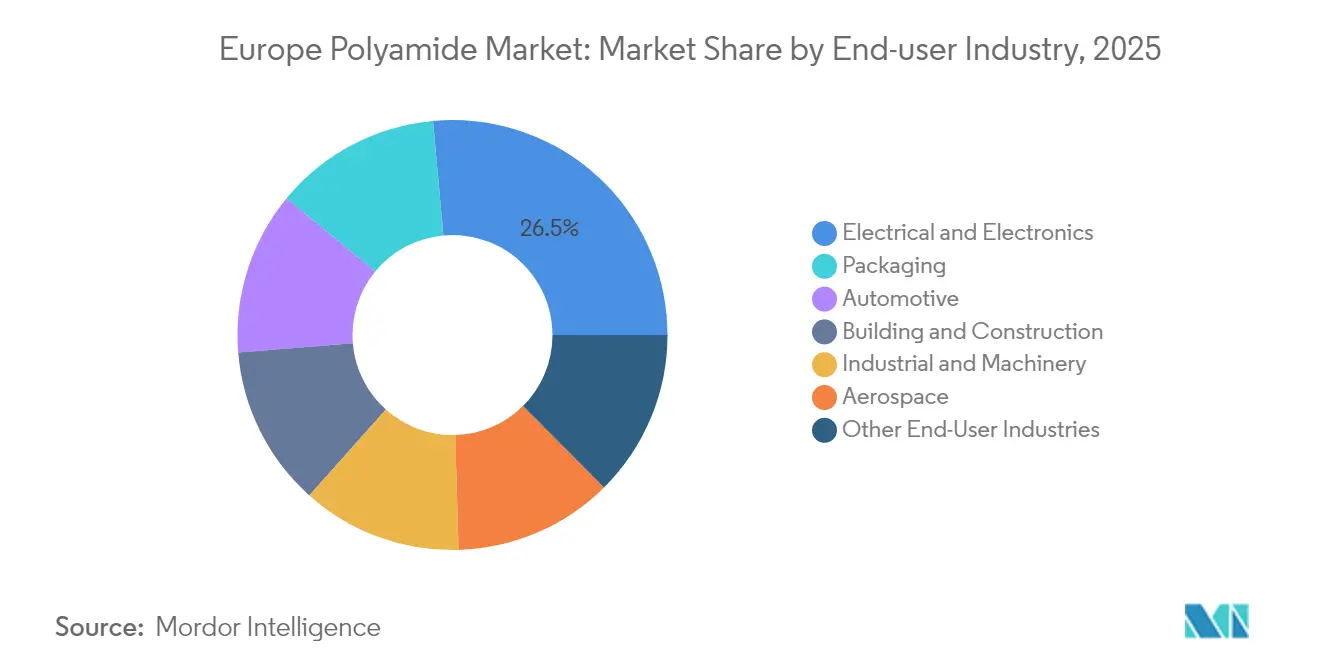
- By end-user, electrical and electronics held 26.45% of the Europe polyamide market share in 2025, while packaging is projected to expand at a 6.35% CAGR to 2031.
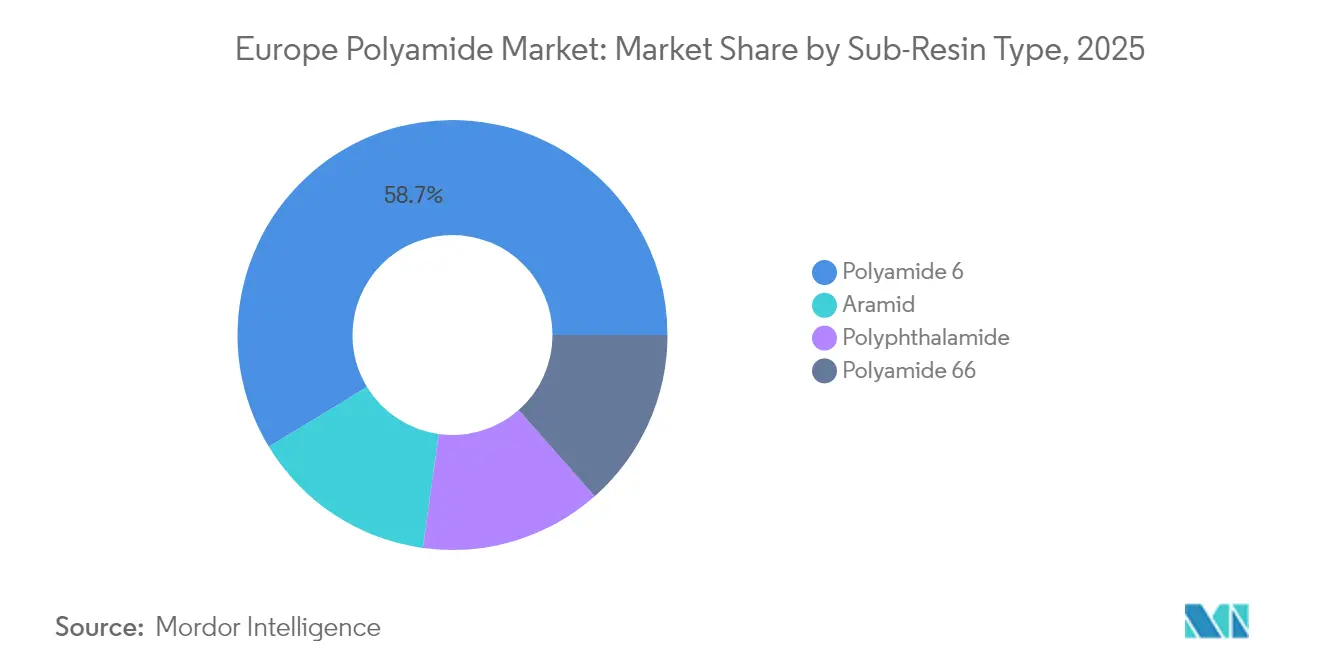
- By sub-resin type, Polyamide 6 commanded 58.70% of Europe polyamide market share in 2025; Aramid is projected to advance at a 4.12% CAGR through 2031.
- By geography, Germany led with 26.05% share in 2025, whereas France is set to post the highest 4.10% CAGR by 2031.
Note: Market size and forecast figures in this report are generated using Mordor Intelligence’s proprietary estimation framework, updated with the latest available data and insights as of 2026.
Europe Polyamide Market Trends and Insights
Driver Impact Analysis*
| Drivers | (~) % Impact on CAGR Forecast | Geographic Relevance | Impact Timeline |
|---|---|---|---|
| Lightweighting push in automotive manufacturing | +0.8% | Germany, France, Italy | Medium term (2-4 years) |
| Substitution of metals in aerospace interiors | +0.6% | France, Germany, United Kingdom | Long term (≥ 4 years) |
| Electrification-driven demand for heat-resistant polymers | +0.9% | Germany, France, Rest of Europe | Medium term (2-4 years) |
| EU circular-economy grants for chemical-recycling plants | +0.4% | France, Germany, Italy | Long term (≥ 4 years) |
| Near-shoring of synthetic-fiber output in Eastern Europe | +0.3% | Rest of Europe, Germany | Medium term (2-4 years) |
| Source: Mordor Intelligence | |||


Lightweighting Push in Automotive Manufacturing
CO₂ fleet-average limits falling to 95 g/km by 2030 force European automakers to cut vehicle mass in every subsystem. Substituting steel or aluminum with glass-fiber-reinforced PA 6.6 saves up to 50% weight per component while preserving crash-energy absorption, so compounders in Spain and Germany are scaling lines dedicated to these grades. BASF added 5 kt of capacity at its Spanish site in 2024 to supply OEM programs scheduled for 2027 model launches. Tier-1 suppliers are integrating bio-based hexamethylenediamine to push cradle-to-gate CO₂ figures below 2 kg CO₂-eq per kg of polymer. Component validation now spans under-hood, body-panel, and battery-enclosure use, broadening the addressable volume well beyond traditional air-intake manifolds. The shift also benefits Eastern European molders, which secure ISO/TS 16949 certification to serve German final assemblies at lower conversion cost.
Substitution of Metals in Aerospace Interiors
European cabin-interior manufacturers target 30–40% part-weight reduction by switching from aluminum to flame-retardant polyamide composites that retain FAR 25.853 compliance. The materials meet low-smoke toxicity criteria while permitting complex geometries essential for next-generation galleys and seats. Airbus suppliers in France deepen collaboration with local resin producers to guarantee traceable, REACH-compliant input streams, which shortens qualification lead times and minimizes customs risk. Polyamide components also integrate electromagnetic shielding additives that simplify avionics installation without extra foil layers. Weight reduction directly lowers kerosene burn, supporting the flight operator’s 2030 sustainable-aviation-fuel roadmap and strengthening the long-term pull for high-performance PA grades.
Electrification-Driven Demand for Heat-Resistant Polymers
EV penetration surpasses 25% of new-car registrations in major EU markets by 2025, pushing average battery-pack voltages beyond 800 V and intensifying thermal stress on connectors and busbars. Glass-fiber-filled PA 6.6 withstands 180 °C continuous service, making it the material of choice for inverter housings and onboard chargers. DOMO inaugurated a 50 kt pa TECHNYL plant in China in 2024 to back-integrate Asian module suppliers linked to European automakers, securing global supply alignment. Within Europe, compounders refine laser-weldable grades that improve process yield in high-volume battery pack assembly. Renewable power segments mirror the trend: wind-turbine junction boxes now specify 25% glass-filled PA 6.6 for elevated-temperature endurance under on-shore heat-island conditions.
EU Circular-Economy Grants for Chemical-Recycling Plants
France activated a EUR 500 million grant scheme in 2024 that underwrites up to 40% of capital expenditure for depolymerization units converting post-consumer nylon waste into virgin-equivalent monomer. Projects such as UPCYCLON focus on discarded fishing nets, while SOLSTICE addresses carpet loops[1]Publications Office of the European Union, “Study on Support to R&I Policy in the Area of Bio-based Products,” OP.EUROPA.EU . ISCC PLUS mass-balance certification allows producers to market recycled-content grades to automotive and electronics OEMs without re-qualifying mechanical properties. The regulatory framework, therefore, both secures alternative caprolactam sources and delivers scope-3 emission credits to downstream brand owners. Germany and Italy plan similar funds, signalling an EU-wide pivot toward chemical recycling that could account for up to 15% of regional polyamide feedstock by 2030.
Restraint Impact Analysis*
| Restraints | (~) % Impact on CAGR Forecast | Geographic Relevance | Impact Timeline |
|---|---|---|---|
| Caprolactam feedstock price volatility | -0.7% | Germany, Italy, Rest of Europe | Short term (≤ 2 years) |
| Stricter EU VOC-emission limits on polymerization units | -0.4% | Germany, France, Italy | Medium term (2-4 years) |
| Emerging bio-polyester competition in niche films | -0.2% | France, Germany, United Kingdom | Long term (≥ 4 years) |
| Source: Mordor Intelligence | |||
Caprolactam Feedstock Price Volatility
Spot caprolactam traded between EUR 1,800 and EUR 2,400 per ton during 2024, compressing spreads for PA 6 producers that lack integrated upstream units. Energy cost surges tied to natural-gas supply disruptions amplified the swings, forcing processors to carry safety stocks that tied up working capital at elevated price points. Vertically integrated players in Germany buffered the impact through internal monomer transfer pricing, while independent compounders in Italy and Central Europe struggled to hedge exposure. The volatility distorted quarterly tender cycles, prompting some converters to adopt index-linked contracts that transfer risk downstream, yet OEMs resisted pass-through, slicing processor margins and delaying new-grade adoption.
Stricter EU VOC-Emission Limits on Polymerization Units
Regulation (EU) 2024/1244 expands mandatory reporting of organic-compound releases and lowers permitted thresholds for adipic acid, HMD, and solvent residuals starting in 2027[2]European Union, “Regulation (EU) 2024/1244,” EUR-LEX.EUROPA.EU. Legacy polymerization trains in Western Europe require vapor-phase scrubbers and regenerative thermal oxidizers to remain compliant, with retrofit bills ranging from EUR 10 million to EUR 20 million per site. Plants installed after 2015 already feature closed-loop off-gas recovery, granting them a cost advantage once the directive enters force. Compliance mandates also extend to monitoring PFAS used in specialty grades, compelling formulators to transition toward non-fluorinated processing aids. Capital allocation, therefore, favors sites committed to high-margin specialty and recycled content grades capable of absorbing environmental-capex costs.
*Our forecasts treat driver/restraint impacts as directional, not additive. The impact forecasts reflect baseline growth, mix effects, and variable interactions.
Segment Analysis
By End-User Industry: Electronics Lead Demand, Packaging Emerges as the Fastest Riser
The electrical and electronics segment consumed 26.45% of the Europe polyamide market size in 2025. Connector housings, circuit breakers, and smart-meter casings rely on glass-fiber-reinforced grades that guarantee dimensional accuracy under solder-reflow peaks of 260 °C. Telecom infrastructure roll-outs further elevate demand as 5G small-cell enclosures require RF-transparent yet flame-retardant materials. Automotive remains a close second; however, the functional convergence of infotainment and driver-assistance electronics inside vehicles magnifies polymer need regardless of the segment boundary. Building and construction keeps a stable pull for conduits and cable ties, where long-term creep resistance prevents maintenance downtime in commercial installations.
Packaging shows the fastest trajectory, projected to notch a 6.35% CAGR through 2031. European grocers escalate shelf-life goals to curb food waste by 30% under EU Farm-to-Fork targets, choosing high-barrier PA/EVOH multilayers that extend chilled-meat freshness. Premium pet-food brands shift toward mono-material PA structures that facilitate mechanical recycling without compromising oxygen barrier, unlocking additional tonnage. Film extruders now blend chemically recycled PA chips with virgin feedstock under ISCC PLUS mass-balance rules, enabling brand owners to claim circular content without altering extrusion conditions. Innovation also centers on vacuum-skin films, where low-gauge PA outer layers cut material use by 10% while retaining puncture resistance.


By Sub-Resin Type: Polyamide 6 Retains Scale Leadership While Aramid Outpaces Growth
Polyamide 6 accounted for 58.70% of the Europe polyamide market size in 2025, reflecting entrenched usage in molded automotive, fiber, and Electric and Electronics applications where processors prize its balanced mechanical profile and competitive cost. Vertically integrated producers supply a spectrum of viscosity windows, enabling compounders to tailor impact, stiffness, and heat resistance for target programs. Yet the segment faces margin squeeze as Asian capacity additions depress global price benchmarks, prompting European players to defend share through recycled-content variants certified to ISO 14021. Polyamide 66 preserves relevance in under-hood and high-heat connectors, where thermal stability delivers consistent electrical performance after 1,000 thermal cycles. Polyphthalamide gains traction in harsh chemical environments, especially EV battery environments relying on coolants that can leach unmodified PA grades.
Aramid represents the highest-growth sub-resin, with a 4.12% forecast CAGR through 2031 that, while from a modest base, outpaces every other group. Demand accelerates as aerospace and defense contractors incorporate para-aramid fibers into composite laminates that withstand ballistic and high-temperature incidents. European automotive-battery engineers also specify aramid papers as cell separators for enhanced thermal runaway protection. Domestic aramid suppliers leverage short supply chains and robust technical-service networks, offering application-specific fiber orientation and surface treatments. Their collaboration with French recycling schemes to recover aramid from end-of-life protective gear underscores circular-economy alignment and adds a premium narrative for downstream OEMs. Despite higher price points, aramid’s performance advantages justify adoption in critical-safety systems where failure risk carries disproportionate liability.
Geography Analysis
Germany captured 26.05% of regional volume in 2025 by virtue of its integrated chemical-automotive ecosystem, in which BASF, Evonik, LANXESS, and numerous Tier-1 molders operate within a 300 km corridor of major vehicle assembly plants. Polyamide grades move from polymerization reactors to injection machines in less than 24 hours, streamlining logistics and assuring line-side availability. The country’s drive toward electromobility reinforces domestic demand for flame-retardant PA 6.6 in high-voltage connectors, and its advanced regulatory environment rewards producers capable of meeting low VOC thresholds ahead of the 2027 compliance date.
France is projected to lead growth at a 4.10% CAGR, buoyed by a €500 million state aid framework that subsidizes chemical-recycling plants and by a robust aerospace cluster centered around Toulouse. Airbus and Safran source flame-retardant polyamide panels domestically, mitigating supply-chain risk and shortening development cycles. The recycling grants enable local producers to reduce reliance on imported caprolactam by integrating circular monomers derived from carpet and net waste streams.
Italy, the United Kingdom, and the Rest of Europe jointly deliver diversified demand drivers. Italian luxury-car producers specify carbon-fiber-reinforced PA for aesthetic under-bonnet parts where visual quality and heat resistance command high margins. The United Kingdom emphasizes defense and commercial aerospace, with qualification expertise that safeguards procurement of high-specification polymer parts despite added customs checks post-Brexit. Eastern Europe benefits from cost-competitive labor and proximity to Western OEMs; notable is MOL’s €1.3 billion polyol and polyamide intermediate complex in Hungary that supports regional electro-mobility component manufacturing.
Competitive Landscape
The Europe polyamide market displays consolidation. Technology leadership increasingly hinges on closed-loop strategies. BASF gained sole ownership of the Alsachimie site in July 2025, unlocking integration benefits across adipic acid, KA-oil, and AH salt trains and facilitating trials of bio-based adipic acid intermediates.
Europe Polyamide Industry Leaders
BASF
Domo Chemicals
DSM-Firmenich
LANXESS
Radici Partecipazioni SpA
- *Disclaimer: Major Players sorted in no particular order


Recent Industry Developments
- January 2025: BASF acquired DOMO Chemicals’ 49% stake in the Alsachimie joint venture, becoming sole owner of the Chalampé, France site that produces key PA 6.6 intermediates.
- February 2025: Lone Star Funds agreed to acquire RadiciGroup’s Specialty Chemicals and High Performance Polymers divisions, restructuring competitive dynamics in European PA supply.


Europe Polyamide Market Report Scope
Aerospace, Automotive, Building and Construction, Electrical and Electronics, Industrial and Machinery, Packaging are covered as segments by End User Industry. Aramid, Polyamide (PA) 6, Polyamide (PA) 66, Polyphthalamide are covered as segments by Sub Resin Type. France, Germany, Italy, Russia, United Kingdom are covered as segments by Country.| Aerospace |
| Automotive |
| Building and Construction |
| Electrical and Electronics |
| Industrial and Machinery |
| Packaging |
| Other End-User Industries |
| Aramid |
| Polyamide 6 |
| Polyamide 66 |
| Polyphthalamide |
| France |
| Germany |
| Italy |
| Russia |
| United Kingdom |
| Rest of Europe |
| By End-user Industry | Aerospace |
| Automotive | |
| Building and Construction | |
| Electrical and Electronics | |
| Industrial and Machinery | |
| Packaging | |
| Other End-User Industries | |
| By Sub-Resin Type | Aramid |
| Polyamide 6 | |
| Polyamide 66 | |
| Polyphthalamide | |
| By Geography | France |
| Germany | |
| Italy | |
| Russia | |
| United Kingdom | |
| Rest of Europe |


Market Definition
- End-user Industry - Building & Construction, Packaging, Automotive, Aerospace, Industrial Machinery, Electrical & Electronics, and Others are the end-user industries considered under the polyamide market.
- Resin - Under the scope of the study, virgin polyamide resins like Polyamide 6, Polyamide 66, Polyphthalamide, and Aramid in the primary forms are considered.
| Keyword | Definition |
|---|---|
| Acetal | This is a rigid material that has a slippery surface. It can easily withstand wear and tear in abusive work environments. This polymer is used for building applications such as gears, bearings, valve components, etc. |
| Acrylic | This synthetic resin is a derivative of acrylic acid. It forms a smooth surface and is mainly used for various indoor applications. The material can also be used for outdoor applications with a special formulation. |
| Cast film | A cast film is made by depositing a layer of plastic onto a surface then solidifying and removing the film from that surface. The plastic layer can be in molten form, in a solution, or in dispersion. |
| Colorants & Pigments | Colorants & Pigments are additives used to change the color of the plastic. They can be a powder or a resin/color premix. |
| Composite material | A composite material is a material that is produced from two or more constituent materials. These constituent materials have dissimilar chemical or physical properties and are merged to create a material with properties unlike the individual elements. |
| Degree of Polymerization (DP) | The number of monomeric units in a macromolecule, polymer, or oligomer molecule is referred to as the degree of polymerization or DP. Plastics with useful physical properties often have DPs in the thousands. |
| Dispersion | To create a suspension or solution of material in another substance, fine, agglomerated solid particles of one substance are dispersed in a liquid or another substance to form a dispersion. |
| Fiberglass | Fiberglass-reinforced plastic is a material made up of glass fibers embedded in a resin matrix. These materials have high tensile and impact strength. Handrails and platforms are two examples of lightweight structural applications that use standard fiberglass. |
| Fiber-reinforced polymer (FRP) | Fiber-reinforced polymer is a composite material made of a polymer matrix reinforced with fibers. The fibers are usually glass, carbon, aramid, or basalt. |
| Flake | This is a dry, peeled-off piece, usually with an uneven surface, and is the base of cellulosic plastics. |
| Fluoropolymers | This is a fluorocarbon-based polymer with multiple carbon-fluorine bonds. It is characterized by high resistance to solvents, acids, and bases. These materials are tough yet easy to machine. Some of the popular fluoropolymers are PTFE, ETFE, PVDF, PVF, etc. |
| Kevlar | Kevlar is the commonly referred name for aramid fiber, which was initially a Dupont brand for aramid fiber. Any group of lightweight, heat-resistant, solid, synthetic, aromatic polyamide materials that are fashioned into fibers, filaments, or sheets is called aramid fiber. They are classified into Para-aramid and Meta-aramid. |
| Laminate | A structure or surface composed of sequential layers of material bonded under pressure and heat to build up to the desired shape and width. |
| Nylon | They are synthetic fiber-forming polyamides formed into yarns and monofilaments. These fibers possess excellent tensile strength, durability, and elasticity. They have high melting points and can resist chemicals and various liquids. |
| PET preform | A preform is an intermediate product that is subsequently blown into a polyethylene terephthalate (PET) bottle or a container. |
| Plastic compounding | Compounding consists of preparing plastic formulations by mixing and/or blending polymers and additives in a molten state to achieve the desired characteristics. These blends are automatically dosed with fixed setpoints usually through feeders/hoppers. |
| Plastic pellets | Plastic pellets, also known as pre-production pellets or nurdles, are the building blocks for nearly every product made of plastic. |
| Polymerization | It is a chemical reaction of several monomer molecules to form polymer chains that form stable covalent bonds. |
| Styrene Copolymers | A copolymer is a polymer derived from more than one species of monomer, and a styrene copolymer is a chain of polymers consisting of styrene and acrylate. |
| Thermoplastics | Thermoplastics are defined as polymers that become soft material when it is heated and becomes hard when it is cooled. Thermoplastics have wide-ranging properties and can be remolded and recycled without affecting their physical properties. |
| Virgin Plastic | It is a basic form of plastic that has never been used, processed, or developed. It may be considered more valuable than recycled or already used materials. |


Research Methodology
Mordor Intelligence follows a four-step methodology in all our reports.
- Step-1: Identify Key Variables: The quantifiable key variables (industry and extraneous) pertaining to the specific product segment and country are selected from a group of relevant variables & factors based on desk research & literature review; along with primary expert inputs. These variables are further confirmed through regression modeling (wherever required).
- Step-2: Build a Market Model: In order to build a robust forecasting methodology, the variables and factors identified in Step-1 are tested against available historical market numbers. Through an iterative process, the variables required for market forecast are set and the model is built on the basis of these variables.
- Step-3: Validate and Finalize: In this important step, all market numbers, variables and analyst calls are validated through an extensive network of primary research experts from the market studied. The respondents are selected across levels and functions to generate a holistic picture of the market studied.
- Step-4: Research Outputs: Syndicated Reports, Custom Consulting Assignments, Databases & Subscription Platforms


