Polyamides Market Size and Share
Market Overview
| Study Period | 2021 - 2031 |
|---|---|
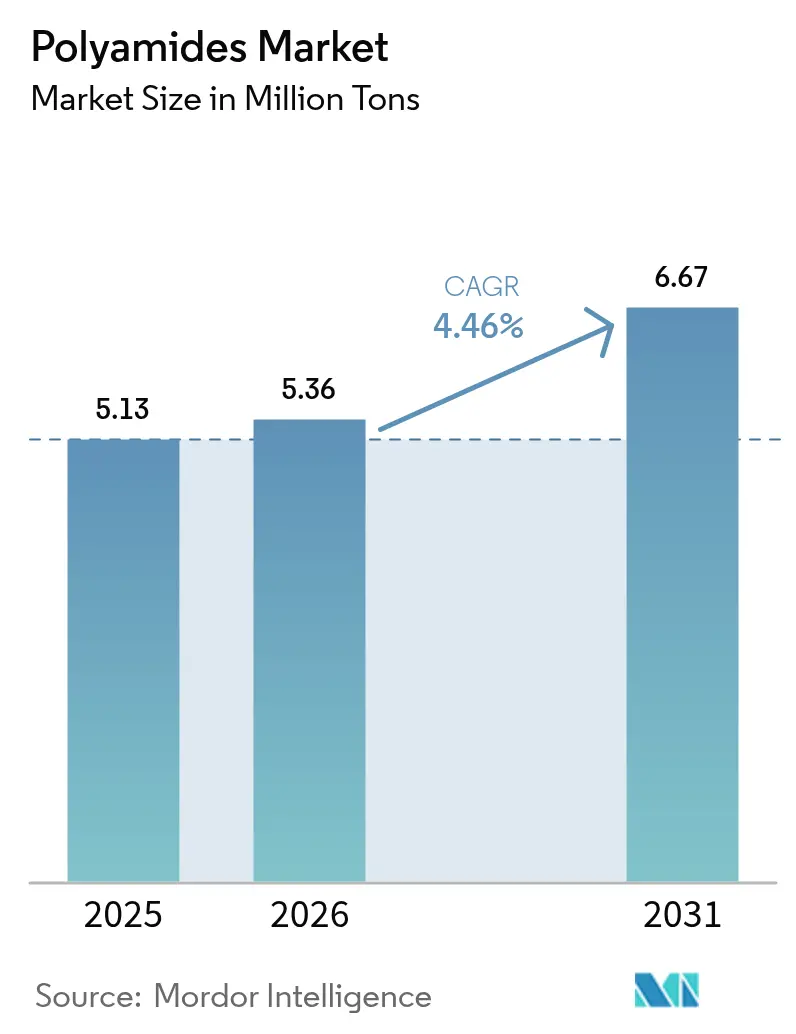
| Market Volume (2026) | 5.36 Million tons |
| Market Volume (2031) | 6.67 Million tons |
| Growth Rate (2026 - 2031) | 4.46% CAGR |
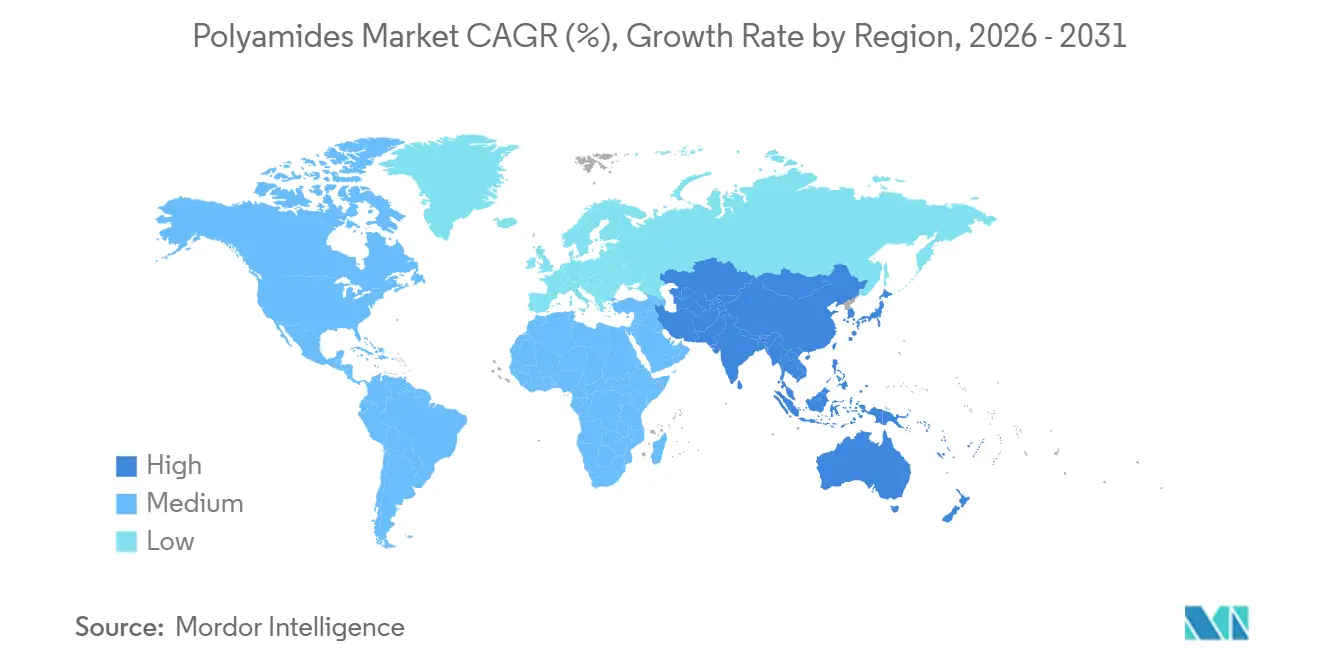
| Fastest Growing Market | Asia Pacific |
| Largest Market | Asia Pacific |
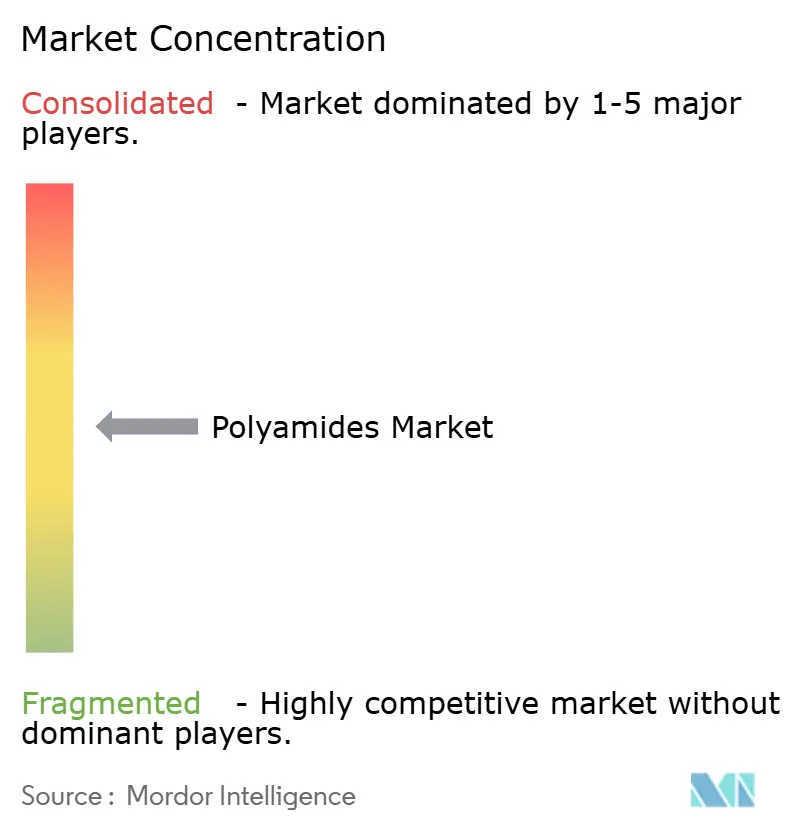
| Market Concentration | Medium |
Major Players *Disclaimer: Major Players sorted in no particular order Image © Mordor Intelligence. Reuse requires attribution under CC BY 4.0. | |
Polyamides Market Analysis by Mordor Intelligence
The Polyamides Market size is expected to grow from 5.13 Million tons in 2025 to 5.36 Million tons in 2026 and is forecast to reach 6.67 Million tons by 2031 at a 4.46% CAGR over 2026-2031. Demand is pivoting away from general-purpose textiles toward higher-margin mobility and electronics uses, a shift that tightens supply in specialty grades and pushes converters to secure multi-year resin contracts. Electrification is the prime catalyst, as battery-electric vehicles need polymers that survive 150°C coolant loops for 15 years, a duty cycle that polyamide 66 and polyphthalamide meet more reliably than polyamide 6. In parallel, brand-owner recyclability pledges are lifting barrier-film applications, with packaging volumes forecast to outpace the overall polyamides market through 2031. Asia-Pacific retains processing cost advantages and now houses more than half of global installed capacity, but local shortages of hexamethylenediamine are amplifying price premiums for PA 66 over PA 6.
Key Report Takeaways
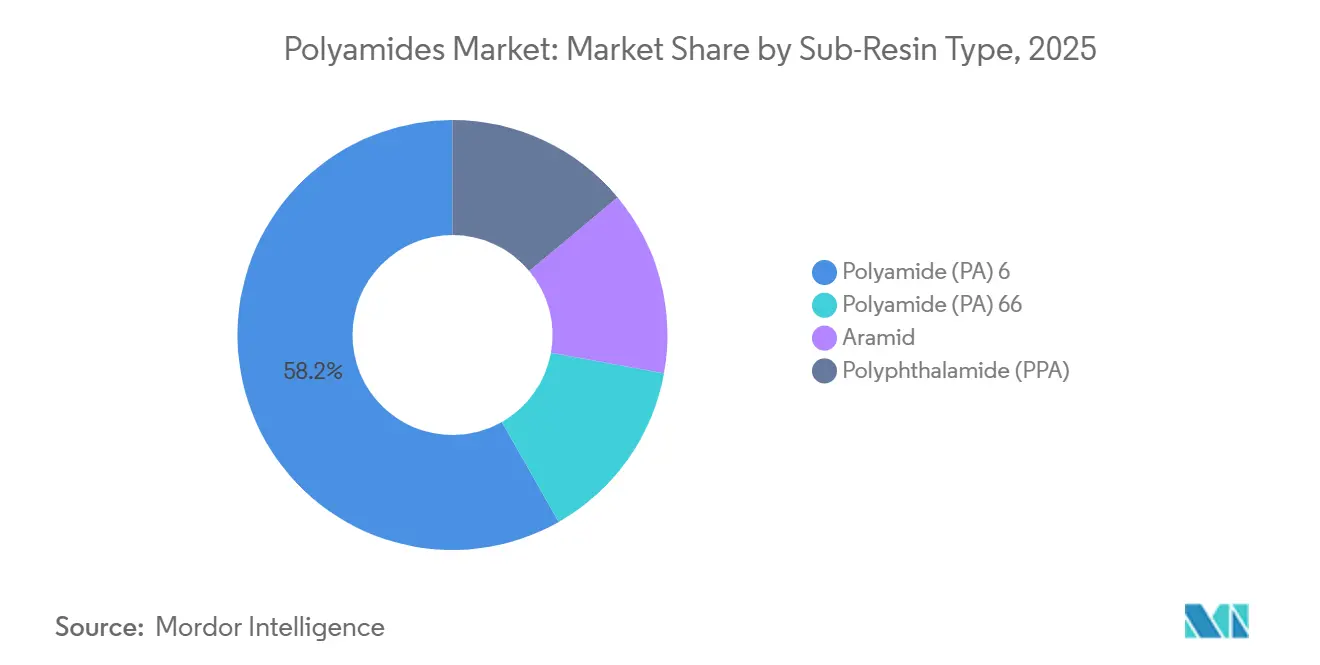
- By sub-resin type, PA 6 held 58.22% of the Polyamides market share in 2025. Polyamide 66 is expected to advance at the fastest 4.76% CAGR during the forecast period (2026-2031).
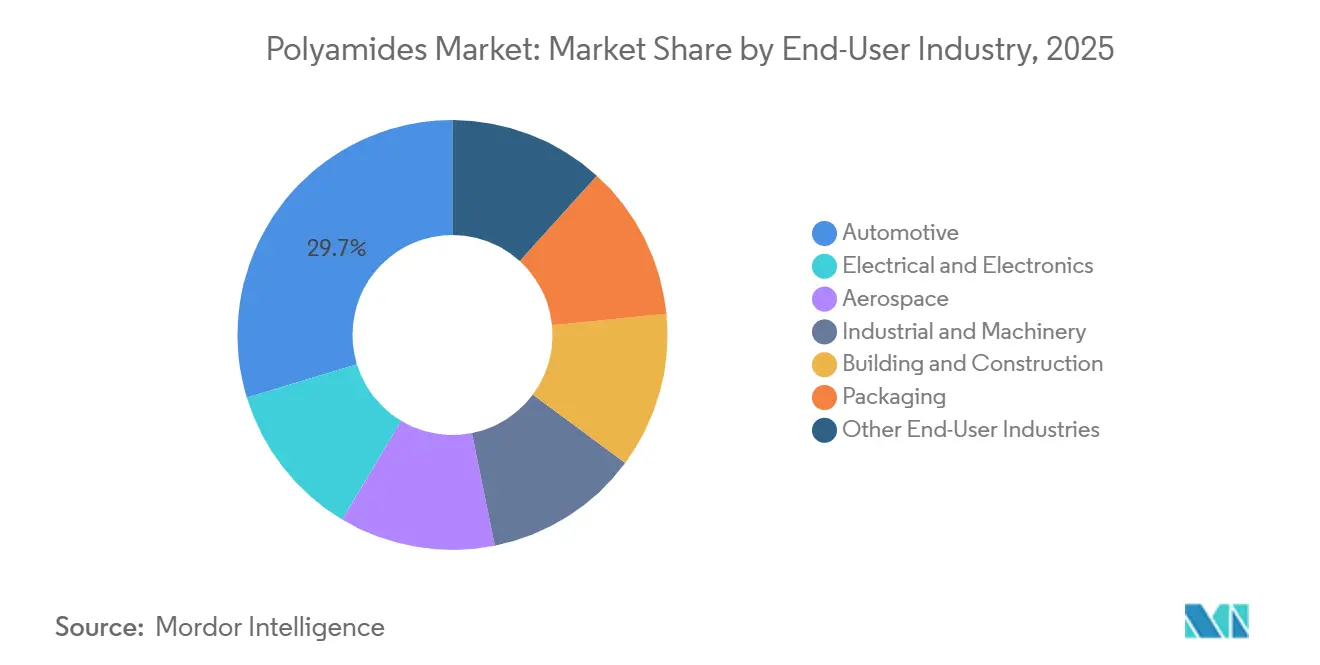
- By end-user industry, automotive led with 29.71% of the Polyamides market size in 2025. Packaging is expected to record the highest 6.10% CAGR during the forecast period (2026-2031).
- Asia-Pacific dominated with 51.12% of the Polyamides market share in 2025 and is expected to expand at a 4.92% CAGR during the forecast period (2026-2031).
Note: Market size and forecast figures in this report are generated using Mordor Intelligence’s proprietary estimation framework, updated with the latest available data and insights as of 2026.
Global Polyamides Market Trends and Insights
Drivers Impact Analysis*
| Driver | (~) % Impact on CAGR Forecast | Geographic Relevance | Impact Timeline |
|---|---|---|---|
| Surge in e-mobility wire-harness and thermal-management needs | +1.2% | China, Europe, North America | Medium term (2-4 years) |
| Growth in 5G electronics requiring high-temperature polymers | +0.8% | China, South Korea, Japan, plus North America and Europe | Short term (≤ 2 years) |
| Shift toward bio-based polyamides among consumer brands | +0.6% | Europe, North America, pilot projects in APAC | Long term (≥ 4 years) |
| Rapid adoption of PA 12 powders for on-demand spare-parts printing | +0.5% | North America, Europe, emerging in APAC | Medium term (2-4 years) |
| Closed-loop EU textile-to-textile nylon recycling partnerships | +0.4% | Germany, France, Italy, early pilots in North America | Long term (≥ 4 years) |
| Source: Mordor Intelligence | |||
E-Mobility Wire-Harness and Thermal-Management Acceleration
Battery-electric vehicles run hotter and longer than gasoline models, so OEMs (original equipment manufacturers) are replacing PVC (polyvinyl chloride) conduits with glass-reinforced PA 66 that delivers 30-35% weight savings while withstanding glycol-rich coolants at 150°C[1]“Technyl Red for Thermal Management,” Solvay, solvay.com. BASF introduced Ultramid Advanced N in 2025 with heat stabilizers that keep tensile strength above 50 MPa after 3,000 thermal cycles, meeting 15-year warranty targets. China’s new-energy vehicle output crossed 9 million units in 2025, a volume that has already consumed 40% of regional PA 66 nameplate capacity. Supply tension increased when Invista idled part of its Seaford HMDA (hexamethylenediamine) line, causing Asian spot premiums for PA 66 to jump USD 800–1,000 per ton over PA 6. Tier-one harness suppliers are therefore dual-sourcing PA 6 for non-critical channels, even as automakers press for PA 66 in high-heat zones.
5G Infrastructure and High-Temperature Electronics Demand
Next-generation base stations dissipate two to three times the heat of 4G units, forcing housing makers to specify PA 66 compounds that reach UL 94 V-0 at wall sections under 1.5 mm. Polyphthalamide offers an 80°C heat-deflection advantage over PA 6, enabling connectors to survive lead-free solder reflow at 260°C without blistering. China invested CNY 180 billion (USD 25 billion) in 5G towers during 2025, raising regional consumption of flame-retardant polyamides by 9% year over year[2]Ministry of Industry and Information Technology, “2025 5G Infrastructure Investment,” miit.gov.cn. Electronics OEMs benchmark polyamide against liquid-crystal polymers and PPS, so resin producers now bundle shorter molding cycles and lower scrap into value propositions that offset price differentials. In South Korea and Japan, telecom suppliers are standardizing on PA 9T grades that keep dielectric constants stable across 40°C to +85°C, a key design win over PA 6.
Bio-Based Polyamides and Scope 3 Disclosure Pressure
European apparel brands aiming to halve Scope 3 emissions by 2030 signed long-term contracts for castor-oil-based PA 11, despite 20–40% price premiums over fossil routes. Arkema’s Rilsan plant documents a 50% lower cradle-to-gate CO₂ footprint than adipic-acid chemistry, data that passes third-party life-cycle audits favored by retailers. BASF’s Loopamid project recycled 5,000 tons of fishing nets and carpets into virgin-grade PA 6 during 2025, with plans to quadruple capacity by 2027. DOMO’s DOMAMID MBB uses mass-balance accounting to deliver 40% bio-attributed content without altering compound formulations, easing converter adoption. Outside Europe, uptake is slower; Asian processors cite scarce sorted nylon waste and limited consumer willingness to pay green premiums.
PA 12 Powder Adoption in Additive Manufacturing
Selective-laser-sintered PA 12 parts now reach customers within 48 hours versus six weeks for machined aluminum, a lead-time advantage that convinced BMW and Airbus to print low-volume spares on demand. Evonik’s INFINAM grades align powder size to HP Multi Jet Fusion tolerances, producing ducting and intake manifolds whose tensile strengths land within 10% of injection-molded PA 12 benchmarks. Moisture resistance keeps dimensional change below 0.4% in humid climates, outperforming TPU and PA 11 in automotive service tests. Powder reuse falls off after two cycles because of particle agglomeration, capping economic batch sizes below 5,000 units. The technology’s sweet spot remains customized, or spare-parts runs where design flexibility outweighs unit cost.
Restraints Impact Analysis*
| Restraint | (~) % Impact on CAGR Forecast | Geographic Relevance | Impact Timeline |
|---|---|---|---|
| Persistent supply-demand imbalance for PA 66 base polymer | -0.9% | Asia-Pacific and North America | Short term (≤ 2 years) |
| Rising PET and PP substitution in flexible packaging films | -0.6% | Global, especially food packaging | Medium term (2-4 years) |
| EU microplastic pellet-loss regulation raising compliance cost | -0.3% | Europe, spillover to export-oriented APAC sites | Short term (≤ 2 years) |
| Source: Mordor Intelligence | |||
PA 66 Supply-Demand Imbalance and HMDA Constraints
Global HMDA capacity trails demand by about 200,000 tons a year, a deficit that widened when Invista curtailed US output in 2025. Spot PA 66 prices spiked to USD 4,500-5,000 per ton in North America, versus USD 3,200-3,500 for PA 6, squeezing margins for air-bag, under-hood, and connector applications where substitution is tough. Chinese coal-to-chemicals producers cut PA 66 runs by 8% in 2025 because of emission quotas, turning the polyamides market toward imports despite freight surcharges. Automotive suppliers face costly re-qualification if they switch to PA 6 or PPA, so most locked three-year off-take agreements at elevated prices. Relief is unlikely before 2028, when Ascend’s announced HMDA debottleneck in Alabama comes on stream.
PET and PP Substitution in Flexible Packaging
Metallized PET and high-barrier PP films now match 12-month shelf-life targets for dry snacks, at 15-20% lower material cost than PA-based laminates. Several EU food brands migrated from PA/PE to PET/PE structures in 2025 to tap existing PET recycling streams and meet EPR fee reductions. Oxygen-sensitive packs for meat, cheese, and coffee still rely on polyamide’s less than 5 cc/m²/day barrier, but mid-tier volumes are eroding by 3-4% annually. Film converters are responding with downgauged PA 6 layers and faster line speeds to defend total system cost. Unless resin suppliers close the price gap, PET and PP could displace an additional 100,000 tons of PA 6 demand by 2031.
*Our forecasts treat driver/restraint impacts as directional, not additive. The impact forecasts reflect baseline growth, mix effects, and variable interactions.
Segment Analysis
By Sub-Resin Type: PA 6 Breadth, PA 66 Specialty Upswing
Polyamide 6 delivered 58.22% of the Polyamides market share in 2025, supported by integrated caprolactam routes that keep cash costs 15% below PA 66. Automotive non-structural parts, textile filament, and industrial film dominate its consumption, yet moisture uptake above 2% limits electronic uses. Polyamide 66 is capturing the electrification dividend, posting a 4.76% CAGR during the forecast period (2026-2031) as EV coolant systems and 5G connectors demand its 80°C higher heat-deflection ceiling. The polyamides market size for PA 66 is projected to reach 2.1 million tons by 2031, equivalent to 31% of overall volume, even under HMDA supply tightness.
Specialties fill technical white space. Polyphthalamide is forecast to grow due to under-hood sensor adoption. Aramid fibers generate outsized revenue in ballistic armor and aerospace composites where tensile strengths exceed 3,000 MPa. ISO 1043-1 designations ensure each resin family stays traceable through stringent automotive PPAP and aerospace AS9100 audits, an administrative hurdle that deters rapid switching among grades.


By End-User Industry: Automotive Dominance, Packaging Momentum
Automotive claimed 29.71% of 2025 volume, anchored by wire harnesses, cooling lines, and air-intake manifolds that combine temperature resistance with 30-40% weight cuts over aluminum. Battery-electric vehicle output topped 14 million units worldwide in 2025, driving double-digit growth for glass-filled PA 66 in coolant manifolds and battery frames.
Packaging is smaller today but faster, expanding at a 6.10% CAGR during the forecast period (2026-2031) as brands seek recyclable mono-material barrier films. Polyamide keeps its edge in high-oxygen-barrier cheese, meat, and coffee pouches, although it cedes snack foods to cheaper PET and PP. Electrical and electronics remain the second-largest outlet, absorbing PA 66 and PPA in connectors that must satisfy UL 94 V-0 and RoHS halogen-free rules. Aerospace, building-and-construction, and general machinery each absorb less than 10% of global tonnage but generate premium margins because of stringent FAA (Federal Aviation Administration), NSF (National Sanitation Foundation), and ISO (International Organization for Standardization) mechanical specifications.
Geography Analysis
Asia-Pacific generated 51.12% of 2025 demand and is set to grow 4.92% annually during the forecast period (2026-2031), fueled by China’s EV output, India’s technical textiles, and ASEAN electronics hubs. BASF’s 400,000-ton Zhanjiang caprolactam-to-PA 6 complex that came online in 2025 secures local feedstock and cuts logistics costs for auto and textile customers. Envalior’s Singapore PA 66 plant supplies V-0 grades to 5G base-station molders, leveraging 100% renewable electricity to satisfy OEM Scope 2 audits. Despite capacity, regional HMDA shortages leave converters paying the world’s highest PA 66 premiums and occasionally back-integrating to PA 6 for non-critical parts.
North America ranks second. Ascend lifted PA 66 nameplate capacity in Florida by 10% during 2024, a move aimed at Ford and General Motors EV platforms that must meet USMCA content rules. AdvanSix’s Hopewell caprolactam facility continues to anchor PA 6 supply for packaging and industrial users. Mexico’s USD 100 billion auto-parts export engine pulls pail loads of PA 6 conduit and PA 66 connectors into the United States duty-free, offsetting some of the HMDA tightness north of the border.
Europe combines tough regulation with innovation. REACH microplastic constraints and Operation Clean Sweep certification added EUR 50,000-150,000 per extrusion site in compliance costs by 2025. Simultaneously, BASF’s Loopamid and DOMO’s MOVE4EARTH reclaimed 10,000 tons of post-consumer nylon in 2025, though mechanical recycling yields plateau at 60-70% because of dye contamination. Germany, France, and Italy drive automotive and machinery consumption, whereas Poland and Turkey specialize in low-cost textiles and flexible packaging. South America and Middle East-Africa remain under 5% of demand but are earmarked for future capacity as Brazil’s auto sector and Saudi Arabia’s petrochemicals diversify feed-stocks.

Competitive Landscape
The Polyamides market is moderately fragmented. Integration into adipic acid, caprolactam, or HMDA shelters these players from feedstock volatility, while specialty challengers chase circular inputs and bio-attributed mass-balance certificates. Patent filings in 2025 clustered around hydrolysis-resistant PA 66 for EV coolant tubes and improved powder reuse in PA 12 printing, signaling industry focus on longevity and sustainability.
Polyamides Industry Leaders
BASF
INVISTA
Arkema
Envalior
Ascend Performance Materials
- *Disclaimer: Major Players sorted in no particular order

Recent Industry Developments
- September 2025: BASF launched Ultramid H33 L, a thermoplastic polyamide with high water permeability for artificial sausage casings. The hydrophilic properties of Ultramid H enable smoke aromas to penetrate the casing and reach the sausage products during the smoking process.
- July 2025: Arkema invested USD 20 million in a new Rilsan Clear transparent polyamide unit in Singapore and is expected to begin operations in the first quarter of 2026. The expansion will triple Arkema's global production capacity of Rilsan Clear, transparent polyamides, to meet increasing worldwide demand for sustainable transparent materials.


Global Polyamides Market Report Scope
Polyamides (PAs), a versatile family of high-performance polymers, feature repeating amide bonds in their molecular chains. Found both in nature (as in silk, wool, and proteins) and synthesized, they are most famously recognized as Nylon. Renowned for their mechanical strength, thermal stability, and wear resistance, PAs find extensive applications in the automotive, textile, and machinery sectors.
The Polyamides market is segmented by sub-resin type, end-user industry, and geography. By sub-resin type, the market is segmented into polyamide (PA) 6, polyamide (PA) 66, aramid, and polyphthalamide (PPA). By end-user industry, the market is segmented into automotive, electrical and electronics, aerospace, industrial and machinery, building and construction, packaging, and other end-user industries. The report also covers the market size and forecasts for the Polyamides market in 20 countries across major regions. For each segment, the market sizing and forecasts have been done on the basis of volume (tons).
| Polyamide (PA) 6 |
| Polyamide (PA) 66 |
| Aramid |
| Polyphthalamide (PPA) |
| Automotive |
| Electrical and Electronics |
| Aerospace |
| Industrial and Machinery |
| Building and Construction |
| Packaging |
| Other End-User Industries |
| Asia-Pacific | China |
| Japan | |
| India | |
| South Korea | |
| Australia | |
| Malaysia | |
| Rest of Asia-Pacific | |
| North America | Canada |
| Mexico | |
| United States | |
| Europe | Germany |
| France | |
| Italy | |
| United Kingdom | |
| Russia | |
| Rest of Europe | |
| South America | Brazil |
| Argentina | |
| Rest of South America | |
| Middle-East and Africa | Saudi Arabia |
| United Arab Emirates | |
| Nigeria | |
| South Africa | |
| Rest of Middle-East and Africa |
| By Sub-Resin Type | Polyamide (PA) 6 | |
| Polyamide (PA) 66 | ||
| Aramid | ||
| Polyphthalamide (PPA) | ||
| By End-User Industry | Automotive | |
| Electrical and Electronics | ||
| Aerospace | ||
| Industrial and Machinery | ||
| Building and Construction | ||
| Packaging | ||
| Other End-User Industries | ||
| By Geography | Asia-Pacific | China |
| Japan | ||
| India | ||
| South Korea | ||
| Australia | ||
| Malaysia | ||
| Rest of Asia-Pacific | ||
| North America | Canada | |
| Mexico | ||
| United States | ||
| Europe | Germany | |
| France | ||
| Italy | ||
| United Kingdom | ||
| Russia | ||
| Rest of Europe | ||
| South America | Brazil | |
| Argentina | ||
| Rest of South America | ||
| Middle-East and Africa | Saudi Arabia | |
| United Arab Emirates | ||
| Nigeria | ||
| South Africa | ||
| Rest of Middle-East and Africa | ||


Market Definition
- End-user Industry - Automotive, Electrical & Electronics, Industrial & Machinery, Building & Construction, and Others are the end-user industries considered under the polyamide market.
- Resin - Under the scope of the study, consumption of virgin polyamide resins like Polyamide 6, Polyamide 66, Polyphthalamide, and Aramid in the primary forms are considered. Recycling has been provided separately under its individual chapter.
| Keyword | Definition |
|---|---|
| Acetal | This is a rigid material that has a slippery surface. It can easily withstand wear and tear in abusive work environments. This polymer is used for building applications such as gears, bearings, valve components, etc. |
| Acrylic | This synthetic resin is a derivative of acrylic acid. It forms a smooth surface and is mainly used for various indoor applications. The material can also be used for outdoor applications with a special formulation. |
| Cast film | A cast film is made by depositing a layer of plastic onto a surface then solidifying and removing the film from that surface. The plastic layer can be in molten form, in a solution, or in dispersion. |
| Colorants & Pigments | Colorants & Pigments are additives used to change the color of the plastic. They can be a powder or a resin/color premix. |
| Composite material | A composite material is a material that is produced from two or more constituent materials. These constituent materials have dissimilar chemical or physical properties and are merged to create a material with properties unlike the individual elements. |
| Degree of Polymerization (DP) | The number of monomeric units in a macromolecule, polymer, or oligomer molecule is referred to as the degree of polymerization or DP. Plastics with useful physical properties often have DPs in the thousands. |
| Dispersion | To create a suspension or solution of material in another substance, fine, agglomerated solid particles of one substance are dispersed in a liquid or another substance to form a dispersion. |
| Fiberglass | Fiberglass-reinforced plastic is a material made up of glass fibers embedded in a resin matrix. These materials have high tensile and impact strength. Handrails and platforms are two examples of lightweight structural applications that use standard fiberglass. |
| Fiber-reinforced polymer (FRP) | Fiber-reinforced polymer is a composite material made of a polymer matrix reinforced with fibers. The fibers are usually glass, carbon, aramid, or basalt. |
| Flake | This is a dry, peeled-off piece, usually with an uneven surface, and is the base of cellulosic plastics. |
| Fluoropolymers | This is a fluorocarbon-based polymer with multiple carbon-fluorine bonds. It is characterized by high resistance to solvents, acids, and bases. These materials are tough yet easy to machine. Some of the popular fluoropolymers are PTFE, ETFE, PVDF, PVF, etc. |
| Kevlar | Kevlar is the commonly referred name for aramid fiber, which was initially a Dupont brand for aramid fiber. Any group of lightweight, heat-resistant, solid, synthetic, aromatic polyamide materials that are fashioned into fibers, filaments, or sheets is called aramid fiber. They are classified into Para-aramid and Meta-aramid. |
| Laminate | A structure or surface composed of sequential layers of material bonded under pressure and heat to build up to the desired shape and width. |
| Nylon | They are synthetic fiber-forming polyamides formed into yarns and monofilaments. These fibers possess excellent tensile strength, durability, and elasticity. They have high melting points and can resist chemicals and various liquids. |
| PET preform | A preform is an intermediate product that is subsequently blown into a polyethylene terephthalate (PET) bottle or a container. |
| Plastic compounding | Compounding consists of preparing plastic formulations by mixing and/or blending polymers and additives in a molten state to achieve the desired characteristics. These blends are automatically dosed with fixed setpoints usually through feeders/hoppers. |
| Plastic pellets | Plastic pellets, also known as pre-production pellets or nurdles, are the building blocks for nearly every product made of plastic. |
| Polymerization | It is a chemical reaction of several monomer molecules to form polymer chains that form stable covalent bonds. |
| Styrene Copolymers | A copolymer is a polymer derived from more than one species of monomer, and a styrene copolymer is a chain of polymers consisting of styrene and acrylate. |
| Thermoplastics | Thermoplastics are defined as polymers that become soft material when it is heated and becomes hard when it is cooled. Thermoplastics have wide-ranging properties and can be remolded and recycled without affecting their physical properties. |
| Virgin Plastic | It is a basic form of plastic that has never been used, processed, or developed. It may be considered more valuable than recycled or already used materials. |


Research Methodology
Mordor Intelligence follows a four-step methodology in all our reports.
- Step-1: Identify Key Variables: The quantifiable key variables (industry and extraneous) pertaining to the specific product segment and country are selected from a group of relevant variables & factors based on desk research & literature review; along with primary expert inputs. These variables are further confirmed through regression modeling (wherever required).
- Step-2: Build a Market Model: In order to build a robust forecasting methodology, the variables and factors identified in Step-1 are tested against available historical market numbers. Through an iterative process, the variables required for market forecast are set and the model is built on the basis of these variables.
- Step-3: Validate and Finalize: In this important step, all market numbers, variables and analyst calls are validated through an extensive network of primary research experts from the market studied. The respondents are selected across levels and functions to generate a holistic picture of the market studied.
- Step-4: Research Outputs: Syndicated Reports, Custom Consulting Assignments, Databases & Subscription Platforms


