Europe Non-dairy Yogurt Market Size and Share
Market Overview
| Study Period | 2026 - 2031 |
|---|---|
| Forecast Data Period | 2026 - 2031 |
| Historical Data Period | |
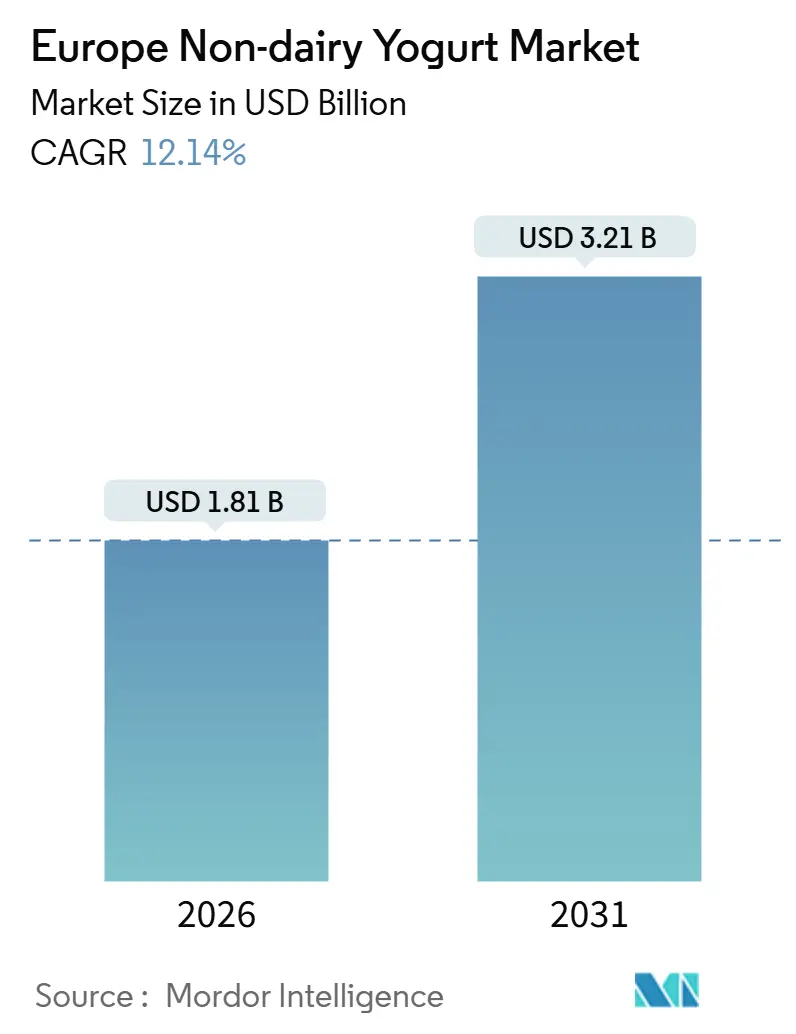
| Market Size (2026) | USD 1.81 Billion |
| Market Size (2031) | USD 3.21 Billion |
| Growth Rate (2026 - 2031) | 12.14% CAGR |
| Market Concentration | Medium |
Major Players *Disclaimer: Major Players sorted in no particular order Image © Mordor Intelligence. Reuse requires attribution under CC BY 4.0. | |
Europe Non-dairy Yogurt Market Analysis by Mordor Intelligence
The Europe non-dairy yogurt market is projected to grow from USD 1.81 billion in 2026 to USD 3.21 billion by 2031, registering a Compound Annual Growth Rate (CAGR) of 12.14%. This growth is driven by increasing demand for plant-based nutrition, influenced by rising lactose intolerance, the adoption of vegan and flexitarian diets, and environmental concerns associated with cattle farming. Soy yogurt maintains its leading position due to established raw-material logistics and a balanced amino acid profile. Meanwhile, oat yogurt is experiencing the fastest growth within the category, supported by its creamy texture, high fiber content, and successful cross-promotion with oat-based beverages. Drinkable non-dairy yogurt alternatives are outpacing spoonable formats, as consumers prioritize protein-rich, convenient options suitable for busy urban lifestyles. The retail landscape has shifted significantly toward supermarkets, hypermarkets, and e-commerce platforms, enabling both specialist brands and established dairy companies to rapidly test new flavors and functional product offerings. Competitive intensity remains moderate, with multinational companies leveraging economies of scale and plant conversions, while agile start-ups and private-label brands accelerate innovation cycles.
Key Report Takeaways
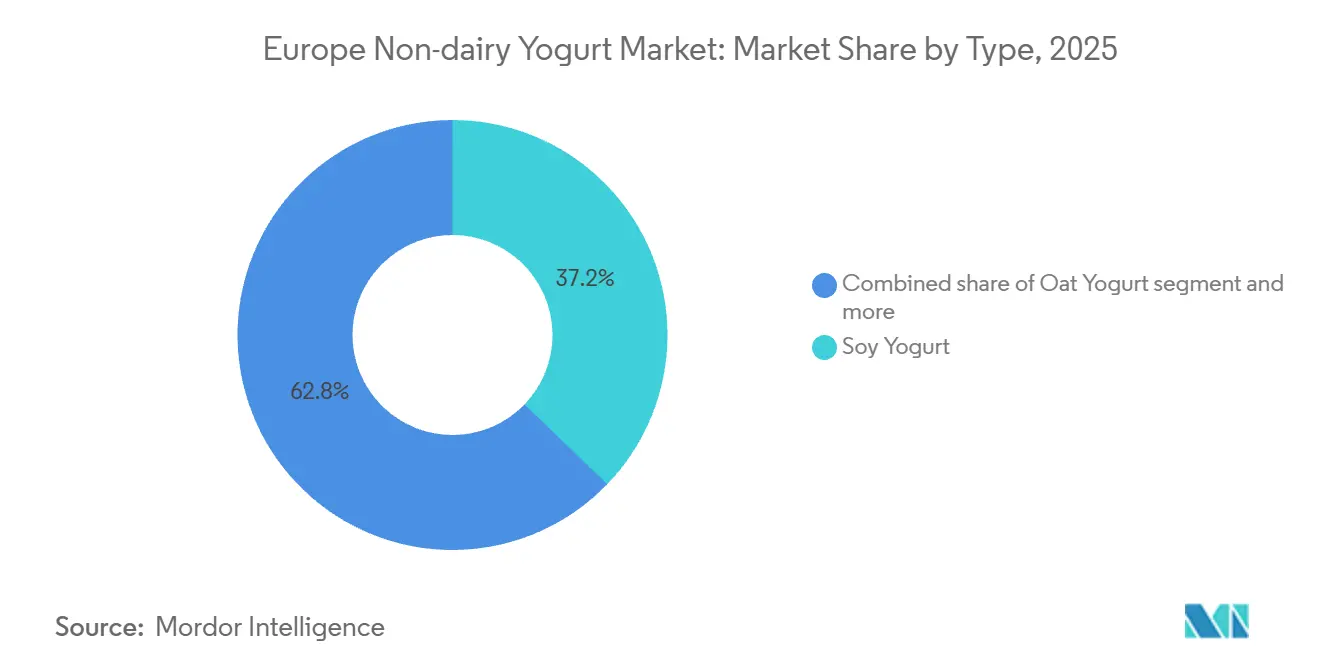
- By type, soy yogurt held 37.21% of Europe non-dairy yogurt market share in 2025, whereas oat yogurt is set to post a 12.43% CAGR to 2031.
- By category, spoonable products retained 49.43% share of the Europe non-dairy yogurt market size in 2025, while drinkable formats are advancing at 12.12% CAGR through 2031.
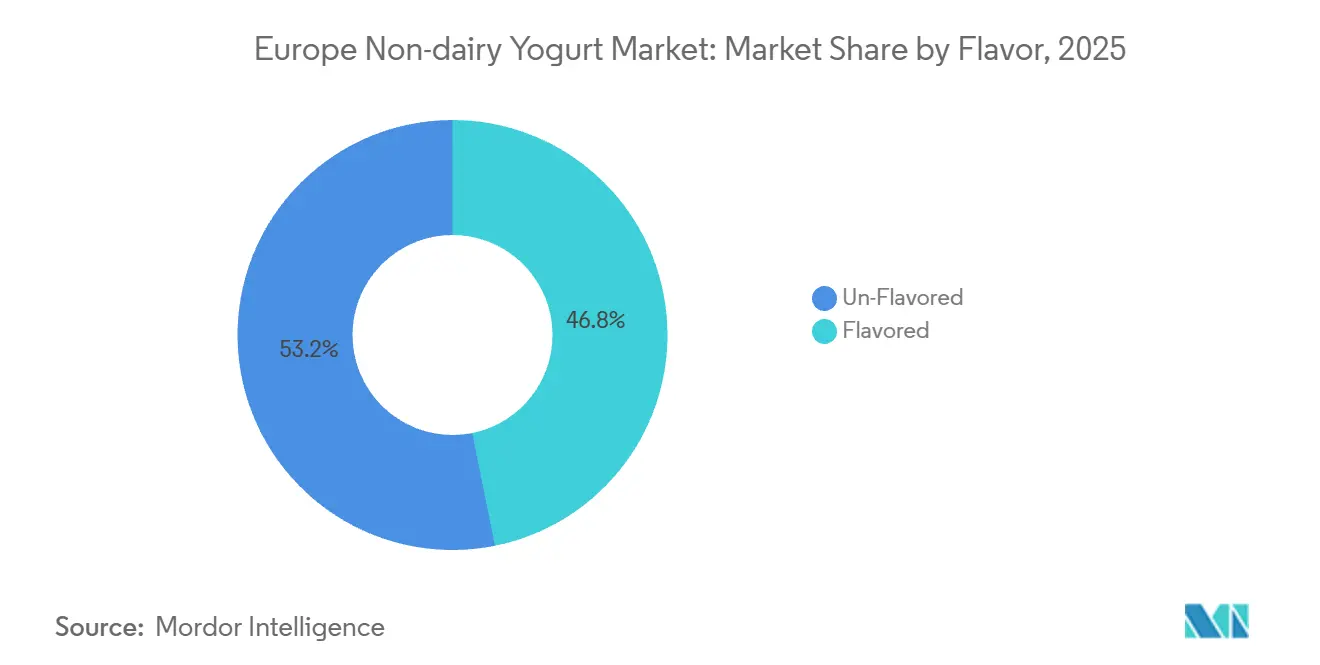
- By flavor, flavored variants captured 46.83% revenue share in 2025 and are growing at a 10.90% CAGR toward 2031.
- By distribution channel, off-trade outlets commanded 63.23% of Europe non-dairy yogurt market size in 2025; online retail is the quickest climber at 11.23% CAGR to 2031.
- By geography, the United Kingdom led with 21.43% share in 2025, whereas Spain is forecast to expand at an 11.29% CAGR through 2031.
Note: Market size and forecast figures in this report are generated using Mordor Intelligence’s proprietary estimation framework, updated with the latest available data and insights as of January 2026.
Europe Non-dairy Yogurt Market Trends and Insights
Drivers Impact Analysis*
| Driver | (~)% Impact on CAGR Forecast | Geographic Relevance | Impact Timeline |
|---|---|---|---|
| Rising lactose intolerance and dairy sensitivities among consumers | + 1.8% | Global, with elevated prevalence in Southern and Eastern Europe | Medium term (2-4 years) |
| Growing adoption of vegan and flexitarian diets | + 2.3% | Western Europe core, expanding to Central and Eastern Europe | Medium term (2-4 years) |
| Increasing health consciousness favoring plant-based nutrition | + 2.1% | Pan-European, strongest in Nordics and UK | Medium term (2-4 years) |
| Organic certification demand in premium segments | + 1.2% | Germany, France, Netherlands, Austria | Long term (≥4 years) |
| Flavored varieties appealing to broader tastes | + 1.5% | UK, Spain, Italy, France | Short term (≤2 years) |
| Versatility in breakfast, snacks, and recipes | + 1.4% | Northern and Western Europe, urban centers | Medium term (2-4 years) |
| Source: Mordor Intelligence | |||


Rising lactose intolerance and dairy sensitivities among consumers
Lactose intolerance affects a significant portion of the Southern European population, creating a substantial market for non-dairy alternatives that extends beyond ethical veganism. Plant-based yogurts fortified with calcium, vitamin D2, and vitamin B12 provide nutritional equivalence to dairy products, addressing potential deficiencies for consumers avoiding conventional yogurt. Danone S.A. markets Alpro's soy-based yogurt alternatives with 120 milligrams of calcium per 100 grams and 15% of the nutrient reference values for vitamins D2 and B12, aligning closely with the nutritional profile of dairy yogurt. The regulatory framework under European Union (EU) Regulation 1169/2011 requires clear allergen labeling, enabling lactose-intolerant consumers to confidently identify suitable products. Fortification strategies are consistent with World Health Organization (WHO) recommendations for food fortification as a public health measure, enhancing the credibility of plant-based yogurt offerings. This driver is expected to have a medium-term impact as manufacturers continue to refine fortification processes and expand retail assortments to better serve lactose-free consumers.
Growing adoption of vegan and flexitarian diets
The majority of European consumers aged 18 to 24 include plant-based dairy alternatives in their diets, with a penetration rate three times higher than that of consumers over 55. This indicates a generational shift in dietary preferences. The Netherlands has established a national target to achieve 50% animal-to-plant protein consumption by 2030, supported by government initiatives such as precision fermentation and plant-based innovation hubs like Food Valley [1]Source: Good Food Institute, “Plant-based retail sales in six European countries, 2022 to 2024,” gfieurope.org. In Poland, a significant percentage of consumers express an intention to increase plant-based yogurt consumption. However, only 47% are familiar with the category, suggesting latent demand hindered by limited distribution and awareness. In Germany, the plant-based yogurt market has grown, demonstrating that flexitarian consumers prioritize value and accessibility over premium branding. Adherence to International Organization for Standardization (ISO) 22000 food safety standards and voluntary B-Corp certifications, such as those adopted by Ecotone's Kallø brand, strengthens trust among ethically conscious consumers. In the medium term, the market is expected to benefit from ongoing retail expansion and the normalization of plant-based options across mainstream distribution channels.
Increasing health consciousness favoring plant-based nutrition
Plant-based yogurts provide 80% lower saturated fat and zero cholesterol compared to full-fat dairy yogurt, aligning with dietary recommendations from the United Kingdom (UK) Eatwell Guide and Swedish Food Circle, which emphasize reducing saturated fat intake. Oat-based formulations deliver 0.8 grams of fiber per 100 milliliters, a nutrient not found in dairy milk, supporting their appeal for digestive health. High-protein options, such as Alpro's Protéiné range with 7.5 grams of protein per 100 grams, are designed for active consumers and directly compete with Greek yogurt and skyr formats. In July 2024, The Coconut Collaborative introduced a protein yogurt containing 10 grams of protein per 170-gram serving, targeting menopause support and functional nutrition. Manufacturers focusing on improving mouthfeel and sensory profiles are well-positioned to attract health-conscious consumers transitioning from dairy. The medium-term impact window reflects the time needed for product reformulation and consumer re-trial.
Organic certification demand in premium segments
The European Union (EU) Organic Regulations 834/2007 and 2018/848 mandate that at least 95% of ingredients must be organic for certification. These regulations also strictly define permitted additives and processing aids, creating a quality standard that allows certified products to command price premiums of approximately 35% over conventional plant-based yogurts in Germany. In June 2024, Ecotone introduced a premium organic oat milk range in the United Kingdom (UK), including an Oat and Protein Milk containing 25 grams of protein per liter. This product targets health-conscious consumers willing to pay a premium. Additionally, Alpro sources 100% deforestation-free soy and uses 100% renewable electricity across its four European production sites, aligning with sustainability criteria valued by organic-certified product buyers. In 2025, Germany cultivated 43,300 hectares of soybeans, producing 130,800 tonnes, tripling the production level of 2016. This increase has improved the availability of local organic feedstock and reduced dependence on imports. Certification bodies such as Ecocert and the Soil Association enforce traceability and audit requirements, which add operational complexity but help differentiate products in premium retail channels. The long-term impact of these developments reflects the multi-year investment cycles required for organic supply chain development and consumer education.
Restraints Impact Analysis*
| Restraint | (~) % Impact on CAGR Forecast | Geographic Relevance | Impact Timeline |
|---|---|---|---|
| Shelf-life and stability challenges | -1.1% | Pan-European, acute in Southern Europe warm climates | Medium term (2-4 years) |
| Strict regulations on health claims | -0.9% | EU-wide under European Food Safety Authority jurisdiction | Long term (≥4 years) |
| Lack of awareness about non-dairy benefits | -0.7% | Central and Eastern Europe, rural areas | Medium term (2-4 years) |
| Need for specialized processing equipment | -0.5% | New market entrants, small-scale producers | Long term (≥4 years) |
| Source: Mordor Intelligence | |||
Shelf-life and stability challenges
Plant-based yogurts generally have a refrigerated shelf life of 21 to 28 days, compared to 35 to 42 days for conventional dairy yogurt. This shorter shelf life is due to lower acidity, the absence of preservative dairy cultures, and higher water activity, which accelerates microbial growth. As a result, the reduced shelf life limits supply chain flexibility, increases retail waste, and restricts distribution to convenience stores and smaller independent retailers with less frequent deliveries. According to Roland Berger's 2024 plant-based dairy study, taste and texture remain significant barriers for most European consumers, with stability issues leading to off-flavors and syneresis (the separation of liquid from a gel) during storage. While methods such as high-pressure processing, natural preservatives like nisin, and modified atmosphere packaging can extend shelf life, these solutions increase production costs by 15% to 25%, impacting margins in this price-sensitive market. In the medium term, ongoing research and development efforts are focused on improving fermentation strains, stabilizer systems, and packaging innovations to enhance shelf life while aligning with clean-label consumer preferences.
Strict regulations on health claims
The European Food Safety Authority (EFSA) evaluates health claims under Regulation 1924/2006, with a rejection rate exceeding 80% for probiotic claims outside of lactose digestion. This poses challenges for manufacturers aiming to differentiate plant-based yogurts based on gut health or immune function. To secure approval, claims must be backed by rigorous clinical evidence, bioavailability studies, and a nine-month assessment period, which can be particularly demanding for smaller brands with limited regulatory budgets. Danone S.A. utilizes its Activia probiotic platform and regulatory expertise across both dairy and plant-based portfolios. However, most plant-based specialists face difficulties in proving probiotic survival and efficacy in non-dairy matrices. While compliance with International Organization for Standardization (ISO) 22000 food safety standards and EFSA fortification guidelines for vitamins and minerals is feasible, achieving functional claims beyond basic nutrition requires significant long-term investment in clinical trials and regulatory processes [2]Source: IPA Europe, “A Holistic Approach to Probiotics in the EU for Informed Consumers and a Sustainable Food Industry” ipaeurope.org.
*Our forecasts treat driver/restraint impacts as directional, not additive. The impact forecasts reflect baseline growth, mix effects, and variable interactions.
Segment Analysis
By Type: Oat Yogurt Gains Ground as Soy Retains Dominance
Soy yogurt accounted for 37.21% of the market share in 2025, supported by established supply chains, a complete amino acid profile providing 4 grams of protein per 100 grams, and fortification with calcium, vitamins D2, and B12, aligning with dairy nutritional standards. Oat yogurt is projected to grow at a compound annual growth rate (CAGR) of 12.43% through 2031, marking the fastest growth among all types. This growth is driven by consumer preference for its creamy texture, neutral flavor, and fiber content of 0.8 grams per 100 milliliters, which dairy products lack. Danone S.A. invested GBP 41 million in its Kettering, United Kingdom facility to produce 58 million liters annually of oat-based products using 100% British oats, reflecting confidence in the long-term potential of oat-based products.
Almond yogurt faces challenges due to rising raw material costs and concerns over water usage. Mediterranean-sourced almonds require eight times less irrigation water compared to United States-grown almonds but still command premium pricing. Coconut-based yogurts remain a niche product with indulgent positioning. For example, The Coconut Collaborative launched a protein yogurt targeting functional nutrition and menopause support, priced at a premium for 350 grams.


By Category: Drinkable Formats Capture On-the-Go Occasions
Spoonable yogurt accounted for 49.43% of the market share in 2025, reflecting its alignment with traditional consumption habits, particularly at breakfast and as a snack. However, drinkable yogurt is experiencing a higher growth rate, with a compound annual growth rate (CAGR) of 12.12% projected through 2031. This growth is driven by the increasing popularity of ready-to-drink protein shakes and smoothie-style products, which cater to commuting and post-workout consumption occasions. In July 2024, The Coconut Collaborative introduced a Yog and Granola on-the-go format at WHSmith travel retail locations, targeting travelers and commuters with a convenient single-serve option. Similarly, Alpro's Protéiné drinkable yogurt alternative offers 7.5% protein per 100 grams in a 200-gram ready-to-drink format, designed for breakfast or on-the-go consumption.
Drinkable yogurt formats benefit from shelf-stable aseptic packaging, which extends their distribution beyond refrigerated aisles. However, refrigerated drinkable yogurts command premium pricing due to their perceived freshness. Spoonable yogurts continue to dominate household consumption. In the United Kingdom, 33% of premium yogurt occasions occur at breakfast, while 28% take place during evening meals. This supports the popularity of multi-serve pack formats, such as 500-gram containers and 4x125-gram packs.
By Flavor: Flavored Variants Lead as Unflavored Serves Culinary Uses
Flavored non-dairy yogurts accounted for 46.83% of the market share in 2025 and are projected to grow at a compound annual growth rate (CAGR) of 10.90% through 2031. This growth is driven by the inclusion of fruits, dessert-inspired flavors, and seasonal limited editions, which appeal to flexitarian consumers. Alpro offers a variety of flavors, including blueberry, strawberry, mango-peach-passionfruit, coconut salted caramel, and coconut stracciatella, with fruit content typically at 2% by weight to balance flavor impact and cost control. Oatly's discontinued Oatgurt line featured flavors such as vanilla, blueberry, strawberry, and mango-peach-passionfruit, targeting German-speaking markets with profiles familiar to traditional dairy yogurt consumers. Unflavored yogurts cater to culinary applications. For instance, Alpro's natural unsweetened variant is marketed for savory cooking, baking, and as a sour cream substitute, addressing a distinct usage occasion.
According to Synergy Taste's 2025 flavor trends report, consumer preferences are shifting towards retro desserts, bold flavors, and affordable indulgence, presenting opportunities for variants such as tiramisu, lemon meringue, and salted caramel. No-added-sugar flavored yogurts, such as Alpro's sans sucres range with 0 grams of sugar per 100 grams, cater to health-conscious consumers seeking indulgence without impacting glycemic levels.
By Distribution Channel: Off-Trade Dominates as Online Retail Accelerates
Off-trade channels accounted for 63.23% of the market share in 2025 and are projected to grow at a compound annual growth rate (CAGR) of 11.23% through 2031. This growth highlights the increasing penetration of plant-based yogurt into mainstream supermarkets, hypermarkets, and online retail, which collectively represent over 90% of the volume in organized distribution [3]Source: Ministry of Agriculture, Fisheries and Food, “Information on the consumption of milk and dairy products,” mapa.gob.es. Supermarkets and hypermarkets dominate the off-trade segment, with retailers such as Tesco, Sainsbury's, Ocado, Rewe, Edeka, Kaufland, and Carrefour providing national distribution for brands like Alpro, Oatly, and private-label products. Online retail is expanding rapidly, exemplified by The Coconut Collaborative's launch of its protein yogurt at Ocado in July 2024, targeting digitally native consumers who are willing to pay premium prices for functional products.
On-trade channels, including cafés, restaurants, and food service, account for the remaining market share. Alpro's Barista range is specifically designed for coffee shops, while Oatly offers food service portion sizes catering to institutional buyers. Specialist retailers differentiate themselves by offering curated assortments, in-store sampling, and knowledgeable staff, which support premium pricing for organic and functional variants. Compliance with International Organization for Standardization (ISO) 22000 food safety standards and cold-chain integrity requirements is mandatory across all channels. Online retail, in particular, faces additional scrutiny to ensure last-mile temperature control.
Geography Analysis
The United Kingdom held a significant 21.43% share of the European non-dairy yogurt market in 2025. This was supported by strong penetration of plant-based products, a well-established retail distribution network, and consumer openness to dairy alternatives. Although the value of the UK plant-based yogurt market declined by 7% between 2020 and 2022 due to pandemic-related challenges, weekly sales volume rose by 3% in the first half of 2024 compared to 2022. This recovery was driven by new product launches and expanded distribution. Danone S.A.'s investment of GBP 41 million in its Kettering facility to produce 58 million liters annually of oat-based products using 100% British oats highlights its long-term commitment to the UK market. Additionally, premium yogurt value increased by 34.2%, and volume grew by 28.2% in the 12 weeks ending October 2025, with penetration reaching 29.9% as consumers opted for high-protein and functional formats.
Spain is expected to be the fastest-growing segment, with a compound annual growth rate (CAGR) of 11.29% through 2031. This growth is attributed to younger demographics, reduced value-added tax (VAT) on yogurt products, and strategic repositioning by manufacturers such as Danone S.A., Lactalis Nestlé, and regional players. The Netherlands has set a target to achieve a 50% shift from animal to plant protein consumption by 2030. This goal is supported by government initiatives, including Food Valley innovation hubs and advancements in precision fermentation, positioning the country as a leader in plant-based research and development.
Other markets such as Poland, Belgium, Sweden, and Italy are also showing notable trends. In Poland, plant-based yogurt familiarity stands at 47%, with 32% of consumers planning to increase consumption. However, discounters dominate the market, with a 58% likelihood of purchase, limiting the penetration of premium brands. Belgium benefits from Danone S.A.'s Wevelgem production site, while Sweden leverages Oatly's Scandinavian heritage and continued Oatgurt distribution. Regulatory harmonization under European Union (EU) Organic Regulations 834/2007 and 2018/848 has facilitated cross-border trade. However, national preferences for soy in Germany, oat in the United Kingdom, and almond in France require localized product portfolios. Eastern European markets, including Poland, remain underpenetrated, presenting opportunities for value-oriented brands willing to invest in consumer education and retail partnerships.
Competitive Landscape
The Europe non-dairy yogurt market is moderately fragmented, with established dairy multinationals leveraging their manufacturing scale and retail networks, while specialist plant-based brands focus on innovation and sustainability. Danone S.A. holds a significant market share through its Alpro brand, which operates four European production sites powered entirely by renewable electricity and offers 34 Stock Keeping Units (SKUs) across soy, oat, almond, and coconut bases. The company invested EUR 43 million to convert its Villecomtal facility from dairy to plant-based oat drink production, with 90% of the output exported across Europe, highlighting its strategic focus on plant-based capacity.
Oatly Group AB dominates the German oat drinks market; however, its planned exit from the German, Austrian, and Swiss yogurt markets in February 2025 demonstrates that success in beverages does not necessarily translate to yogurt. Competitive strategies in the market emphasize fortification, flavor innovation, and sustainability. Alpro fortifies its yogurt alternatives with calcium, vitamins D2, B12, and B2 to align with dairy nutritional profiles, catering to lactose-intolerant and health-conscious consumers. The Coconut Collaborative differentiates itself with functional products, such as a protein yogurt launched in July 2024, offering 10 grams of protein per 170-gram serving to support menopause health. Ecotone's B-Corp certified Kallø brand targets premium organic channels with oat and protein milk, leveraging its sustainability credentials.
Opportunities for growth exist in protein-fortified drinkable formats, organic-certified oat yogurts, and Eastern European markets with low penetration. Emerging disruptors include precision fermentation startups developing dairy-identical proteins without animal agriculture, though commercialization of these innovations is not expected before 2031.
Europe Non-dairy Yogurt Industry Leaders
Danone S.A.
Oatly Group AB
The Hain Celestial Group Inc.
Valsoia SpA
Blue Diamond Growers
- *Disclaimer: Major Players sorted in no particular order

Recent Industry Developments
- December 2025: Valsoia S.p.A. acquired 70 percent of Slovenian kefir producer Kele and Kele for an enterprise value of EUR 5.4 million, marking the Italian plant-based specialist's entry into the European kefir market and expansion into functional fermented foods adjacent to yogurt alternatives
- October 2024: Valio Ltd spinoff Oddlygood acquired United Kingdom plant-based milk brand Rude Health, expanding Valio's plant-based footprint in the United Kingdom market and adding complementary oat and almond drink portfolios to Oddlygood's existing range
- July 2024: The Coconut Collaborative introduced Protein Yog at Tesco and Ocado, offering 10 grams of protein per 170-gram serving. The product is positioned to support menopause through functional nutrition, following a four-year development process.


Europe Non-dairy Yogurt Market Report Scope
Non-dairy yogurt refers to fermented plant-based yogurt alternatives made from sources such as soy, almond, coconut, oat, or cashew milk. These products replicate the texture, tanginess, and nutritional profile of traditional dairy yogurt without utilizing animal-derived milk. The non-dairy yogurt market is segmented as follows: By Type, it includes Soy Yogurt, Almond Yogurt, Oat Yogurt, and Others. By Category, it is divided into Drinkable Yogurt and Spoonable Yogurt. By Flavor, it is categorized as Flavored and Unflavored. By Distribution Channel, it is segmented into On-trade and Off-trade, where the Off-trade channel is further divided into Convenience Stores, Specialist Retailers, Supermarkets and Hypermarkets, Online Retail, and Others. By Geography, the market covers Germany, United Kingdom, Italy, France, Spain, Netherlands, Poland, Belgium, Sweden, and the Rest of Europe.
| Soy Yogurt |
| Almond Yogurt |
| Oat Yogurt |
| Others |
| Drinkable Yogurt |
| Spoonable Yogurt |
| Flavored |
| Un-Flavored |
| On-trade | |
| Off-trade | Convenience Stores |
| Specialist Retailers | |
| Supermarkets and Hypermarkets | |
| Online Retail | |
| Others |
| Germany |
| United Kingdom |
| Italy |
| France |
| Spain |
| Netherlands |
| Poland |
| Belgium |
| Sweden |
| Rest of Europe |
| By Type | Soy Yogurt | |
| Almond Yogurt | ||
| Oat Yogurt | ||
| Others | ||
| By Category | Drinkable Yogurt | |
| Spoonable Yogurt | ||
| By Flavor | Flavored | |
| Un-Flavored | ||
| By Distribution Channel | On-trade | |
| Off-trade | Convenience Stores | |
| Specialist Retailers | ||
| Supermarkets and Hypermarkets | ||
| Online Retail | ||
| Others | ||
| By Geography | Germany | |
| United Kingdom | ||
| Italy | ||
| France | ||
| Spain | ||
| Netherlands | ||
| Poland | ||
| Belgium | ||
| Sweden | ||
| Rest of Europe | ||


Market Definition
- Dairy Alternatives - Dairy alternatives are foods that are made from plant-based milk/oils instead of their usual animal products, such as cheese, butter, milk, ice cream, yogurt, etc. Plant-based or non-dairy milk alternative is the fast-growing segment in the newer food product development category of functional and specialty beverage across the globe.
- Non-Dairy Butter - Non dairy butter is a vegan butter alternative that is made from a mixture of plant oils. With an increase in alternative diets like vegetarianism, veganism, and gluten intolerance, plant butter is a healthy non-dairy substitute for normal butter.
- Non-Dairy Ice Cream - Plant based ice cream is a growing category. Non-dairy ice cream is a type of dessert made without any animal ingredients. This is typically considered a substitute for regular ice cream for those who cannot or do not eat animal or animal-derived products, including eggs, milk, cream, or honey.
- Plant-Based Milk - Plant based milks are milk substitutes that are made from nuts (e.g., hazelnuts, hemp seeds), seeds (e.g., sesame, walnuts, coconuts, cashews, almonds, rice, oats, etc.) or legumes (e.g., soy). Plant-based milk such as soy milk and almond milk have been popular in East Asia and the Middle East for centuries.
| Keyword | Definition |
|---|---|
| Cultured Butter | Cultured butter is prepared by having the raw butter go through chemical processing and has been added with certain emulsifiers and foreign ingredients. |
| Uncultured Butter | This type of butter is one which has not been processed in any way |
| Natural Cheese | The type of cheese in its most natural form. It is made from natural and simple products and ingredients, including fresh and natural salts, natural colors, enzymes, and high-quality milk. |
| Processed Cheese | Processed cheese undergoes the same processes as natural cheese; however, it requires more steps and many different forms of ingredients. Making processed cheese involves melting natural cheese, emulsifying it, and adding preservatives and other artificial ingredients or colorings. |
| Single Cream | Single cream contains around 18% fat. It’s a single layer of cream that appears over boiled milk. |
| Double Cream | Double cream contains 48% fat, more than double the amount of fat of single cream. It’s heavier and thicker than single cream |
| Whipping Cream | This has a much higher fat percentage than single cream (36%). Used to top cakes, pies, and puddings and as a thickener for sauces, soups, and fillings. |
| Frozen Desserts | Desserts that are meant to be eaten in frozen condition. E.g., sherbets, sorbets, frozen yogurts |
| UHT Milk (Ultra-high temperature milk) | Milk heated at a very high temperature. Ultra-high-temperature processing (UHT) of milk involves heating for 1–8 sec at 135–154°C. which kills the spore-forming pathogenic microorganism, resulting in a product with a shelf-life of several months. |
| Non-dairy butter/Plant-based butter | Butter made from plant-derived oil such as coconut, palm, etc. |
| Non-dairy Yogurt | Yogurt made from typically made from nuts, like almonds, cashews, coconuts, and even other foods like soybeans, plantains, oats, and peas |
| On-trade | It refers to restaurants, QSRs, and bars. |
| Off-trade | It refers to supermarkets, hypermarkets, on-line channels, etc. |
| Neufchatel cheese | One of the oldest kinds of cheese in France. It is a soft, slightly crumbly, mold-ripened, bloomy-rind cheese made in the Neufchâtel-en-Bray region of Normandy. |
| Flexitarian | It refers to a consumer preferring a semi-vegetarian diet, that is centered on plant foods with limited or occasional inclusion of meat. |
| Lactose Intolerance | Lactose intolerance is a reaction in digestive system to lactose, the sugar in milk. It causes uncomfortable symptoms in response to the consumption of dairy products. |
| Cream Cheese | Cream cheese is a soft and creamy fresh cheese with a tangy taste made from milk and cream. |
| Sorbets | Sorbet is a frozen dessert made using ice combined with fruit juice, fruit purée, or other ingredients, such as wine, liqueur, or honey. |
| Sherbet | Sherbet is a sweetened frozen dessert made with fruit and some sort of dairy product such as milk or cream. |
| Shelf stable | Foods that can be safely stored at room temperature, or "on the shelf," for at least one year and do not have to be cooked or refrigerated to eat safely. |
| DSD | Direct Store Delivery is the process in supply chain management wherein the product is delivered from manufacturing plant directly to the retailer. |
| OU Kosher | Orthodox Union Kosher is a kosher certification agency based in New York City. |
| Gelato | Gelato is a frozen creamy dessert made with milk, heavy cream and sugar. |
| Grass-fed Cows | Grass-fed cows are allowed to graze in pastures, where they eat a variety of grasses and clover. |


Research Methodology
Mordor Intelligence follows a four-step methodology in all our reports.
- Step-1: Identify Key Variables: In order to build a robust forecasting methodology, the variables and factors identified in Step 1 are tested against available historical market numbers. Through an iterative process, the variables required for market forecast are set, and the model is built on the basis of these variables.
- Step-2: Build a Market Model: Market-size estimations for the forecast years are in nominal terms. Inflation is not a part of the pricing, and the average selling price (ASP) is kept constant throughout the forecast period for each country.
- Step-3: Validate and Finalize: In this important step, all market numbers, variables, and analyst calls are validated through an extensive network of primary research experts from the market studied. The respondents are selected across levels and functions to generate a holistic picture of the market studied.
- Step-4: Research Outputs: Syndicated Reports, Custom Consulting Assignments, Databases & Subscription Platforms


