North America Non-dairy Yogurt Market Size and Share
Market Overview
| Study Period | 2021 - 2031 |
|---|---|
| Forecast Data Period | 2026 - 2031 |
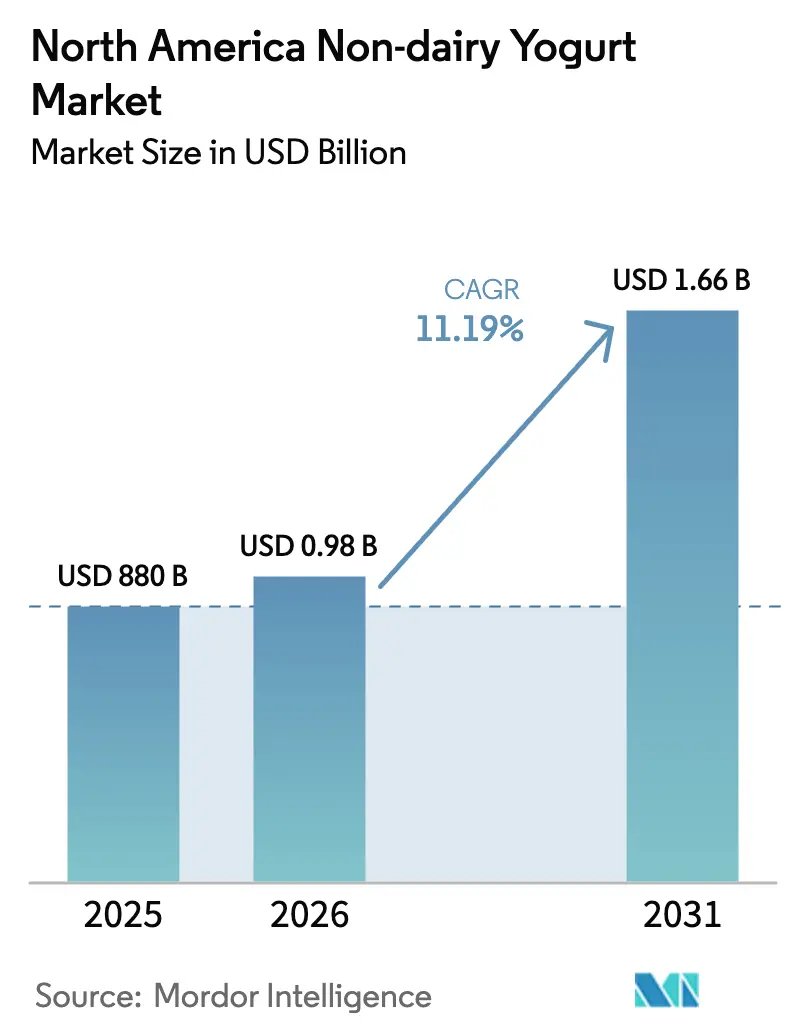
| Base Year Market Size (2025) | USD 880 Billion |
| Market Size (2026) | USD 0.98 Billion |
| Market Size (2031) | USD 1.66 Billion |
| Growth Rate (2026 - 2031) | 11.19% CAGR |
| Market Concentration | Medium |
Major Players
*Disclaimer: Major Players sorted in no particular order Image © Mordor Intelligence. Reuse requires attribution under CC BY 4.0. |
|
North America Non-dairy Yogurt Market Analysis by Mordor Intelligence
The North America non-dairy yogurt market size is expected to grow from USD 880 million in 2025 to USD 978.47 million in 2026 and is forecast to reach USD 1.66 billion by 2031 at 11.19% CAGR over 2026-2031. This trajectory reflects structural shifts in consumer protein sourcing, driven by lactose malabsorption affecting 68% of the global population and concentrated among Asian American (90%), African American (75%), and Hispanic/Latino (50-80%) demographics in the United States [1]Source: National Library of Medicine, "Lactose Intolerance", ncbi.nlm.nih.gov. Regulatory clarity is emerging as the FDA released draft guidance in January 2025 recommending that plant-based yogurt alternatives clearly identify their plant source on principal display panels, while maintaining that only dairy-derived products meeting 21 CFR 131.200 can use the unqualified term "yogurt" [2]Source: U.S Food and Drug Administration," Draft Guidance", fda.gov. Oat-based formulations are gaining popularity because beta-glucan provides natural viscosity, cutting hydrocolloid use and supporting clean-label claims. Drinkable lines appeal to convenience-driven shoppers and align with the broader protein-beverage trend, while flavored variants leverage natural flavor systems to mask grainy or beany notes. Distribution remains supermarket-centric, yet foodservice demand is recovering as cafés and quick-service chains add dairy-free menu items. Margin management hinges on hedging almond and oat input costs, securing flexible co-packing contracts, and advancing texture technologies that narrow the sensory gap with dairy.
Key Report Takeaways
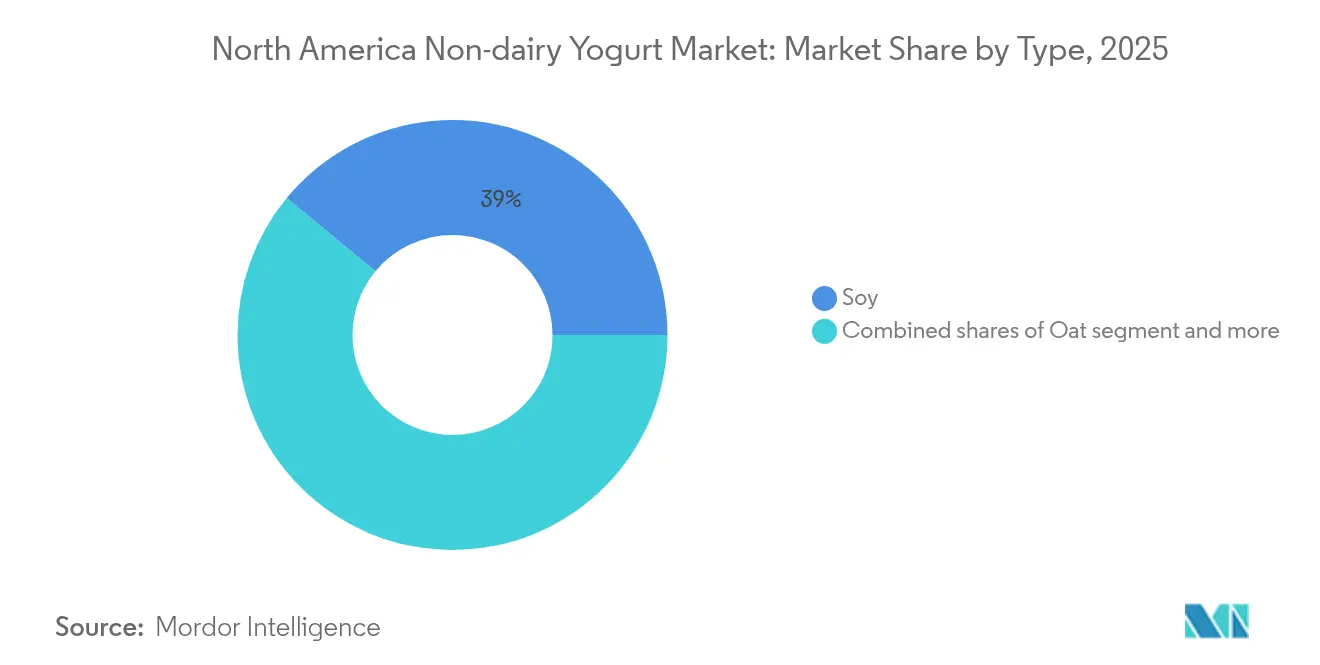
- By type, soy retained 39.01% of the non-dairy yogurt market share in 2025, whereas oat yogurt is set to expand at an 11.54% CAGR to 2031.
- By category, spoonable products led with 47.52% revenue share in 2025; drinkable formats are forecast to grow at a 12.18% CAGR through 2031.
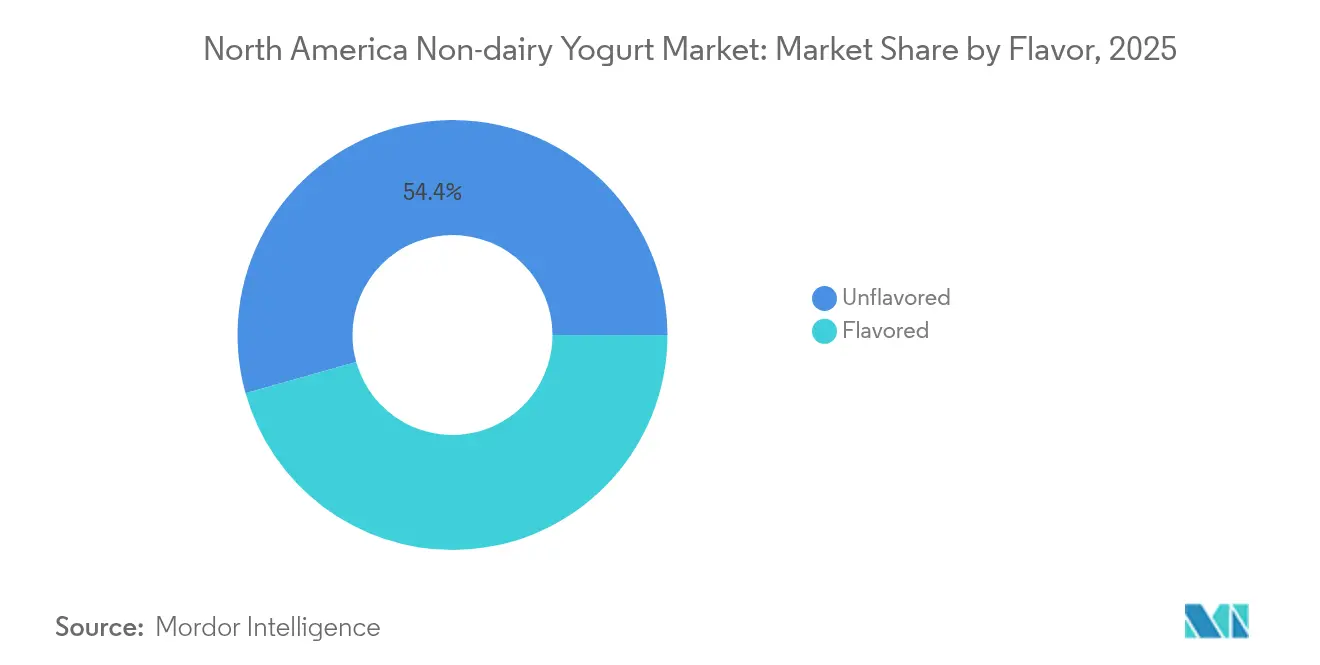
- By flavour, flavored variants captured 45.63% share in 2025 and are poised to advance at a 13.06% CAGR to 2031.
- By distribution channel, supermarkets and hypermarkets held 81.74% share in 2025, while on-trade channels are rebounding at a 11.92% CAGR to 2031.
- By geography, the United States accounted for 91.47% of 2025 sales; Canada represents the fastest-growing territory with a 12.31% CAGR through 2031.
Note: Market size and forecast figures in this report are generated using Mordor Intelligence’s proprietary estimation framework, updated with the latest available data and insights as of 2026.
North America Non-dairy Yogurt Market Trends and Insights
Drivers Impact Analysis*
| Driver | (~) % Impact on CAGR Forecast | Geographic Relevance | Impact Timeline |
|---|---|---|---|
| Growing lactose intolerance and dairy allergies | +2.3% | North America, with the highest impact in the US (United States) urban centers and Canadian metropolitan areas | Medium term (2-4 years) |
| Rising adoption of plant-based/flexitarian diets | +2.1% | United States and Canada, particularly among Gen Z and Millennial demographics | Long term (≥ 4 years) |
| Increasing health consciousness and probiotic appeal | +1.8% | United States, Canada, with spillover to the Rest of North America | Medium term (2-4 years) |
| Innovation in plant-based textures | +1.6% | United States (innovation hubs: California, New York), Canada (Ontario, British Columbia) | Short term (≤ 2 years) |
| Rising animal-welfare concerns are influencing purchase decisions | +1.4% | United States West Coast and Northeast, Canadian urban markets | Long term (≥ 4 years) |
| Broad retail and online availability of non-dairy yogurts | +1.2% | North America, with accelerated penetration in e-commerce channels | Short term (≤ 2 years) |
| Source: Mordor Intelligence | |||
Growing Lactose Intolerance and Dairy Allergies
Lactose malabsorption affects approximately 68% of the global population, with prevalence concentrated among ethnic groups that dominate North American demographic shifts. Self-reported lactose intolerance in the United States has risen as awareness campaigns by gastroenterology associations and primary-care networks normalize testing, creating a medically validated consumer base that views non-dairy yogurt as a functional necessity rather than a lifestyle choice. Dairy allergies, distinct from intolerance, affect 2-3% of children under 3 years and persist into adulthood in roughly 20% of cases, driving demand for allergen-free alternatives that meet the FDA's Food Allergen Labeling and Consumer Protection Act requirements. The FDA's March 2024 qualified health claim linking yogurt consumption to reduced type 2 diabetes risk, while limited to dairy products meeting 21 CFR 131.200, has paradoxically elevated the category's health halo, prompting plant-based manufacturers to pursue clinical trials demonstrating comparable glycemic benefits from fortified formulations, according to the FDA Qualified Health Claim March 2024. This demographic-medical nexus positions lactose intolerance not as a niche constraint but as a structural growth pillar, particularly as Hispanic/Latino populations are projected to comprise 28% of the US population by 2030 [3].Source: US Census Bureau, U.S. Population Projected to Begin Declining in Second Half of Century", census.gov
Rising Adoption of Plant-Based/Flexitarian Diets
Flexitarian consumers, those reducing but not eliminating animal products, represent a larger addressable market than vegans (6% of US consumers) or vegetarians (5%), as they prioritize occasional substitution over categorical exclusion according to the Plant Based Foods Association 2024. This cohort's purchasing behavior is episodic rather than habitual, creating volatility in repeat rates but expanding trial incidence across demographics previously resistant to plant-based claims. Younger consumers, particularly Gen Z (born 1997-2012) and Millennials (born 1981-1996), exhibit a higher willingness to pay premiums for plant-based yogurt when positioned around sustainability metrics such as water usage (almond yogurt requires 371 liters per kilogram versus 1,050 liters for dairy yogurt) or greenhouse gas emissions. The flexitarian segment's expansion hinges on taste parity and price convergence; as long as plant-based yogurt commands premium over dairy equivalents, adoption will remain confined to higher-income households and coastal urban markets rather than achieving mass-market penetration in the Midwest and Southern regions where dairy remains culturally entrenched.
Increasing Health Consciousness and Probiotic Appeal
Probiotic strains traditionally associated with dairy yogurt, Lactobacillus acidophilus, Bifidobacterium animalis subsp. Lactis, Streptococcus thermophilus, have been successfully adapted to plant-based matrices, though survival rates and metabolic activity vary by substrate pH, fermentation time, and storage conditions according to the Journal of Dairy Science 2024. Califia Farms' January 2025 launch of yogurt drinks containing BB-12 (Bifidobacterium animalis subsp. lactis) at 1 billion CFU per serving represents a strategic bet that consumers will equate probiotic counts with efficacy, despite limited clinical evidence that plant-based delivery systems confer identical gut microbiome benefits as dairy, according to the Califia Farms Press Release January 2025. This regulatory ambiguity allows brands to differentiate through strain selection, CFU counts, and shelf-life guarantees, but also invites scrutiny from the Federal Trade Commission if marketing implies therapeutic benefits without substantiation. Emerging research on postbiotics, metabolites produced by probiotic fermentation, suggests that plant-based yogurts rich in short-chain fatty acids (butyrate, propionate) may deliver anti-inflammatory benefits independent of live cultures, opening a secondary positioning avenue for brands constrained by cold-chain logistics.
Innovation in Plant-Based Textures
Oat yogurt's ascent to 11.67% forecasted CAGR through 2030 stems from beta-glucan, a soluble fiber that forms viscous gels at concentrations as low as 0.5-1.0%, reducing reliance on added hydrocolloids like pectin, guar gum, or locust bean gum that contribute to "slimy" mouthfeel according to the Food Hydrocolloids Journal 2024. Enzymatic treatments, particularly amylase and protease applications, break down starches and proteins into smaller molecules that improve water-binding capacity and reduce grittiness, a persistent complaint in almond-based formulations, where insoluble fiber creates textural heterogeneity according to the Journal of Food Engineering 2024. High-pressure processing (HPP), operating at 400-600 MPa, extends shelf life to 60-90 days without thermal degradation of heat-sensitive nutrients or probiotics, though capital costs of USD 1-2 million per unit limit adoption to larger manufacturers like Danone and Chobani, according to the HPP Equipment Manufacturers Association. Patent filings in 2024-2025 reveal a focus on protein fortification strategies that blend pea, faba bean, and rice proteins to achieve 10-15 grams per serving, matching Greek yogurt benchmarks, while minimizing beany off-flavors through encapsulation or flavor-masking compounds, USPTO Patent Database. Forager Project's May 2025 launch of Greek-style cashew yogurt with 10 grams of protein per serving exemplifies this convergence of texture and nutrition, targeting consumers who view yogurt as a post-workout recovery vehicle rather than a breakfast staple.
Restraints Impact Analysis*
| Restraint | (~) % Impact on CAGR Forecast | Geographic Relevance | Impact Timeline |
|---|---|---|---|
| High cost of plant-based raw materials | -1.8% | United States (California almond belt, Midwest oat regions), Canada (Prairie provinces) | Medium term (2-4 years) |
| Poor taste or mouthfeel compared to dairy yogurt | -1.5% | North America, particularly among first-time trialists and older demographics | Short term (≤ 2 years) |
| Supply chain challenges in sourcing nuts/plant bases | -1.2% | United States (drought-prone California), Canada (weather-dependent oat harvests) | Medium term (2-4 years) |
| Labeling and regulatory challenges around "non-dairy" claims | -0.9% | United States (FDA jurisdiction), Canada (Health Canada oversight) | Long term (≥ 4 years) |
| Source: Mordor Intelligence | |||
High Cost of Plant-Based Raw Materials
California almond prices averaged USD 2.80-3.20 per pound in 2024, up from USD 2.40-2.60 in 2023, as drought conditions reduced yields by an estimated 8-12% and water allocations from the Central Valley Project faced further curtailments, according to the USDA NASS California Almond Report 2024. Food-grade oats, essential for yogurt production, commanded a premium over feed-grade oats in 2024 as competing demand from the oat milk sector, which grew year-over-year, tightened North American supply, particularly from Canadian Prairie provinces (Saskatchewan, Manitoba, Alberta) that account for 80% of the continent's oat production according to the Statistics Canada Crop Report 2024. Soybean prices, while more stable due to diversified global sourcing, exhibited volatility in 2024-2025 as biodiesel mandates under the Renewable Fuel Standard diverted 40% of US soy production toward energy applications, creating upward pressure on food-grade soy prices according to the USDA Economic Research Service. Vertical integration strategies, such as securing long-term contracts with almond growers or investing in oat-processing facilities, remain capital-intensive and expose manufacturers to agricultural risk, explaining why most players rely on commodity markets and third-party suppliers despite price volatility.
Poor Taste or Mouthfeel Compared to Dairy Yogurt
Sensory evaluation studies consistently identify creaminess, tartness balance, and absence of off-flavors as attributes where plant-based yogurt underperforms dairy benchmarks, with consumer acceptance scores increasing for dairy in blind tastings. Beany notes in soy yogurt, chalky mouthfeel in almond yogurt, and fermented grain flavors in oat yogurt stem from lipid oxidation, protein denaturation, and residual enzyme activity that are difficult to mask without compromising clean-label positioning. Natural flavoring systems, vanilla, fruit purees, cocoa can obscure base-note defects but add 10-15% to formulation costs, narrowing the margin gap versus dairy and limiting applicability in unflavored SKUs that appeal to purist consumers. Protein fortification, while addressing nutritional parity, introduces additional textural challenges; pea protein isolate, the most common fortifier, imparts astringency and grittiness at concentrations above 8-10 grams per serving unless treated with cyclodextrins or other encapsulation technologies that add USD 0.15-0.25 per unit. Reformulation cycles, typically 12-18 months from bench-scale to commercial launch, lag consumer feedback loops, meaning that taste complaints identified in 2024 may not be addressed in market until late 2025 or 2026, creating a persistent perception gap that benefits dairy incumbents.
*Our forecasts treat driver/restraint impacts as directional, not additive. The impact forecasts reflect baseline growth, mix effects, and variable interactions.
Segment Analysis
By Type: Oat Gains on Soy's Nutritional Legacy
Soy yogurt held 39.01% market share in 2025, reflecting its first-mover advantage and complete amino acid profile that matches dairy's protein quality, yet oat yogurt is expanding at 11.54% CAGR through 2031 as beta-glucan's natural thickening properties eliminate the need for stabilizers that consumers associate with over-processing. Almond yogurt occupies a premium niche, commanding retail prices above soy and oat equivalents, but struggles with protein content (typically 2-4 grams per serving versus 6-8 grams for soy) and water-footprint criticism that undermines sustainability positioning. The "Others" category, encompassing coconut, cashew, pea protein, and emerging bases like pili nut (Lavva) and flaxmilk (Good Karma), captures innovation-driven trial but lacks the supply-chain scale to achieve cost parity, confining these SKUs to natural-channel retailers and direct-to-consumer models. Chobani's 2024 expansion into oat-based yogurt, leveraging its existing cold-chain infrastructure and retailer relationships, signals that mainstream players view oat as the category's growth engine, potentially displacing soy's dominance by 2028-2029 if current trajectories hold. Regulatory dynamics favor soy in the near term, as its established GRAS (Generally Recognized as Safe) status and decades of safety data reduce reformulation risk, whereas novel ingredients like pili nut or lupin require more extensive FDA review under the Food Safety Modernization Act's preventive controls framework.
Protein fortification is converging across all bases, with brands blending pea, rice, and faba bean proteins to reach 10-15 grams per serving, matching Greek yogurt, without triggering off-flavor complaints that plague single-source fortification. Oats' carbohydrate content (18-22 grams per serving) positions it as a pre-workout energy source rather than a low-carb snack, differentiating its use case from almond and coconut bases that appeal to ketogenic and paleo dieters. Soy yogurt's phytoestrogen content, isoflavones at 20-30 milligrams per serving, remains a double-edged sword, attracting consumers seeking menopause symptom relief while deterring others concerned about hormonal effects, despite clinical evidence showing no adverse impact at typical consumption levels according to the NIH Office of Dietary Supplements. The interplay between base ingredient, protein content, and carbohydrate profile suggests that segmentation by type will fragment further as personalized nutrition trends drive demand for yogurts tailored to specific dietary patterns (high-protein, low-carb, high-fiber) rather than monolithic plant-based positioning.


By Category: Drinkable Formats Capture On-the-Go Demand
Spoonable yogurt held 47.52% market share in 2025, anchored by breakfast and snacking occasions where bowl-based consumption aligns with granola, fruit, and nut toppings, yet drinkable yogurt is accelerating at 12.18% CAGR through 2031 as single-serve bottles (8-12 ounces) penetrate convenience stores, gyms, and workplace micro-markets. Drinkable formats also enable shelf-stable formulations through ultra-high temperature (UHT) processing, eliminating refrigeration requirements and expanding distribution to non-refrigerated sets in convenience stores and vending machines, a channel where spoonable yogurt cannot compete [UHT processing extends shelf life to 6-9 months unrefrigerated]. Maison Riviera's February 2025 launch of upcycled drinkable oat yogurt in Canada, made from surplus oat milk production, illustrates how drinkable formats accommodate sustainability narratives by repurposing byproducts that would otherwise be discarded.
Spoonable yogurt's resilience stems from its meal-replacement positioning, with brands emphasizing 15-20 grams of protein per serving (via fortification) and portion sizes of 150-170 grams that deliver satiety comparable to Greek yogurt. Texture expectations differ sharply between categories; drinkable consumers tolerate thinner viscosity and prioritize flavor intensity, whereas spoonable consumers demand creaminess and mouthfeel that mimic dairy, creating distinct formulation challenges. Foodservice adoption favors drinkable formats, as cafés and quick-service restaurants can integrate them into smoothies, coffee drinks, and grab-and-go coolers without requiring bowls or spoons, reducing operational complexity. The category split will likely widen as drinkable formats pursue functional beverage positioning (energy, immunity, gut health) while spoonable formats defend traditional yogurt occasions (breakfast, dessert, cooking ingredient), creating parallel growth trajectories with minimal cannibalization.
By Flavour: Masking Strategies Drive Flavored Growth
Flavored non-dairy yogurt commanded 45.63% market share in 2025 and is expanding at 13.06% CAGR through 2031, outpacing unflavored variants as manufacturers deploy natural flavoring systems, vanilla, strawberry, blueberry, mango, cocoa to mask beany, chalky, or fermented grain notes inherent in plant substrates. Vanilla remains the dominant flavor, as its aromatic compounds (vanillin, ethylvanillin) effectively suppress off-notes while maintaining clean-label appeal when sourced from Madagascar or Tahitian beans. Fruit-forward flavors leverage purees and concentrates to deliver sweetness and tartness that balance plant-based yogurt's neutral or slightly bitter base, but introduce formulation challenges around pH stability and pectin interactions that can cause syneresis (whey separation) during shelf life. Cocoa and chocolate variants, growing at double-digit rates, appeal to dessert occasions and younger demographics, with brands like Kite Hill and Forager Project positioning them as indulgent yet health-conscious alternatives to pudding or ice cream.
Unflavored yogurt, while slower-growing, retains a loyal base among culinary users who substitute it for sour cream, mayonnaise, or dairy yogurt in recipes, and among purist consumers skeptical of added sugars and natural flavors. The clean-label movement, emphasizing ingredient lists under 10 components, favors unflavored formulations that avoid flavor compounds, sweeteners, and color additives. Sweetener choice bifurcates the flavored segment: organic cane sugar dominates conventional products, while stevia, monk fruit, and allulose capture the low-glycemic and keto-friendly niches, each imparting distinct aftertastes that require flavor-masking optimization. The regulatory landscape around "natural flavor" definitions, governed by 21 CFR101.22, which permits synthetic solvents in extraction if the flavoring substance itself derives from natural sources, creates transparency concerns that smaller brands exploit by listing specific flavor sources (e.g., "vanilla bean extract" versus "natural flavor"). Flavored yogurt's growth trajectory suggests that taste parity with dairy will be achieved through flavor innovation before texture innovation, as masking strategies mature faster than protein and hydrocolloid technologies.
By Distribution Channel: On-Trade Rebounds as Foodservice Recovers
Supermarkets and hypermarkets held 81.74% distribution share in 2025, reflecting the category's maturation into mainstream refrigerated sets where linear footage rivals dairy yogurt in chains like Kroger, Safeway, and Whole Foods Market, yet on-trade channels, restaurants, cafés, and foodservice operators, are expanding at 11.92% CAGR through 2031 as post-pandemic dining recovery and menu diversification drive dairy-free options. Starbucks' 2024 introduction of oat-based yogurt smoothies and Panera Bread's plant-based parfait menu additions signal that national chains view non-dairy yogurt as a margin-accretive upsell rather than a niche accommodation, particularly as most customers now customize orders to exclude dairy. Convenience stores and specialist retailers, while smaller in absolute share, are capturing incremental growth as single-serve drinkable formats achieve shelf-stable formulations that eliminate cold-chain constraints, enabling placement in non-refrigerated sets and vending machines.
Off-trade dominance reflects supermarkets' role as primary discovery channels, where most of plant-based yogurt trials originate from in-store sampling, end-cap displays, and promotional pricing that subsidize trial among dairy-loyal consumers. Specialist retailers, natural-food stores like Sprouts Farmers Market and independent co-ops, serve as incubators for emerging brands (Lavva, Cocojune, GT's Living Foods) that lack the production scale or slotting fees to access mainstream chains, though graduation to supermarket distribution remains the strategic goal for volume growth. Warehouse clubs (Costco, Sam's Club) are emerging as volume drivers for established brands like Chobani and Oatly, offering multi-packs (6-12 units) at 15-20% discounts versus supermarket per-unit pricing, though this channel's bulk-buying model limits SKU variety and favors bestselling flavors (vanilla, strawberry, plain) over niche offerings.
Geography Analysis
The United States accounted for 91.47% of North American non-dairy yogurt revenue in 2025, driven by coastal urban markets (California, New York, Massachusetts) where plant-based penetration exceeds the total yogurt sales and household incomes support the 30-50% price premium over dairy equivalents. California's dual role as the nation's largest almond producer and most populous state creates a vertically integrated ecosystem where ingredient sourcing, manufacturing, and consumption concentrate within a 500-mile radius, reducing logistics costs and enabling rapid product iteration. Regulatory clarity in the United States, particularly the FDA's January 2025 draft guidance on plant-based labeling, provides manufacturers with a framework for compliant marketing claims, though state-level legislative efforts in Wisconsin and Idaho to restrict the term "yogurt" to dairy-only products introduce compliance fragmentation.
Canada is expanding at 12.31% CAGR through 2031, outpacing the United States as provincial plant-based procurement mandates, such as British Columbia's 2024 directive requiring public institutions to source 20% of food from plant-based suppliers, create guaranteed demand channels independent of consumer preference shifts. Health Canada's proactive stance on fortification, permitting voluntary addition of calcium, vitamin D, and vitamin B12 to plant-based yogurt alternatives without pre-market notification (unlike the FDA's requirement for nutrient content claims to meet specific thresholds), reduces reformulation barriers and accelerates time-to-market for fortified SKUs. Earth's Own Food Company, a Canadian player, has leveraged domestic oat sourcing from Prairie provinces to achieve cost advantages versus US competitors reliant on imported bases, though its limited distribution outside Canada constrains revenue scale.
Rest of North America, encompassing Mexico, Central America, and the Caribbean, remains nascent with limited commercial activity, though cross-border trade from US manufacturers (Califia Farms, Ripple Foods) is introducing plant-based yogurt to premium retailers in Mexico City, Monterrey, and Guadalajara. Regulatory frameworks in Mexico, governed by the Secretaría de Salud and COFEPRIS, require Spanish-language labeling and nutritional equivalency documentation for products positioned as dairy alternatives, adding 6-12 months to market-entry timelines versus the US or Canada. The region's growth potential hinges on localized production, leveraging Mexico's tropical fruit supply (mango, papaya, guava) for flavoring and Central America's coconut production for base ingredients, rather than import-dependent models that face tariff and logistics barriers. Climate vulnerability, particularly hurricane exposure in the Caribbean and drought cycles in Central America, introduces supply-chain risk that deters long-term capital investment by multinational manufacturers, explaining why the region remains a low-priority market despite its 180 million population.
Competitive Landscape
The North American non-dairy yogurt market exhibits moderate consolidation, as multinational dairy incumbents (Danone, Groupe Lactalis) compete alongside plant-based specialists (Oatly, Kite Hill, Califia Farms) and emerging disruptors (Lavva, Cocojune, Good Karma) that leverage niche positioning and direct-to-consumer channels to bypass retailer gatekeeping. Danone's dual strategy, divesting legacy dairy brands (Horizon Organic, Wallaby) while investing in its Biotech Open Platform for precision fermentation, signals a long-term bet that next-generation dairy proteins produced via microbial fermentation will converge with plant-based yogurt formulations, creating hybrid products that deliver dairy's sensory attributes without animal inputs.
Oatly's asset-light pivot, exemplified by its closure of the Dallas-Fort Worth facility and sale of the Ogden plant to YYF in 2024, reflects margin pressures from commodity oat prices and promotional intensity, forcing a shift toward third-party co-packing agreements that sacrifice vertical integration for capital efficiency. Opportunities cluster around functional claims, immunity support, gut-brain axis modulation, sports recovery that require clinical substantiation but command price premiums if validated, as evidenced by GT's Living Foods' probiotic-rich coconut yogurt positioned at USD 6-7 per 8-ounce container versus USD 4-5 for conventional plant-based SKUs. Technology deployment centers on fermentation optimization, with brands filing patents for bacterial strains adapted to plant substrates' pH and nutrient profiles, and high-pressure processing (HPP) that extends shelf life to 60-90 days without thermal degradation of probiotics or heat-sensitive vitamins.
Smaller players like Lavva, using pili nuts sourced from Philippine agroforestry systems, and Cocojune, emphasizing single-origin coconut, are carving niches by linking ingredient provenance to regenerative agriculture narratives, a positioning that resonates with environmentally conscious consumers skeptical of commodity supply chains. Regulatory compliance, particularly around probiotic claims and nutrient fortification, will favor larger players with dedicated regulatory affairs teams capable of navigating FDA structure/function claim requirements and state-level labeling laws, creating barriers to entry for undercapitalized startups.
North America Non-dairy Yogurt Industry Leaders
-
Groupe Lactalis
-
The Hain Celestial Group Inc.
-
Yoso Brands
-
Danone S.A.
-
Otsuka Holdings Co., Ltd.
- *Disclaimer: Major Players sorted in no particular order

Recent Industry Developments
- February 2025: Oikos introduced its Oikos PRO range in Canada, featuring yogurt products with 18 to 24 grams of protein per serving, made from 100% Canadian dairy milk and containing no added sugar. The product line addressed the growing demand for nutrient-dense options, supporting muscle building and recovery. Danone Canada highlighted the importance of protein in active lifestyles, while a national marketing campaign aimed to inspire consumers to "Feed Your Strength."
- February 2024: Danone Canada's Silk advanced the plant-based revolution with the launch of its protein plant-based yogurt featuring Canadian pea protein. With 12g of protein per 175 g serving and a signature Greek-style thick texture, the Silk plant-based yogurt was made available in Key Lime and Vanilla flavours, offering exceptional taste, consistency, and nutrition. Silk also introduced an improved recipe, new flavours, and sizes for its existing range of coconut plant-based yogurts.


North America Non-dairy Yogurt Market Report Scope
The North America non-dairy yogurt market is segmented by type, category, distribution channel, and geography. By type, the market is segmented into soy yogurt, almond yogurt, oat yogurt, and more. By category, the market is segmented into drinkable yogurt and spoonable yogurt. By flavor, the market is segmented into flavored and unflavored. By distribution channel, the market is segmented into off-trade and on-trade. By geography, the market is segmented into Canada, the United States, and more. the market forecasts are provided in terms of value (USD) and Volume (Tons).
| Soy Yogurt |
| Almond Yogurt |
| Oat Yogurt |
| Others |
| Drinkable Yogurt |
| Spoonable Yogurt |
| Flavoured |
| Un-flavoured |
| On-trade | |
| Off-trade | Convenience Stores |
| Specialist Retailers | |
| Supermarkets and Hypermarkets | |
| On-line Retail | |
| Others |
| United States |
| Canada |
| Rest of North America |
| Type | Soy Yogurt | |
| Almond Yogurt | ||
| Oat Yogurt | ||
| Others | ||
| Category | Drinkable Yogurt | |
| Spoonable Yogurt | ||
| Flavour | Flavoured | |
| Un-flavoured | ||
| Distribution Channel | On-trade | |
| Off-trade | Convenience Stores | |
| Specialist Retailers | ||
| Supermarkets and Hypermarkets | ||
| On-line Retail | ||
| Others | ||
| By Geography | United States | |
| Canada | ||
| Rest of North America | ||


Market Definition
- Dairy Alternatives - Dairy alternatives are foods that are made from plant-based milk/oils instead of their usual animal products, such as cheese, butter, milk, ice cream, yogurt, etc. Plant-based or non-dairy milk alternative is the fast-growing segment in the newer food product development category of functional and specialty beverage across the globe.
- Non-Dairy Butter - Non dairy butter is a vegan butter alternative that is made from a mixture of plant oils. With an increase in alternative diets like vegetarianism, veganism, and gluten intolerance, plant butter is a healthy non-dairy substitute for normal butter.
- Non-Dairy Ice Cream - Plant based ice cream is a growing category. Non-dairy ice cream is a type of dessert made without any animal ingredients. This is typically considered a substitute for regular ice cream for those who cannot or do not eat animal or animal-derived products, including eggs, milk, cream, or honey.
- Plant-Based Milk - Plant based milks are milk substitutes that are made from nuts (e.g., hazelnuts, hemp seeds), seeds (e.g., sesame, walnuts, coconuts, cashews, almonds, rice, oats, etc.) or legumes (e.g., soy). Plant-based milk such as soy milk and almond milk have been popular in East Asia and the Middle East for centuries.
| Keyword | Definition |
|---|---|
| Cultured Butter | Cultured butter is prepared by having the raw butter go through chemical processing and has been added with certain emulsifiers and foreign ingredients. |
| Uncultured Butter | This type of butter is one which has not been processed in any way |
| Natural Cheese | The type of cheese in its most natural form. It is made from natural and simple products and ingredients, including fresh and natural salts, natural colors, enzymes, and high-quality milk. |
| Processed Cheese | Processed cheese undergoes the same processes as natural cheese; however, it requires more steps and many different forms of ingredients. Making processed cheese involves melting natural cheese, emulsifying it, and adding preservatives and other artificial ingredients or colorings. |
| Single Cream | Single cream contains around 18% fat. It’s a single layer of cream that appears over boiled milk. |
| Double Cream | Double cream contains 48% fat, more than double the amount of fat of single cream. It’s heavier and thicker than single cream |
| Whipping Cream | This has a much higher fat percentage than single cream (36%). Used to top cakes, pies, and puddings and as a thickener for sauces, soups, and fillings. |
| Frozen Desserts | Desserts that are meant to be eaten in frozen condition. E.g., sherbets, sorbets, frozen yogurts |
| UHT Milk (Ultra-high temperature milk) | Milk heated at a very high temperature. Ultra-high-temperature processing (UHT) of milk involves heating for 1–8 sec at 135–154°C. which kills the spore-forming pathogenic microorganism, resulting in a product with a shelf-life of several months. |
| Non-dairy butter/Plant-based butter | Butter made from plant-derived oil such as coconut, palm, etc. |
| Non-dairy Yogurt | Yogurt made from typically made from nuts, like almonds, cashews, coconuts, and even other foods like soybeans, plantains, oats, and peas |
| On-trade | It refers to restaurants, QSRs, and bars. |
| Off-trade | It refers to supermarkets, hypermarkets, on-line channels, etc. |
| Neufchatel cheese | One of the oldest kinds of cheese in France. It is a soft, slightly crumbly, mold-ripened, bloomy-rind cheese made in the Neufchâtel-en-Bray region of Normandy. |
| Flexitarian | It refers to a consumer preferring a semi-vegetarian diet, that is centered on plant foods with limited or occasional inclusion of meat. |
| Lactose Intolerance | Lactose intolerance is a reaction in digestive system to lactose, the sugar in milk. It causes uncomfortable symptoms in response to the consumption of dairy products. |
| Cream Cheese | Cream cheese is a soft and creamy fresh cheese with a tangy taste made from milk and cream. |
| Sorbets | Sorbet is a frozen dessert made using ice combined with fruit juice, fruit purée, or other ingredients, such as wine, liqueur, or honey. |
| Sherbet | Sherbet is a sweetened frozen dessert made with fruit and some sort of dairy product such as milk or cream. |
| Shelf stable | Foods that can be safely stored at room temperature, or "on the shelf," for at least one year and do not have to be cooked or refrigerated to eat safely. |
| DSD | Direct Store Delivery is the process in supply chain management wherein the product is delivered from manufacturing plant directly to the retailer. |
| OU Kosher | Orthodox Union Kosher is a kosher certification agency based in New York City. |
| Gelato | Gelato is a frozen creamy dessert made with milk, heavy cream and sugar. |
| Grass-fed Cows | Grass-fed cows are allowed to graze in pastures, where they eat a variety of grasses and clover. |


Research Methodology
Mordor Intelligence follows a four-step methodology in all our reports.
- Step-1: Identify Key Variables: In order to build a robust forecasting methodology, the variables and factors identified in Step 1 are tested against available historical market numbers. Through an iterative process, the variables required for market forecast are set, and the model is built on the basis of these variables.
- Step-2: Build a Market Model: Market-size estimations for the forecast years are in nominal terms. Inflation is not a part of the pricing, and the average selling price (ASP) is kept constant throughout the forecast period for each country.
- Step-3: Validate and Finalize: In this important step, all market numbers, variables, and analyst calls are validated through an extensive network of primary research experts from the market studied. The respondents are selected across levels and functions to generate a holistic picture of the market studied.
- Step-4: Research Outputs: Syndicated Reports, Custom Consulting Assignments, Databases & Subscription Platforms


