Europe Non-dairy Cheese Market Size and Share
Market Overview
| Study Period | 2021 - 2031 |
|---|---|
| Forecast Data Period | 2026 - 2031 |
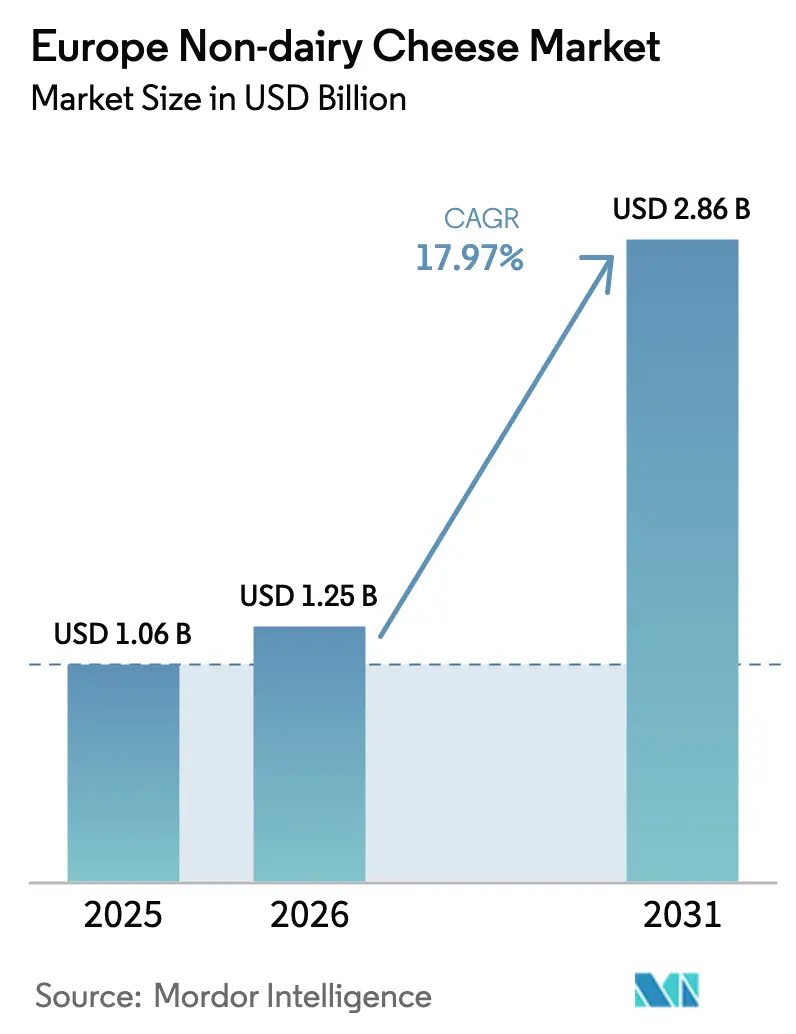
| Base Year Market Size (2025) | USD 1.06 Billion |
| Market Size (2026) | USD 1.25 Billion |
| Market Size (2031) | USD 2.86 Billion |
| Growth Rate (2026 - 2031) | 17.97% CAGR |
| Market Concentration | Medium |
Major Players*Disclaimer: Major Players sorted in no particular order Image © Mordor Intelligence. Reuse requires attribution under CC BY 4.0. |
|
Europe Non-dairy Cheese Market Analysis by Mordor Intelligence
The Europe Non-dairy cheese market size was valued at USD 1.06 billion in 2025 and estimated to grow from USD 1.25 billion in 2026 to reach USD 2.86 billion by 2031, at a CAGR of 17.97% during the forecast period (2026-2031). Flexitarian eating, precision fermentation breakthroughs, and retailer shelf reallocation underpin this expansion. Spain leads with a significant investment in 2023 and a national plant-based action plan scheduled for 2026. Germany remains the largest market for household penetration for plant-based meat and for plant-based milk, signaling widespread familiarity with dairy alternatives. Commodity price volatility in dairy, coupled with a widening toolbox of nut-, legume- and precision-fermented proteins, is accelerating product diversification. Retailers are substituting plastic tubs with ambient-temperature cans that cut cold-chain costs and support zero-waste targets, driving growth for canned packaging. Institutional funding validates the trajectory; the European Investment Bank extended a EUR 35 million facility to Formo in January 2025 to scale precision-fermented cream-cheese production [1]Source: GFI, "The French market for plant-based alternatives is resilient to inflation", gfieurope.org.
Key Report Takeaways
- By type, soy-based cheese led with 39.82% of the Europe plant-based cheese market share in 2025, while cashew-based cheese is projected to expand at a 19.72% CAGR through 2031.
- By form, slices accounted for 32.70% of the Europe plant-based cheese market size in 2025; shredded formats are advancing at a 19.55% CAGR between 2026-2031 as foodservice recovers.
- By packaging type, tubs held 44.60% share of the Europe plant-based cheese market size in 2025, whereas cans recorded the highest forecast CAGR at 19.12% thanks to easier logistics.
- By distribution channel, off-trade captured 95.80% of the Europe plant-based cheese market share in 2025; on-trade is poised to grow at an 18.21% CAGR as restaurants diversify menus.
- By geography, Germany retained the largest 25.20% share in 2025, whereas Spain is forecast to post the fastest 18.76% CAGR through 2031
Note: Market size and forecast figures in this report are generated using Mordor Intelligence’s proprietary estimation framework, updated with the latest available data and insights as of 2026.
Europe Non-dairy Cheese Market Trends and Insights
Drivers Impact Analysis*
| Driver | (~) % Impact on CAGR Forecast | Geographic Relevance | Impact Timeline |
|---|---|---|---|
| Rise in vegan and vegetarian populations | +3.2% | Germany, UK (United Kingdom), Netherlands; spillover to Spain, France | Medium term (2-4 years) |
| Increasing lactose intolerance cases in Europe | +2.1% | Southern Europe (Spain, Italy, France); moderate in Germany, UK | Long term (≥ 4 years) |
| Expansion of plant-based cheese varieties and flavors | +4.5% | Global, with early gains in Germany, the UK, and Spain | Short term (≤ 2 years) |
| Innovations in taste and the meltability of products | +5.8% | Germany, France, UK; precision-fermentation hubs (Netherlands, Finland) | Medium term (2-4 years) |
| Improved retail and online distribution channels | +2.9% | UK, Germany, Spain; e-commerce penetration in urban centers | Short term (≤ 2 years) |
| Partnerships between brands and sustainability groups | +1.7% | Germany, the Netherlands, and France; alignment with EU Green Deal policies | Long term (≥ 4 years) |
| Source: Mordor Intelligence | |||
Rise in Vegan and Vegetarian Populations
Flexitarian diets now account for a rising number of European consumers, with Germany reporting that 30% of households plan to increase plant-based meat consumption over the next two years, a behavioral shift that cascades into dairy-alternative adoption. France recorded 42% of respondents intending to adopt flexitarian eating in a 2025 OpinionWay survey, driven by animal welfare and climate concerns rather than strict veganism. Spain's plant-based sector grew in 2023, with over one-third of Spaniards consuming plant-based products and 46% of households purchasing plant-based beverages regularly. This demographic expansion is less about ideological veganism and more about incremental protein diversification, meaning plant-based cheese brands that emphasize taste parity and convenience over ethical messaging capture broader market share. The Smart Protein EU-funded survey found that flexitarians prioritize sensory experience over sustainability claims, suggesting that product development investments in texture and flavor yield higher conversion rates than carbon-footprint labeling alone.
Increasing Lactose Intolerance Cases in Europe
Lactose malabsorption affects the majority of French adults, creating a structural demand base for dairy-free cheese that persists independently of dietary trends. Southern European populations exhibit higher prevalence rates than Northern Europe, positioning Spain, Italy, and France as geographies where lactose-free positioning resonates more strongly than vegan branding. Bulgaria-based research published in 2024 confirmed that lactose intolerance remains underdiagnosed across Europe, with many consumers self-managing symptoms by reducing dairy intake rather than seeking medical diagnosis. This silent substitution behavior means plant-based cheese sales benefit from a health-driven cohort that does not identify as vegan but requires functional alternatives. Manufacturers that fortify products with calcium and vitamin B12 to match dairy nutritional profiles address this segment's concerns about nutrient adequacy, a barrier cited by the majority of European consumers who avoid plant-based products due to perceived ultra-processing.
Expansion of Plant-Based Cheese Varieties and Flavors
Product line extensions accelerated in 2024, with launches spanning aged cheddar analogs, fermented soft cheeses, and ricotta-style spreads that target specific culinary applications rather than generic dairy replacement. Dreamfarm introduced an almond-cashew ricotta in Italy in October 2024, leveraging regional familiarity with ricotta in pasta dishes to drive trial. SimplyV launched ParmVegan at Ocado UK in August 2024, addressing the grated-cheese segment where texture and umami intensity are critical for consumer acceptance. France's plant-based cheese category grew by volume in 2024, the highest rate among dairy alternatives, indicating that flavor innovation is unlocking latent demand. The shift from commodity blocks to application-specific formats, such as shredded mozzarella for pizza or herb-infused spreads for charcuterie boards, enables premium pricing and reduces direct comparison with dairy cheese on cost per kilogram. Retailers report that SKU proliferation in plant-based cheese aisles drives category growth by converting occasional buyers into repeat purchasers who experiment across flavor profiles.
Innovations in Taste and Meltability of Products
Precision fermentation and enzymatic modification are closing the sensory gap that historically limited plant-based cheese to niche consumers. Formo's partnership with Those Vegan Cowboys in March 2024 combined precision-fermented casein with traditional cheesemaking techniques to produce a cream cheese that melts and browns like dairy, addressing the functional deficits that deterred foodservice adoption. METRO Germany began stocking Formo's Frischain cream cheese in September 2024, marking a distribution win in a channel where buyers prioritize performance over sustainability credentials. The Fraunhofer Institute's Pulse2Cheese project demonstrated that microbial transglutaminase enzymes can crosslink legume proteins to replicate the elastic texture of mozzarella, a breakthrough that enables plant-based cheese to perform in high-heat applications like pizza and gratins. Leprino Foods licensed precision-fermented casein from Fooditive Group, signaling that incumbent dairy processors view bioengineered proteins as a pathway to defend market share rather than cede the category to startups. These technological advances compress the trial-to-repeat cycle by reducing the sensory compromise consumers tolerate when choosing plant-based options.
Restraints Impact Analysis*
| Restraint | (~) % Impact on CAGR Forecast | Geographic Relevance | Impact Timeline |
|---|---|---|---|
| Intense competition from dairy cheese segment | -4.3% | France, Italy, Germany; strong AOP/IGP cheese traditions | Medium term (2-4 years) |
| High production costs due to ingredients | -3.8% | Spain, UK, Germany; cashew and almond import-dependent markets | Short term (≤ 2 years) |
| Regulatory and labeling complexities in the EU | -2.1% | EU-wide, with national enforcement variations (France, Italy, Spain) | Long term (≥ 4 years) |
| Challenges replicating dairy cheese taste and texture | -5.2% | France, Italy; markets with high cheese per-capita consumption | Medium term (2-4 years) |
| Source: Mordor Intelligence | |||
Intense Competition from Dairy Cheese Segment
EU dairy cheese production is forecast to grow significantly in 2025, driven by export demand and tourism recovery. France's AOP and IGP cheeses alone generate significant, commanding premium shelf space and consumer loyalty that plant-based brands struggle to disrupt. Soft cheese exports from the EU grew in 2024, indicating robust demand for traditional dairy formats that directly compete with plant-based brie and camembert analogs[2]Source: Team France Export, "The global dairy market: 2024 review and 2025 outlook", teamfrance-export.fr. Price normalization for butter and milk powders in 2025 may reduce input costs for dairy cheesemakers, widening the price gap with plant-based alternatives that rely on imported cashews and almonds. Bel Group's decision to discontinue its Nurishh vegan cheese brand at the end of 2025 due to low consumer uptake underscores the difficulty of achieving profitability in a category where dairy incumbents can absorb losses to defend market share.
High Production Costs Due to Ingredients
Cashew and almond prices remain elevated due to concentrated sourcing from India, Vietnam, and California, with limited processing infrastructure in Europe to capture value-chain margins. Spain's plant-based meat alternatives are priced higher per kilogram than animal meat, reflecting similar cost structures in plant-based cheese, where low production volumes prevent economies of scale. Lidl Netherlands' price-parity experiment, which matched plant-based products with conventional equivalents, increased sales but required retailer margin compression rather than supplier cost reductions, a model that is not sustainable across all channels. Precision-fermentation ingredients like casein analogs currently cost 10 to 20 times more than dairy-derived casein, limiting their use to premium products until bioreactor capacity scales and feedstock costs decline.
*Our forecasts treat driver/restraint impacts as directional, not additive. The impact forecasts reflect baseline growth, mix effects, and variable interactions.
Segment Analysis
By Type: Cashew Formulations Outpace Soy as Meltability Demands Rise
Soy-based cheese held 39.82% of the market in 2025, anchored by established supply chains and lower raw-material costs than nut-based alternatives, but cashew-based cheese is expanding at 19.72% CAGR through 2031 as manufacturers prioritize neutral flavor profiles and superior fat content that mimics dairy cheese mouthfeel. Almond-based cheese appeals to consumers seeking lower-calorie options, though its slightly sweet flavor limits applications in savory dishes. Others, including coconut-oil-based and oat-based cheeses, capture niche segments where allergen avoidance or regional ingredient preferences dictate formulation choices. Violife's Supreme Cheddarton, which incorporates lentil protein to deliver 9.5 grams of protein per 100 grams, illustrates how legume blends are being used to boost nutritional density and address the perception that plant-based cheeses are protein-deficient.
Cashew's ascendance reflects a broader industry pivot toward premium positioning and functional performance. Dreamfarm's almond-cashew ricotta, launched in Italy in October 2024, targets the EUR 1.8 billion Italian fresh-cheese segment, where texture and moisture content are critical for pasta fillings and spreads. Soy-based cheese remains dominant in Germany and the Netherlands, where early market entrants like Violife and Soyana established brand recognition, but growth is decelerating as consumers associate soy with GMO concerns despite EU regulations requiring non-GMO labeling. Precision-fermented casein, licensed by Leprino Foods from Fooditive Group, represents a potential disruptor that bypasses plant-protein limitations entirely by producing dairy-identical proteins in bioreactors, though regulatory approvals and cost structures remain barriers to widespread commercialization.


By Form: Shredded Formats Gain as Foodservice Recovers
Slices commanded 32.70% of the market in 2025, driven by sandwich and burger applications where convenience and portion control matter more than melt performance, yet shredded cheese is growing at 19.55% CAGR as pizza chains and pasta restaurants reintroduce plant-based menu options post-pandemic. Blocks appeal to artisanal consumers who grate or slice at home, while cubes serve charcuterie and snacking occasions. Others, including crumbles and spreads, address niche culinary uses such as salad toppings and dips. METRO Germany's decision to stock Formo's Frischain cream cheese in September 2024 signals that foodservice buyers are willing to trial plant-based formats if they perform comparably to dairy in high-heat applications.
The shredded segment's acceleration is tied to technological breakthroughs in melt and stretch. Violife's mozzarella shreds, formulated for pizza, leverage modified starches and coconut oil to replicate the browning and elasticity that consumers expect from dairy mozzarella, a sensory benchmark that earlier plant-based cheeses failed to meet. SimplyV's ParmVegan, launched at Ocado UK in August 2024, targets the grated-cheese segment where umami intensity and granular texture are critical for pasta and salad applications. Slices remain the largest format due to retail dominance and consumer familiarity, but their growth is constrained by limited differentiation opportunities,most brands compete on price rather than sensory innovation. Blocks and cubes serve premium segments where consumers tolerate higher prices for artisanal positioning, but volumes remain small relative to slices and shreds.
By Packaging Type: Cans Capture Sustainability-Conscious Buyers
Tubs held 44.60% of packaging share in 2025, favored for soft cheeses and spreads where resealability and refrigeration are standard, but cans are expanding at 19.12% CAGR as retailers seek shelf-stable formats that reduce cold-chain logistics costs and appeal to sustainability-conscious consumers. Tins serve niche applications like aged cheese analogs that benefit from metal's light-blocking properties, while cans' recyclability and ambient storage align with zero-waste retail initiatives. Lidl Switzerland's adoption of cellulose-based packaging for cheese in 2024 reflects broader retailer pressure on suppliers to adopt compostable or recyclable materials that reduce plastic waste.
Cans' growth is driven by e-commerce and export channels, where ambient stability reduces spoilage risk and shipping costs. Tubs remain dominant in fresh cheese categories like ricotta and cream cheese, where refrigeration is unavoidable, and consumers prioritize convenience over sustainability. Tins' share remains marginal, limited to specialty products like vegan parmesan that mimic dairy's shelf-stable grated formats. The packaging landscape is fragmenting as brands experiment with glass jars, paper-based wraps, and biodegradable films to differentiate on environmental credentials, but cost premiums of 15% to 30% for sustainable packaging constrain adoption to premium SKUs. Retailers like Lidl are using private-label plant-based cheese to pilot sustainable packaging at scale, leveraging volume commitments to negotiate lower material costs with suppliers.

By Distribution Channel: On-Trade Rebounds as Menus Diversify
Off-trade channels accounted for 95.80% of sales in 2025, reflecting plant-based cheese's retail origins and consumer preference for home preparation, yet on-trade is growing at 18.21% CAGR as restaurants, cafes, and hotels reintroduce plant-based options to capture flexitarian diners and reduce exposure to volatile dairy prices. Ocado's nationwide UK listings for I AM NUT OK in May 2025 and SimplyV in August 2024 illustrate how online grocers are expanding plant-based cheese assortments to meet e-commerce demand.
On-trade's resurgence is tied to menu innovation and margin management. Foodservice operators report that plant-based cheese costs 20% to 30% less than premium dairy cheese while commanding similar menu prices, enabling margin expansion on plant-based pizzas and pasta dishes. METRO Germany's distribution of Formo's Frischain to independent restaurants in September 2024 signals that wholesalers are building plant-based assortments to serve operators seeking differentiation in competitive urban markets. Specialist retailers like La Fauxmagerie in the UK curate artisanal plant-based cheese selections that educate consumers on pairing and usage, creating a halo effect that lifts category perception in mainstream supermarkets.
Geography Analysis
Spain's 18.76% CAGR through 2031 positions it as Europe's fastest-growing plant-based cheese market. The Spanish government's planned Plan de Acción para los Alimentos Plant-Based for 2026 and potential VAT reductions on sustainable foods signal policy tailwinds that could lower retail prices and expand addressable markets. Plant-based cheese volume in Spain grew between 2022 and 2024, outpacing value growth and indicating that price compression is driving trial among price-sensitive consumers. Spain's agri-food innovation ecosystem, comprising over 420 startups concentrated in Madrid, Catalonia, the Basque Country, and Andalusia, attracted EUR 226 million in investment in 2023, funding capacity expansions and R&D that will support long-term supply growth. Vegetal/es, Spain's plant-based food association, reports that each EUR 1 of sector output generates EUR 3.7 in the broader economy and creates 3.9 indirect jobs per direct position, multipliers that are being used to lobby for regulatory clarity and public investment.
Germany retained 25.20% market share in 2025, anchored by household penetration rates for plant-based meat and for plant-based milk, the highest in Europe. Plant-based cheese represents a small share of total cheese sales by volume in Germany, a small absolute share but one that is expanding as private-label products undercut branded alternatives. Veganz's opening of a vegan cheese factory in Germany in May 2024 reflects manufacturer confidence in long-term demand, while Formo's EUR 35 million EIB loan in January 2025 funds precision-fermentation capacity that will supply German and broader European markets. The price gap between plant-based and animal products in Germany narrowed in early 2024, driven by private-label expansion and dairy price inflation, a convergence that is accelerating trial among mainstream consumers.
The United Kingdom, France, and Italy represent mature markets with distinct growth drivers. The UK's Ocado listings for I AM NUT OK and SimplyV in 2025 expanded nationwide availability, while McDonald's continued its McPlant burger offering in the UK despite withdrawing it from the US, signaling sustained foodservice demand. France's plant-based cheese sales reached a significant milestone by volume, the highest rate among dairy alternatives. Italy's plant-based cheese volume grew between 2022 and 2024, driven by ricotta and mozzarella analogs that align with pasta and pizza consumption patterns. New Zealand, though geographically distant, is included in the Europe report scope due to trade agreements and export flows, while Rest of Europe encompasses smaller markets like the Netherlands, Belgium, and Scandinavia where plant-based cheese penetration varies by local dairy consumption patterns and regulatory environments.
Competitive Landscape
The European plant-based cheese market registers moderate concentration, reflecting a mix of multinational dairy incumbents, specialized plant-based brands, and precision-fermentation startups that compete on distribution scale, sensory performance, and technological differentiation. Flora Food Group and Bel Group leverage existing retail relationships and reformulation expertise to introduce plant-based lines that sit alongside dairy portfolios, while Danone's acquisition of Follow Your Heart and conversion of a EUR 49 million oat milk plant signal institutional commitment to dairy alternatives.
Emerging players like Formo and Those Vegan Cowboys deploy precision-fermented casein analogs to bypass traditional plant-protein limitations, with Formo securing a EUR 35 million EIB loan in January 2025 to scale production of its cream cheese that melts and browns like dairy. Opportunities center on aged cheese analogs and fermented soft cheeses, where sensory complexity and artisanal positioning command price premiums that offset higher production costs. Bel Group's discontinuation of its Nurishh vegan cheese brand at the end of 2025 due to low consumer uptake illustrates the profitability challenges that force even well-capitalized incumbents to exit unprofitable segments.
Technology adoption is bifurcating the market: precision-fermentation players like Formo and Those Vegan Cowboys pursue functional parity with dairy through bioengineered proteins, while artisanal brands like Jay&Joy and La Fauxmagerie emphasize traditional fermentation and nut-based formulations that appeal to clean-label consumers. Lidl's 2025 competition for plant-based cheese suppliers, with submissions open until April, reflects the retailer's willingness to co-develop products that meet price and quality thresholds, creating opportunities for mid-tier manufacturers to secure volume commitments. EFSA's ongoing evaluation of precision-fermented ingredients means that next-generation plant-based cheeses incorporating bioengineered casein face multi-year approval timelines, a regulatory gating factor that advantages incumbents with diversified portfolios over startups dependent on novel ingredients.
Europe Non-dairy Cheese Industry Leaders
-
Bel Group
-
Danone SA
-
Saputo Inc.
-
Simply V
-
Upfield Holdings BV
- *Disclaimer: Major Players sorted in no particular order

Recent Industry Developments
- February 2025: Viva la Faba's plant-based cheese was planned for launch in German retailers and restaurants in 2025. The company had also established its first strategic partnerships within the food industry. "Our vision was to make plant-based cheese, crafted from bioeconomy-sourced raw materials, a mainstream choice while actively reducing the food industry's climate impact," stated Isa Entenmann, Head of R&D at Viva la Faba.
- September 2024: Berlin-based startup Formo, recognized for its work in fermentation, debuted its first products on the market. Frischhain, a cream cheese analogue made from koji protein, became available in the aforementioned grocery stores in plain and herb flavours. A tomato version was set to follow in the subsequent weeks, alongside Camembritz (a Camembert replica). The launch coincided with the conclusion of Formo’s Series B funding round, during which it secured USD 61M from investors, including existing backers FoodLabs, EQT Ventures, and Lowercarbon Capital, while also welcoming new financiers such as The Nature Conservancy and Rewe Group, among others.
- April 2024: Italian startup Dreamfarm announced that its almond-based cheese alternatives had launched in Germany. The cheeses were initially made available at Edeka stores in Berlin, with potential plans to expand to restaurants and pizzerias. This announcement came less than two months after Dreamfarm expanded to Delhaize stores in Belgium, following an “incredibly positive” reception in Italy. A launch in the Netherlands was also reported to be under consideration.


Europe Non-dairy Cheese Market Report Scope
| Cashew-Based Cheese |
| Soy-Based Cheese |
| Almond-Based Cheese |
| Others |
| Shredded |
| Blocks |
| Cubes |
| Slices |
| Others |
| Tubs |
| Tins |
| Cans |
| On-trade | |
| Off-trade | Convenience Stores |
| Specialist Retailers | |
| Supermarkets and Hypermarkets | |
| On-line Retail | |
| Others |
| Spain |
| United Kingdom |
| Germany |
| France |
| Italy |
| New Zealand |
| Rest of Europe |
| Type | Cashew-Based Cheese | |
| Soy-Based Cheese | ||
| Almond-Based Cheese | ||
| Others | ||
| Form | Shredded | |
| Blocks | ||
| Cubes | ||
| Slices | ||
| Others | ||
| Packaging Type | Tubs | |
| Tins | ||
| Cans | ||
| Distribution Channel | On-trade | |
| Off-trade | Convenience Stores | |
| Specialist Retailers | ||
| Supermarkets and Hypermarkets | ||
| On-line Retail | ||
| Others | ||
| Geography | Spain | |
| United Kingdom | ||
| Germany | ||
| France | ||
| Italy | ||
| New Zealand | ||
| Rest of Europe | ||


Market Definition
- Dairy Alternatives - Dairy alternatives are foods that are made from plant-based milk/oils instead of their usual animal products, such as cheese, butter, milk, ice cream, yogurt, etc. Plant-based or non-dairy milk alternative is the fast-growing segment in the newer food product development category of functional and specialty beverage across the globe.
- Non-Dairy Butter - Non dairy butter is a vegan butter alternative that is made from a mixture of plant oils. With an increase in alternative diets like vegetarianism, veganism, and gluten intolerance, plant butter is a healthy non-dairy substitute for normal butter.
- Non-Dairy Ice Cream - Plant based ice cream is a growing category. Non-dairy ice cream is a type of dessert made without any animal ingredients. This is typically considered a substitute for regular ice cream for those who cannot or do not eat animal or animal-derived products, including eggs, milk, cream, or honey.
- Plant-Based Milk - Plant based milks are milk substitutes that are made from nuts (e.g., hazelnuts, hemp seeds), seeds (e.g., sesame, walnuts, coconuts, cashews, almonds, rice, oats, etc.) or legumes (e.g., soy). Plant-based milk such as soy milk and almond milk have been popular in East Asia and the Middle East for centuries.
| Keyword | Definition |
|---|---|
| Cultured Butter | Cultured butter is prepared by having the raw butter go through chemical processing and has been added with certain emulsifiers and foreign ingredients. |
| Uncultured Butter | This type of butter is one which has not been processed in any way |
| Natural Cheese | The type of cheese in its most natural form. It is made from natural and simple products and ingredients, including fresh and natural salts, natural colors, enzymes, and high-quality milk. |
| Processed Cheese | Processed cheese undergoes the same processes as natural cheese; however, it requires more steps and many different forms of ingredients. Making processed cheese involves melting natural cheese, emulsifying it, and adding preservatives and other artificial ingredients or colorings. |
| Single Cream | Single cream contains around 18% fat. It’s a single layer of cream that appears over boiled milk. |
| Double Cream | Double cream contains 48% fat, more than double the amount of fat of single cream. It’s heavier and thicker than single cream |
| Whipping Cream | This has a much higher fat percentage than single cream (36%). Used to top cakes, pies, and puddings and as a thickener for sauces, soups, and fillings. |
| Frozen Desserts | Desserts that are meant to be eaten in frozen condition. E.g., sherbets, sorbets, frozen yogurts |
| UHT Milk (Ultra-high temperature milk) | Milk heated at a very high temperature. Ultra-high-temperature processing (UHT) of milk involves heating for 1–8 sec at 135–154°C. which kills the spore-forming pathogenic microorganism, resulting in a product with a shelf-life of several months. |
| Non-dairy butter/Plant-based butter | Butter made from plant-derived oil such as coconut, palm, etc. |
| Non-dairy Yogurt | Yogurt made from typically made from nuts, like almonds, cashews, coconuts, and even other foods like soybeans, plantains, oats, and peas |
| On-trade | It refers to restaurants, QSRs, and bars. |
| Off-trade | It refers to supermarkets, hypermarkets, on-line channels, etc. |
| Neufchatel cheese | One of the oldest kinds of cheese in France. It is a soft, slightly crumbly, mold-ripened, bloomy-rind cheese made in the Neufchâtel-en-Bray region of Normandy. |
| Flexitarian | It refers to a consumer preferring a semi-vegetarian diet, that is centered on plant foods with limited or occasional inclusion of meat. |
| Lactose Intolerance | Lactose intolerance is a reaction in digestive system to lactose, the sugar in milk. It causes uncomfortable symptoms in response to the consumption of dairy products. |
| Cream Cheese | Cream cheese is a soft and creamy fresh cheese with a tangy taste made from milk and cream. |
| Sorbets | Sorbet is a frozen dessert made using ice combined with fruit juice, fruit purée, or other ingredients, such as wine, liqueur, or honey. |
| Sherbet | Sherbet is a sweetened frozen dessert made with fruit and some sort of dairy product such as milk or cream. |
| Shelf stable | Foods that can be safely stored at room temperature, or "on the shelf," for at least one year and do not have to be cooked or refrigerated to eat safely. |
| DSD | Direct Store Delivery is the process in supply chain management wherein the product is delivered from manufacturing plant directly to the retailer. |
| OU Kosher | Orthodox Union Kosher is a kosher certification agency based in New York City. |
| Gelato | Gelato is a frozen creamy dessert made with milk, heavy cream and sugar. |
| Grass-fed Cows | Grass-fed cows are allowed to graze in pastures, where they eat a variety of grasses and clover. |


Research Methodology
Mordor Intelligence follows a four-step methodology in all our reports.
- Step-1: Identify Key Variables: In order to build a robust forecasting methodology, the variables and factors identified in Step 1 are tested against available historical market numbers. Through an iterative process, the variables required for market forecast are set, and the model is built on the basis of these variables.
- Step-2: Build a Market Model: Market-size estimations for the forecast years are in nominal terms. Inflation is not a part of the pricing, and the average selling price (ASP) is kept constant throughout the forecast period for each country.
- Step-3: Validate and Finalize: In this important step, all market numbers, variables, and analyst calls are validated through an extensive network of primary research experts from the market studied. The respondents are selected across levels and functions to generate a holistic picture of the market studied.
- Step-4: Research Outputs: Syndicated Reports, Custom Consulting Assignments, Databases & Subscription Platforms


