Europe Dairy Market Size and Share
Market Overview
| Study Period | 2021 - 2031 |
|---|---|
| Forecast Data Period | 2026 - 2031 |
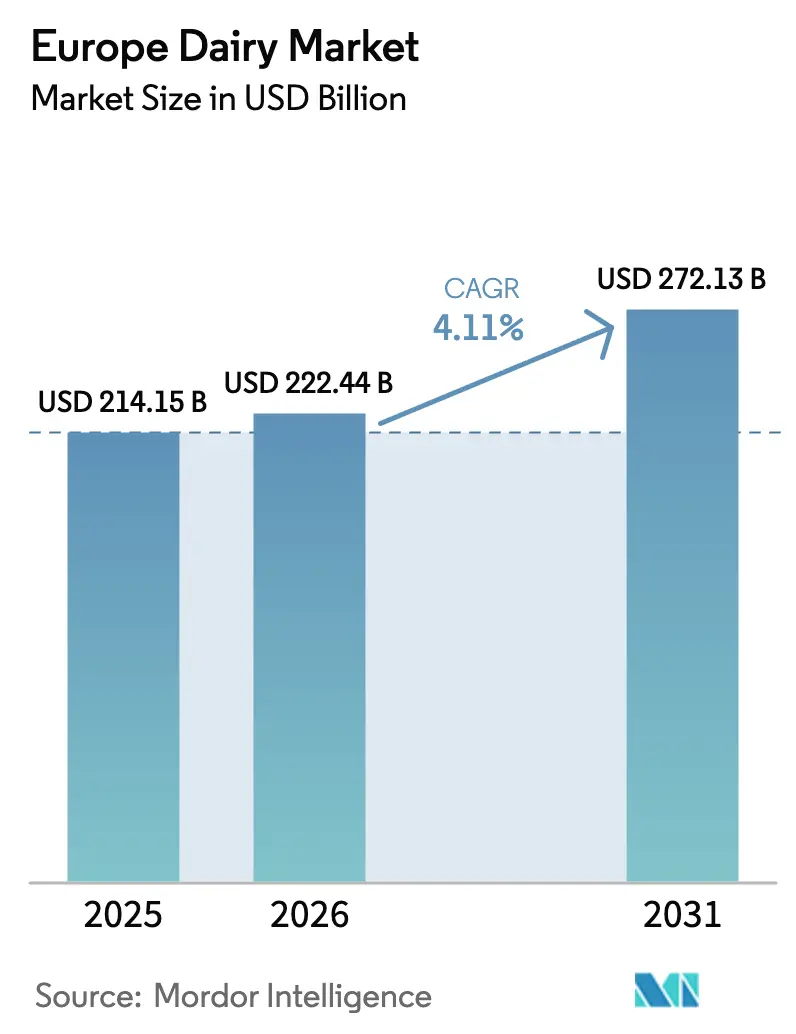
| Base Year Market Size (2025) | USD 214.15 Billion |
| Market Size (2026) | USD 222.44 Billion |
| Market Size (2031) | USD 272.13 Billion |
| Growth Rate (2026 - 2031) | 4.11% CAGR |
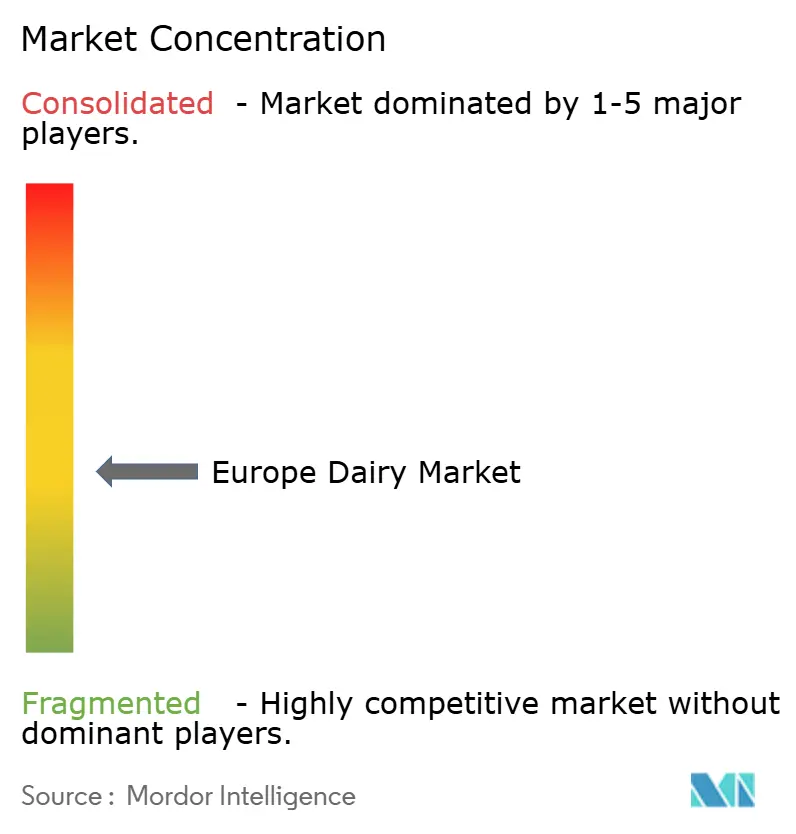
| Market Concentration | Medium |
Major Players *Disclaimer: Major Players sorted in no particular order Image © Mordor Intelligence. Reuse requires attribution under CC BY 4.0. | |
Europe Dairy Market Analysis by Mordor Intelligence
The Europe dairy market size is projected to be USD 214.15 billion in 2025, USD 222.44 billion in 2026, and reach USD 272.13 billion by 2031, growing at a CAGR of 4.11% from 2026 to 2031. Rising disposable incomes, the premiumization of cheese and dairy desserts, and sustained investment in carbon-neutral certification are together steering the European dairy market toward higher-margin categories. Functional yogurt, lactose-free milk, and protein-enriched drinkables are widening consumer appeal beyond traditional segments, while retailers expand organic lines that command double-digit price premiums. At the same time, volatility in raw-milk prices and the rollout of livestock carbon taxes are pressuring farm economics, encouraging cooperatives to accelerate herd rationalization and automation. Export momentum for Protected Designation of Origin cheeses into North America and Asia is reinforcing the competitive edge of the European dairy market, even as domestic liquid-milk volumes continue a multi-year slide.
Key Report Takeaways
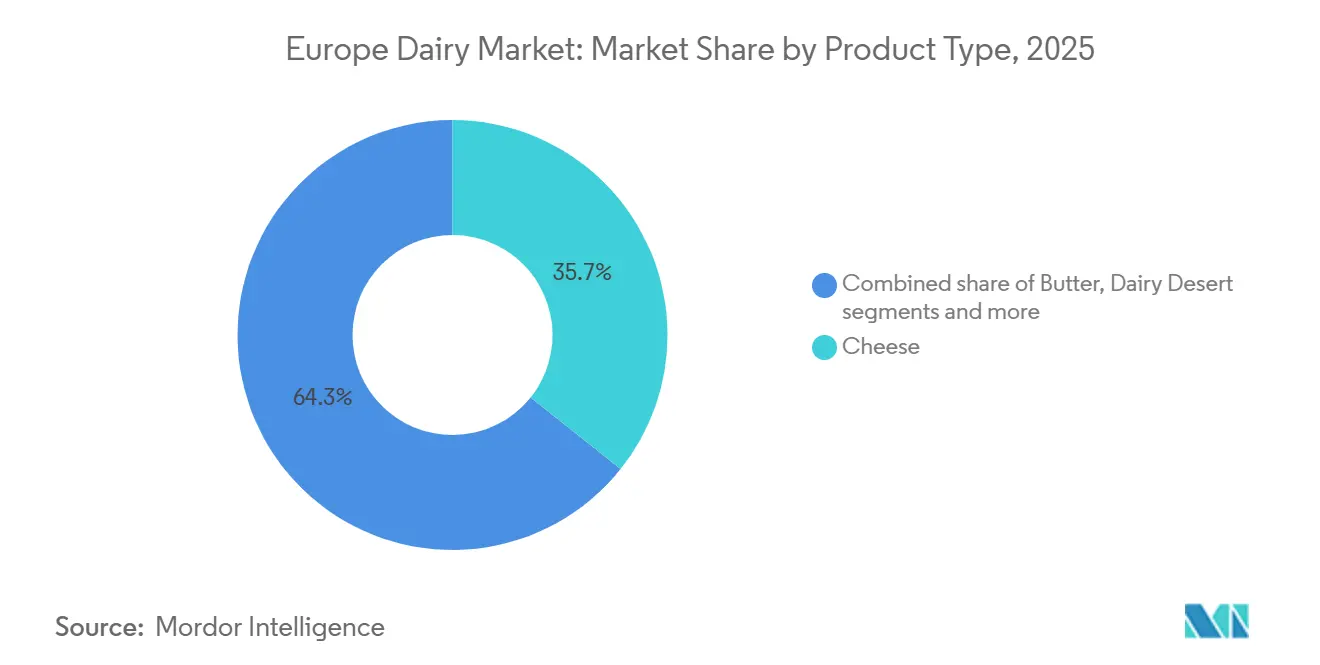
- By product type, cheese held 35.72% of the European dairy market share in 2025, while dairy desserts posted the fastest 5.25% CAGR through 2031.
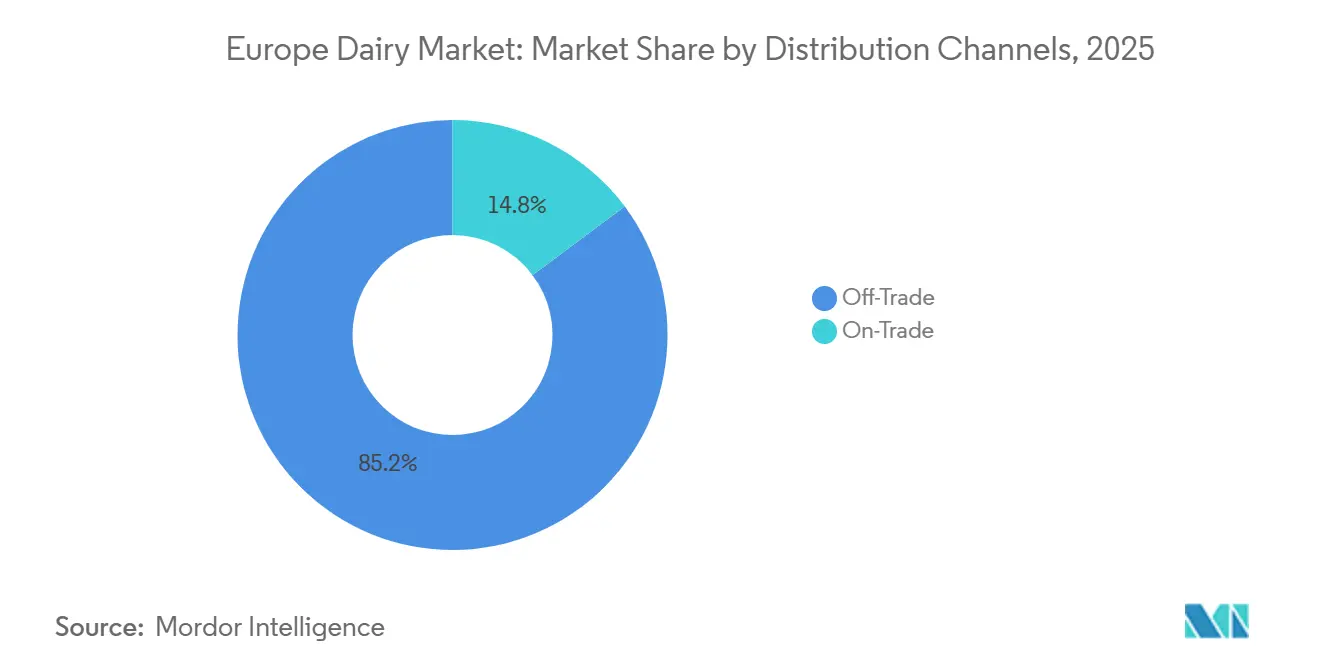
- By distribution channel, off-trade outlets commanded 85.21% revenue share of the European dairy market in 2025; on-trade sales are advancing at a 5.42% CAGR as hospitality demand rebounds.
- By geography, Germany led with 25.28% revenue share of the European dairy market in 2025, whereas Italy is expanding at a 5.83% CAGR through 2031.
Note: Market size and forecast figures in this report are generated using Mordor Intelligence’s proprietary estimation framework, updated with the latest available data and insights as of 2026.
Europe Dairy Market Trends and Insights
Drivers Impact Analysis*
| Drivers | (~) % Impact on CAGR Forecasts | Geographic Relevance | Impact Timeline |
|---|---|---|---|
| Growing Demand for Organic and Natural Dairy Items | +0.7% | Western Europe (Germany, France, UK), spill-over to Nordics | Medium term (2-4 years) |
| Advances in Convenient Formats Like Mini-Packs and Portable Portions | +0.5% | Global, early gains in urban centers of France, Germany, Netherlands | Short term (≤ 2 years) |
| Shift Toward Dairy Desserts and Indulgent Snack Options | +0.9% | Southern Europe (Italy, Spain), expanding to Central Europe | Medium term (2-4 years) |
| Surge in Functional and Value-Added Dairy Products | +0.8% | Western and Northern Europe, nascent in Eastern Europe | Long term (≥ 4 years) |
| Premium Positioning from Carbon-Neutral Milk Certifications | +0.4% | Northern Europe (Denmark, Sweden, Netherlands), export-focused | Long term (≥ 4 years) |
| Strong Export Demand for European Cheeses | +0.6% | France, Italy, Netherlands; export corridors to North America, Asia | Medium term (2-4 years) |
| Source: Mordor Intelligence | |||


Growing Demand for Organic and Natural Dairy Items
In 2025, organic dairy sales in Europe reached EUR 5.8 billion (USD 6.2 billion), with Germany and France contributing 58% of the total. This growth is driven by retailers expanding their offerings of certified organic products, such as milk, yogurt, and cheese. Consumers' increasing distrust of synthetic additives and their willingness to pay a 25-35% premium for EU Organic and Demeter certified products are key factors behind this trend. Arla Foods reported a 9% year-on-year rise in organic milk volumes in 2025, while conventional milk sales declined by 2%, highlighting a shift in dairy spending toward transparency and traceability. Retailers like Carrefour and Rewe have introduced private-label organic dairy lines sourced from local cooperatives, which streamline supply chains and improve profit margins. This trend is particularly evident in urban markets, where younger households prioritize sustainability. However, price sensitivity in Eastern Europe limits immediate market penetration. The EU's Common Agricultural Policy is supporting this growth by providing subsidies for organic transitions, with an estimated 1.2 million hectares of organic pasture expected to be added by 2028, further integrating organic dairy into mainstream distribution[1]Source: European Commission, “Price Monitoring Sector,” Agriculture and Rural Development, agriculture.ec.europa.eu.
Advances in Convenient Formats Like Mini-Packs and Portable Portions
European supermarkets and convenience stores are increasingly offering single-serve yogurt cups, 150-gram cheese portions, and 200-milliliter UHT milk cartons. This growth addresses the rising demand for on-the-go consumption, a trend fueled by hybrid work schedules. In 2025, Danone unveiled its "Danone On-the-Go" range, which includes resealable yogurt pouches and protein-enriched drinkables in 250-milliliter formats. Within six months, this range achieved a 4% incremental market share in France. Packaging innovations now feature portion-controlled butter and cream sachets designed for foodservice. These advancements help reduce waste and streamline inventory management for cafés and quick-service restaurants. The mini-pack trend is particularly significant for dairy desserts. Manufacturers are introducing 100-gram ice cream tubs and individually wrapped cheesecake slices, strategically positioning them to compete with confectionery products in impulse-purchase aisles. FrieslandCampina's 2025 investor presentation highlighted an 11% volume growth in portable dairy formats. This increase is primarily driven by convenience stores and petrol station forecourts, which effectively serve commuter traffic. Additionally, this shift in dairy formats aligns with the growing focus on portion control. Health-conscious consumers are increasingly aiming to manage their calorie intake while still enjoying indulgent treats.
Shift Toward Dairy Desserts and Indulgent Snack Options
In 2025, Unilever's ice cream division saw an 8% growth in Europe for its premium brands, Magnum and Ben & Jerry's. Notably, plant-based variants accounted for 15% of this incremental volume. Millennial and Gen-Z consumers, who prioritize experiential eating, are gravitating towards frozen desserts with exotic flavors like pistachio, salted caramel, and matcha. Additionally, segments like cheesecake and pudding are reaping the benefits of clean-label reformulations, swapping out artificial stabilizers for natural alternatives such as agar and pectin. This trend is especially strong in Italy and Spain, where gelato artisans are collaborating with major processors to transform artisanal recipes into retail-ready formats. In 2024, Froneri, a joint venture of Nestlé and PAI Partners, poured EUR 45 million (USD 48 million) into a new frozen dessert facility in Poland, aiming at Central European markets with a focus on localized flavors and smaller pack sizes. Meanwhile, regulatory measures like the EU's Nutri-Score labeling are urging manufacturers to cut down on sugar content, leading to innovations in natural sweeteners such as stevia and monk fruit.
Surge in Functional and Value-Added Dairy Products
High-protein yogurts, probiotic drinkables, and lactose-free milk are transforming dairy portfolios, with functional claims driving 12-15% price premiums over traditional alternatives. Valio, a Finnish cooperative, reported that its Valio PROfeel protein yogurt range generated EUR 120 million (USD 128 million) in sales during 2025, reflecting a 14% increase from the previous year, as consumers prioritize convenient protein sources for post-workout nutrition. Probiotic strains such as Lactobacillus rhamnosus GG and Bifidobacterium lactis are being added to drinkable yogurts and kefir, supported by clinical studies linking gut microbiome health to improved immunity and mental well-being. In 2025, Danone's Activia brand expanded into 12 new European markets, leveraging localized flavor preferences and collaborations with nutritionists to enhance credibility. Lactose-free dairy, addressing the needs of an estimated 30-40% of European adults with lactose intolerance, experienced a 9% growth in volume terms during 2025, with Arla and Valio leading advancements in lactose-free cheese and cream. In Northern Europe, where sunlight exposure is limited, fortification with vitamins D, B12, and calcium has become standard in UHT milk and yogurt. The European Food Safety Authority's approval of new probiotic strains in 2024 has accelerated product development cycles, enabling faster market entry for functional dairy innovations[2]Source: European Food Safety Authority, “Probiotic Strain Approvals 2024,” efsa.europa.eu.
Restraints Impact Analysis*
| Restraints | (~) % Impact on CAGR Forecasts | Geographic Relevance | Impact Timeline |
|---|---|---|---|
| Surging Raw Milk Prices Across the EU | -0.6% | EU-27, acute in Germany, France, Poland | Short term (≤ 2 years) |
| Drop in Consumption of Traditional Liquid Milk | -0.4% | Western and Northern Europe, gradual spread to Eastern Europe | Medium term (2-4 years) |
| Scope-3 Decarbonization Expenses Prompting Herd Reductions | -0.3% | Northern Europe (Denmark, Netherlands, Sweden) | Long term (≥ 4 years) |
| New Livestock Carbon Taxes in Northern Europe | -0.5% | Denmark, Sweden, Netherlands; potential expansion to Belgium | Medium term (2-4 years) |
| Source: Mordor Intelligence | |||
Surging Raw Milk Prices Across the EU
Raw milk prices in the EU-27 averaged EUR 0.48 per kilogram (USD 0.51) in 2025, a 14% increase from 2024, driven by drought-induced feed cost inflation and reduced milk yields per cow. Germany and France, which together account for 38% of EU milk production, experienced particularly acute price spikes, with German farmgate prices reaching EUR 0.52 per kilogram in Q3 2025, according to the Deutscher Bauernverband[3]Source: Deutscher Bauernverband, “Milk Market Report 2025,” bauernverband.de. This volatility is compressing processor margins, as retailers resist passing full cost increases to consumers amid broader food inflation concerns. Smaller cooperatives in Poland and the Baltics are particularly vulnerable, with several exiting the market or consolidating into larger entities to achieve procurement scale. Arla Foods' 2025 annual report noted that raw milk costs represented 68% of total cost of goods sold, up from 62% in 2023, prompting the cooperative to accelerate automation investments and renegotiate supply contracts. The European Central Bank's interest rate hikes have further strained working capital, as processors carry higher inventory financing costs during seasonal milk production peaks.
Drop in Consumption of Traditional Liquid Milk
In 2025, the EU-27 saw a dip in per capita liquid milk consumption, dropping to 52 liters from 54 liters in 2024 and 58 liters in 2020. This decline is attributed to the rising popularity of plant-based alternatives and functional beverages, which are increasingly taking over traditional dairy's role in breakfast and cooking. In 2025, Germany's liquid milk market shrank by 3.8% in volume. Meanwhile, oat and almond drinks expanded their foothold, rising to capture 18% of the total milk category, a notable increase from 14% in 2023. Urban millennials and Gen-Z consumers are driving this shift, favoring plant-based options for their perceived sustainability and ethics. However, it's worth noting that lifecycle analyses indicate European dairy farming boasts a lower carbon intensity compared to imported almond or soy beverages. In response, processors are enhancing liquid milk with added protein, vitamins, and omega-3 fatty acids. They're also introducing lactose-free and organic variants to cater to health-conscious consumers. FrieslandCampina's 2025 investor presentation highlighted a 4% drop in liquid milk volumes in Western Europe, though this was somewhat counterbalanced by a 9% surge in lactose-free and organic milk. Eastern Europe, with its deep-rooted cultural ties to traditional dairy, is witnessing a milder trend. Yet, even there, younger consumers are starting to explore plant-based alternatives.
*Our forecasts treat driver/restraint impacts as directional, not additive. The impact forecasts reflect baseline growth, mix effects, and variable interactions.
Segment Analysis
By Product Type: Cheese Dominance Drives Export Competitiveness
Cheese captured 35.72% of Europe's dairy market share in 2025 and continues to anchor category value owing to its culinary versatility and export stature. Natural varieties, including cheddar and Parmigiano-Reggiano, benefit from clean-label cues, whereas processed cheese underpins the quick-service sector through superior meltability. Vintage cheddar from the United Kingdom and Ireland now commands premiums of 20-30% over standard grades, bolstering contribution margins. The European dairy market size for dairy desserts is expanding at a 5.25% CAGR, propelled by premium ice cream, frozen yogurt, and cheesecake innovations that tap snacking occasions. Unilever’s premium brands accounted for 60% of its 2025 European ice-cream revenue despite representing only 35% of volume, signaling sustained trading-up momentum.
Milk in its various forms is challenged by plant-based substitutes, yet fortified UHT and flavored milk lines are stabilizing volumes through convenience and added nutrition. Yogurt splits into spoonable and drinkable formats, with the latter gaining from on-the-go lifestyles and delivering 7% volume growth in 2025. Cream and butter stay resilient as home baking persists, while sour-milk drinks such as kefir find new audiences beyond Eastern Europe. The widespread adoption of innovation across sub-segments cements product diversity as a hedge against category-specific headwinds for the European dairy market.


By Distribution Channel: Off-Trade Dominance Meets On-Trade Recovery
Off-trade retained 85.21% of value in 2025, consolidating its role as the primary outlet for routine dairy purchases. Supermarkets and hypermarkets leverage private-label cheese and yogurt to attract footfall, while convenience stores gain urban share on proximity and impulse buys. Online grocery, though still small, logged 18% value growth in 2025, supported by dairy subscription models and cooperative-led direct-to-consumer pilots. These shifts oblige processors to refine pack sizes and cold-chain logistics across multiple platforms.
On-trade is staging a 5.42% CAGR recovery to 2031 as cafés, restaurants, and hotels rebuild menus around local dairy. Artisanal cheese boards, indulgent milk-based desserts, and specialty coffee creamers all intensify foodservice pull-through, broadening exposure for high-margin items. Specialty retailers and fromageries cater to affluent shoppers, adding narrative depth that online formats sometimes lack. Integrated data systems now blend off-trade and on-trade insights, helping suppliers synchronize production with real-time demand in the European dairy market.
Geography Analysis
In 2025, France secured a dominant 25.28% share of the European dairy market, leveraging its prowess in soft cheese, butter, and yogurt. A cooperative framework, channeling 60% of the nation's milk through giants like Lactalis, Sodiaal, and Savencia, bolstered this position. Exports of Comté and Roquefort cheeses grew by 6% in 2025, thanks to effective storytelling that highlighted their unique terroir. Meanwhile, Germany, facing a dip in liquid milk, celebrated an 11% rise in organic dairy sales, fueled by broader offerings from retailers. Rising farm-gate prices exerted pressure on supplies, prompting processors to hasten their automation and decarbonization efforts.
Italy, with a projected 5.83% CAGR growth, is banking on upgrades to its Parmigiano-Reggiano and mozzarella capacities, eyeing global pizza chains. Investments in automated stretching techniques and extended aging warehouses not only enhance cost efficiency but also uphold the esteemed Protected Designation quality standards. While Spain enjoys robust domestic yogurt and cheese consumption, it finds itself trailing behind in exports. The UK, navigating the post-Brexit landscape, saw an 8% dip in cheddar shipments to the EU in 2025. However, this was somewhat balanced by fresh trade agreements with Japan and Australia.
In the face of carbon taxes and Scope-3 mandates, the Netherlands, Belgium, and Denmark have made tough choices, including herd reductions. Yet, they've simultaneously ramped up methane-capture initiatives. Exports of Dutch Gouda and Edam saw a 5% uptick, underscoring the strength of brand equity in the market. Poland is carving out a niche as a cost-effective processing hub for Central Europe, drawing in greenfield investments from global players. Sweden is at the forefront of organic and lactose-free innovations, while Russia is boosting its domestic dairy output to curtail imports. Other European sub-regions, though showcasing fragmented capacities, are making their mark with niche offerings like sheep-milk cheeses and fermented beverages, adding depth to the continent's dairy narrative.
Competitive Landscape
Europe's dairy market, with a moderate concentration, reflects moderate fragmentation. Cooperatives such as Arla Foods and FrieslandCampina play a significant role by utilizing farmer ownership models to stabilize supply chains and invest in methane-reduction infrastructure. Multinational corporations, including Lactalis and Danone, are refining their portfolios to focus on high-value segments such as premium cheese, probiotic yogurt, and plant-based dairy hybrids. Arla Foods has introduced its Climate Check label across its entire product range, strengthening its connection with environmentally conscious consumers. Lactalis, aiming to solidify its leadership in the soft-cheese segment, executed a series of regional acquisitions during 2024-2025, including the purchase of a Romanian processor that added 200,000 tons of annual production capacity.
Emerging disruptors are reshaping the market by leveraging precision fermentation technologies and direct-to-consumer distribution channels. FrieslandCampina, in partnership with DSM-Firmenich, has committed EUR 50 million to a joint venture focused on the commercialization of microbial casein and whey by 2028, opening new pathways for alternative protein solutions. Danone has strategically divested low-growth assets to concentrate on gut-health platforms across Europe, reinforcing its competitive positioning in this niche. The adoption of digital technologies is accelerating across the industry, with AI-driven demand forecasting, blockchain-enabled traceability, and robotics being employed to enhance operational efficiency, reduce waste, and lower costs.
Looking ahead, moderate consolidation is anticipated within the European dairy market as Scope-3 carbon emission pressures and carbon levies increasingly favor larger-scale operations. However, despite these trends, artisanal and niche players are expected to maintain their presence, preserving the diversity of competitive offerings in the market. This dynamic ensures that while larger players may dominate in terms of scale and efficiency, smaller producers will continue to cater to specialized consumer preferences, sustaining a vibrant and varied competitive landscape in Europe's dairy sector.
Europe Dairy Industry Leaders
Arla Foods Amba
Danone SA
Groupe Lactalis
Nestlé SA
Unilever PLC
- *Disclaimer: Major Players sorted in no particular order

Recent Industry Developments
- April 2025: Arla Foods and DMK Group have announced plans to merge, aiming to form Europe's largest dairy cooperative. The combined entity is expected to generate annual revenue of approximately EUR 19 billion, bringing together over 12,000 farmers and extensive processing operations across multiple European markets. A decision regarding the merger is expected by mid-June 2025. This development is set to reshape the competitive dynamics of the European dairy sector while providing significant scale efficiencies for member farmers.
- June 2025: Albert Heijn, in partnership with Farm Dairy and PlanetDairy, has introduced private-label hybrid dairy-plant milk blends across the Netherlands. These blends combine 60-70% traditional dairy with 30-40% plant-based ingredients, offering a sustainable option while preserving the familiar dairy taste. This launch highlights a significant advancement in the growing hybrid dairy alternatives category.
- November 2024: The joint venture between Lactalis and Nestlé has introduced "Piacere di Yogurt," a premium yogurt line, in Italy. This product, enriched with milk cream to deliver a velvety texture, targets the indulgent dairy segment. This launch marks a strategic move for both companies, transitioning from basic and functional yogurt categories to the high-margin premium market, leveraging their combined expertise in dairy processing and brand development.
- May 2024: Arla Foods, a prominent European dairy cooperative, and Mondelēz International, a global confectionery leader, have collaborated to launch Milka chocolate milk. This partnership showcases the integration of dairy expertise with confectionery brand strength while emphasizing their shared goal of driving innovation and expanding into markets beyond the traditional dairy category.


Europe Dairy Market Report Scope
Butter, Cheese, Cream, Dairy Desserts, Milk, Sour Milk Drinks, Yogurt are covered as segments by Category. Off-Trade, On-Trade are covered as segments by Distribution Channel. Belgium, France, Germany, Italy, Netherlands, Russia, Spain, Turkey, United Kingdom are covered as segments by Country.| Butter | ||
| Cheese | Natural Cheese | Cheddar |
| Cottage | ||
| Ricotta | ||
| Parmesan | ||
| Others | ||
| Processed Cheese | ||
| Cream | Fresh Cream | |
| Cooking Cream | ||
| Whippng Cream | ||
| Others (Clottted, Sour Cream) | ||
| Dairy Desserts | Ice Cream | |
| Cheesecakes | ||
| Frozen Desserts | ||
| Others (Puddings/desserts, trifles, fools) | ||
| Milk | Condensed milk | |
| Flavored Milk | ||
| Fresh Milk | ||
| UHT Milk (Ultra-high temperature milk) | ||
| Powdered Milk | ||
| Yogurt | Drinkable | |
| Spoonable | ||
| Sour Milk Drinks | ||
| On-trade | |
| Off-trade | Convenience Stores |
| Specialist Retailers | |
| Supermarkets and Hypermarkets | |
| On-line Retail | |
| Others (Warehouse clubs, gas stations, etc.) |
| United Kingdom |
| Germany |
| France |
| Italy |
| Spain |
| Russia |
| Sweden |
| Belgium |
| Poland |
| Netherlands |
| Rest of Europe |
| By Product Type | Butter | ||
| Cheese | Natural Cheese | Cheddar | |
| Cottage | |||
| Ricotta | |||
| Parmesan | |||
| Others | |||
| Processed Cheese | |||
| Cream | Fresh Cream | ||
| Cooking Cream | |||
| Whippng Cream | |||
| Others (Clottted, Sour Cream) | |||
| Dairy Desserts | Ice Cream | ||
| Cheesecakes | |||
| Frozen Desserts | |||
| Others (Puddings/desserts, trifles, fools) | |||
| Milk | Condensed milk | ||
| Flavored Milk | |||
| Fresh Milk | |||
| UHT Milk (Ultra-high temperature milk) | |||
| Powdered Milk | |||
| Yogurt | Drinkable | ||
| Spoonable | |||
| Sour Milk Drinks | |||
| By Distribution Channel | On-trade | ||
| Off-trade | Convenience Stores | ||
| Specialist Retailers | |||
| Supermarkets and Hypermarkets | |||
| On-line Retail | |||
| Others (Warehouse clubs, gas stations, etc.) | |||
| By Geography | United Kingdom | ||
| Germany | |||
| France | |||
| Italy | |||
| Spain | |||
| Russia | |||
| Sweden | |||
| Belgium | |||
| Poland | |||
| Netherlands | |||
| Rest of Europe | |||


Market Definition
- Butter - Butter is a yellow-to-white solid emulsion of fat globules, water, and inorganic salts produced by churning the cream from cows’ milk
- Dairy - Dairy product include milk and any of the foods made from milk, including butter, cheese, ice cream, yogurt, and condensed and dried milk.
- Frozen Desserts - Frozen dairy dessert means and includes products containing milk or cream and other ingredients which are frozen or semi-frozen prior to consumption, such as ice milk or sherbet, including frozen dairy desserts for special dietary purposes, and sorbet
- Sour Milk Drinks - Sour milk is thick, curdled milk, with a sour taste, obtained from the fermentation of milk. Sour milk drinks such as kefir, laban, buttermilk have been considered in the study
| Keyword | Definition |
|---|---|
| Cultured Butter | Cultured butter is prepared by having the raw butter go through chemical processing and has been added with certain emulsifiers and foreign ingredients. |
| Uncultured Butter | This type of butter is one which has not been processed in any way |
| Natural Cheese | The type of cheese in its most natural form. It is made from natural and simple products and ingredients, including fresh and natural salts, natural colors, enzymes, and high-quality milk. |
| Processed Cheese | Processed cheese undergoes the same processes as natural cheese; however, it requires more steps and many different forms of ingredients. Making processed cheese involves melting natural cheese, emulsifying it, and adding preservatives and other artificial ingredients or colorings. |
| Single Cream | Single cream contains around 18% fat. It’s a single layer of cream that appears over boiled milk. |
| Double Cream | Double cream contains 48% fat, more than double the amount of fat of single cream. It’s heavier and thicker than single cream |
| Whipping Cream | This has a much higher fat percentage than single cream (36%). Used to top cakes, pies, and puddings and as a thickener for sauces, soups, and fillings. |
| Frozen Desserts | Desserts that are meant to be eaten in frozen condition. E.g., sherbets, sorbets, frozen yogurts |
| UHT Milk (Ultra-high temperature milk) | Milk heated at a very high temperature. Ultra-high-temperature processing (UHT) of milk involves heating for 1–8 sec at 135–154°C. which kills the spore-forming pathogenic microorganism, resulting in a product with a shelf-life of several months. |
| Non-dairy butter/Plant-based butter | Butter made from plant-derived oil such as coconut, palm, etc. |
| Non-dairy Yogurt | Yogurt made from typically made from nuts, like almonds, cashews, coconuts, and even other foods like soybeans, plantains, oats, and peas |
| On-trade | It refers to restaurants, QSRs, and bars. |
| Off-trade | It refers to supermarkets, hypermarkets, on-line channels, etc. |
| Neufchatel cheese | One of the oldest kinds of cheese in France. It is a soft, slightly crumbly, mold-ripened, bloomy-rind cheese made in the Neufchâtel-en-Bray region of Normandy. |
| Flexitarian | It refers to a consumer preferring a semi-vegetarian diet, that is centered on plant foods with limited or occasional inclusion of meat. |
| Lactose Intolerance | Lactose intolerance is a reaction in digestive system to lactose, the sugar in milk. It causes uncomfortable symptoms in response to the consumption of dairy products. |
| Cream Cheese | Cream cheese is a soft and creamy fresh cheese with a tangy taste made from milk and cream. |
| Sorbets | Sorbet is a frozen dessert made using ice combined with fruit juice, fruit purée, or other ingredients, such as wine, liqueur, or honey. |
| Sherbet | Sherbet is a sweetened frozen dessert made with fruit and some sort of dairy product such as milk or cream. |
| Shelf stable | Foods that can be safely stored at room temperature, or "on the shelf," for at least one year and do not have to be cooked or refrigerated to eat safely. |
| DSD | Direct Store Delivery is the process in supply chain management wherein the product is delivered from manufacturing plant directly to the retailer. |
| OU Kosher | Orthodox Union Kosher is a kosher certification agency based in New York City. |
| Gelato | Gelato is a frozen creamy dessert made with milk, heavy cream and sugar. |
| Grass-fed Cows | Grass-fed cows are allowed to graze in pastures, where they eat a variety of grasses and clover. |


Research Methodology
Mordor Intelligence follows a four-step methodology in all our reports.
- Step-1: Identify Key Variables: In order to build a robust forecasting methodology, the variables and factors identified in Step 1 are tested against available historical market numbers. Through an iterative process, the variables required for market forecast are set, and the model is built on the basis of these variables.
- Step-2: Build a Market Model: Market-size estimations for the forecast years are in nominal terms. Inflation is not a part of the pricing, and the average selling price (ASP) is kept constant throughout the forecast period for each country.
- Step-3: Validate and Finalize: In this important step, all market numbers, variables, and analyst calls are validated through an extensive network of primary research experts from the market studied. The respondents are selected across levels and functions to generate a holistic picture of the market studied.
- Step-4: Research Outputs: Syndicated Reports, Custom Consulting Assignments, Databases & Subscription Platforms


